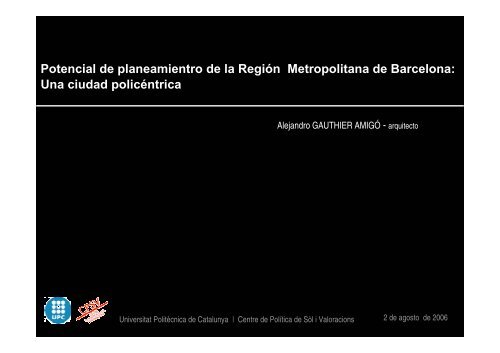
Potencial de planeamientro de la Región Metropolitana de Barcelona
Potencial de planeamientro de la Región Metropolitana de Barcelona
Potencial de planeamientro de la Región Metropolitana de Barcelona

Create successful ePaper yourself
Turn your PDF publications into a flip-book with our unique Google optimized e-Paper software.
<strong>Potencial</strong> <strong>de</strong> <strong>p<strong>la</strong>neamientro</strong> <strong>de</strong> <strong>la</strong> <strong>Región</strong> <strong>Metropolitana</strong> <strong>de</strong> <strong>Barcelona</strong>:<br />
Una ciudad policéntrica<br />
Alejandro GAUTHIER AMIGÓ - arquitecto<br />
Universitat Politècnica <strong>de</strong> Catalunya | Centre <strong>de</strong> Política <strong>de</strong> Sòl i Valoracions<br />
2 <strong>de</strong> agosto <strong>de</strong> 2006
La <strong>Región</strong> <strong>Metropolitana</strong> <strong>de</strong> <strong>Barcelona</strong>
LA REGION METROPOLITANA DE BARCELONA
Datos <strong>de</strong>l censo 2001 (RMB)<br />
3.100 km² km<br />
4.390.000 habitantes<br />
1.963.000 puestos <strong>de</strong> trabajo<br />
1.951.000 trabajadores<br />
75% PIB Catalunya y 13% PIB España Espa<br />
AMB 213 municipios<br />
RMB 164 municipios
EL ÁREA METROPOLITANA FUNCIONAL
Pob<strong>la</strong>ción 2001 (personas)<br />
Actividad económica 2001 (LTL)
POBLACIÓN Y ACTIVIDAD ECONÓMICA<br />
Concentración<br />
45%<br />
40%<br />
35%<br />
30%<br />
25%<br />
20%<br />
15%<br />
10%<br />
5%<br />
0%<br />
0 10 20 30 40 50 60<br />
Distancia <strong>de</strong>s<strong>de</strong> Bcn (Km)<br />
Pob<strong>la</strong>ción<br />
2001<br />
LTL 1996
LOCALIZACIÓN DE LA ACTIVIDAD ECONÓMICA<br />
Concentración<br />
50%<br />
40%<br />
30%<br />
20%<br />
10%<br />
0%<br />
0 10 20 30 40 50 60<br />
Distancia <strong>de</strong>s<strong>de</strong> Bcn (Km)<br />
Empleados <strong>de</strong> Oficinas<br />
Trabajadores <strong>de</strong> serivios y<br />
ven<strong>de</strong>dores <strong>de</strong> comercio<br />
Trabajadores cualificados <strong>de</strong> <strong>la</strong>s<br />
industrias y <strong>la</strong> construccion<br />
Operadores <strong>de</strong> insta<strong>la</strong>ciones,<br />
maquinaria y montadores
DENSIDAD DEMOGRÁFICA Y ECONÓMICA (2001)<br />
Concentración<br />
45%<br />
40%<br />
35%<br />
30%<br />
25%<br />
20%<br />
15%<br />
10%<br />
5%<br />
Localización <strong>de</strong> <strong>la</strong> Pob y los LTLs<br />
0%<br />
0 10 20 30 40 50 60<br />
Distancia <strong>de</strong>s<strong>de</strong> Bcn (Km)<br />
Pob<strong>la</strong>ción<br />
2001<br />
LTL 1996<br />
Densidad 1.000 localizadores /km^2<br />
16,0<br />
14,0<br />
12,0<br />
10,0<br />
8,0<br />
6,0<br />
4,0<br />
2,0<br />
Densidad <strong>de</strong> ocupación <strong>de</strong>l territorio<br />
0,0<br />
0 10 20 30 40 50 60<br />
Distancia <strong>de</strong>s<strong>de</strong> Bcn (Km)<br />
Pob<strong>la</strong>ción<br />
2001<br />
LTL 1996
Oficinas<br />
Operadores y montadores
ESPECIALIZACIÓN TERRITORIAL.<br />
Coeficiente <strong>de</strong> localización<br />
1,50<br />
1,40<br />
1,30<br />
1,20<br />
1,10<br />
1,00<br />
0,90<br />
0,80<br />
0,70<br />
0,60<br />
R 2 = 0,3136<br />
R 2 = 0,6042<br />
R 2 = 0,0648<br />
R 2 =0,7665<br />
0 10 20 30 40 50 60 70<br />
Distancia <strong>de</strong>s<strong>de</strong> Bcn (Km)<br />
Empleados <strong>de</strong> Oficinas Empleados <strong>de</strong>l comercio y otros servicios<br />
Empleados <strong>de</strong> <strong>la</strong> industria y <strong>la</strong> construccion Operadores <strong>de</strong> insta<strong>la</strong>ciones, maquinaria y montadores<br />
Lineal (Empleados <strong>de</strong>l comercio y otros servicios) Lineal (Empleados <strong>de</strong> Oficinas)<br />
Lineal (Operadores <strong>de</strong> insta<strong>la</strong>ciones, maquinaria y montadores) Lineal (Empleados <strong>de</strong> <strong>la</strong> industria y <strong>la</strong> construccion)
LA ACTIVIDAD ECONÓMICA TAMBIÉN SE DESCENTRALIZA<br />
Concentración <strong>de</strong>l empleo<br />
60%<br />
50%<br />
40%<br />
30%<br />
20%<br />
10%<br />
0%<br />
0 10 20 30 40 50 60 70<br />
Km <strong>de</strong>s<strong>de</strong> <strong>Barcelona</strong><br />
1981 (%) 1986 (%) 1991 (%) 1996 (%) 2001 (%) 2001-1981 (p 2.001<br />
Bcn 52% 51% 48% 43% 42% - 10,27 818.164<br />
Bcn-10 km 8% 7% 7% 7% 7% - 1,15 129.553<br />
10-20 km 14% 14% 16% 18% 18% 3,49 346.917<br />
20-30 km 16% 17% 18% 20% 21% 4,73 404.547<br />
30-40 km 4% 5% 5% 6% 7% 2,30 130.978<br />
40-50 km 3% 3% 3% 3% 4% 0,51 72.007<br />
50-60 km 2% 2% 2% 2% 3% 0,38 49.230<br />
RMB 100% 100% 100% 100% 100% -<br />
LTL81<br />
LTL86<br />
LTL91<br />
LTL96<br />
LTL01<br />
Fuente: matriz <strong>de</strong> movilidad Censo 1981,1991 y 2001; y Padrón 1986 y 1996 (INE e IDESCAT)<br />
1.951.396
El crecimiento <strong>de</strong> los lugares <strong>de</strong> trabajo en <strong>la</strong><br />
última década.<br />
1991-2001<br />
<strong>Barcelona</strong>-ciudad creció 56.000 ltls (+7,5%)<br />
Resto <strong>de</strong> <strong>la</strong> RMB creció 318.770 ltls (+38,5%)<br />
1<br />
+<br />
2<br />
+<br />
3<br />
+<br />
4<br />
+<br />
Sistemas urbanos<br />
primarios<br />
+<br />
Centralización absoluta<br />
+<br />
+<br />
Centralización re<strong>la</strong>tiva<br />
+<br />
+<br />
Descentralización re<strong>la</strong>tiva<br />
+<br />
Descentralización absoluta<br />
Áreas no urbanas<br />
Cen<br />
Centralización absoluta<br />
Centralización re<strong>la</strong>tiva<br />
<strong>de</strong>scentralización re<strong>la</strong>tiva<br />
<strong>de</strong>scentralización absoluta
La reorganización espacial <strong>de</strong> <strong>la</strong> economía<br />
metropolitana
La reestructuración metropolitana <strong>de</strong> <strong>la</strong> oferta <strong>de</strong> trabajo<br />
Análisis por sectores
¿dón<strong>de</strong> <strong>de</strong>crece más <strong>la</strong> industria?<br />
Algoritmo: (RGSS 2001-RGSS 1991)/RGSS 1991
¿dón<strong>de</strong> crece más el terciario?<br />
Algoritmo: (RGSS 2001-RGSS 1991)/RGSS 1991
0%<br />
10%<br />
20%<br />
30%<br />
40%<br />
50%<br />
60%<br />
70%<br />
80%<br />
90%<br />
100%<br />
Estructura espacial <strong>de</strong> l'ocupació<br />
RGSS 1991<br />
0 9 17 25 35 51 67<br />
Distancia <strong>de</strong>s <strong>de</strong> Bcn (km)<br />
¿Cómo se reestructura <strong>la</strong> composición<br />
espacial <strong>de</strong> <strong>la</strong> actividad económica?<br />
1991 2001<br />
Serveis<br />
Construcció<br />
Indústria<br />
Agricultura y<br />
NC<br />
Estructura espacial <strong>de</strong> l'ocupació<br />
RGSS 1991<br />
0 9 17 25 35 51 67<br />
0%<br />
10%<br />
20%<br />
30%<br />
40%<br />
50%<br />
60%<br />
70%<br />
80%<br />
90%<br />
100%<br />
Distancia <strong>de</strong>s <strong>de</strong> Bcn (km)<br />
Serveis<br />
Construcció<br />
Indústria<br />
Agricultura y NC
Los Nuevos Proyectos Urbanos <strong>de</strong> <strong>Barcelona</strong>
Poble Nou 22@
NUEVO CAMPUS UNIVERSITARIO
Fòrum 2004/Front Litoral Besòs
Sagrera/Sant Andreu
Marina Badalona
Centre Direccional Cerdanyo<strong>la</strong>
Centre Direccional <strong>de</strong>l Prat
Districte Econòmic Gran Via
Tau<strong>la</strong> resum <strong>de</strong>l potencial <strong>de</strong> sostre edificable en els sectors <strong>de</strong> transformació <strong>de</strong> <strong>la</strong> Gran Via<br />
Ús Sostre Proporció<br />
Habitatge 195.470<br />
Comerç 170.828<br />
Indústria 160.241<br />
Equipment/serveis 525.293<br />
Oficines 492.565<br />
Font: ADU (octubre 2002) "Gran Vía Districte Económic"<br />
1.544.397<br />
13%<br />
11%<br />
10%<br />
34%<br />
32%<br />
100%<br />
32%<br />
34%<br />
13%<br />
11%<br />
10%
Parc Mediterrani <strong>de</strong> Castell<strong>de</strong>fels<br />
82%
NUEVO CAMPUS UNIVERSITARIO
Parc <strong>de</strong> Negocis <strong>de</strong> Vi<strong>la</strong><strong>de</strong>cans
Ciutat Esportiva- Eix tecnológic <strong>de</strong> Cornellà
Aeroport zona <strong>de</strong> càrrega i d’activitats
Zona d’activitats Logístiques i Port
Parc Logístic <strong>de</strong> <strong>la</strong> Zona Franca
Sostre sobre rasant<br />
Activitat econòmica<br />
Habitatge<br />
(4)<br />
<strong>Barcelona</strong> 4.908.498<br />
Resta EMT 5.381.798<br />
Arc Metropolità (7c-s) 11.802.214<br />
Resta Arc Metropolità 10.202.160<br />
RMB 32.294.670<br />
Composició <strong>de</strong>l sostre sobre rasant<br />
<strong>Potencial</strong> <strong>de</strong> techo <strong>de</strong> p<strong>la</strong>neamiento<br />
Equipament i<br />
serveis tècnics (1)<br />
Total sobre<br />
rasant<br />
sota rasant sostre total<br />
Aparcament (2) Sostre total<br />
A B C D=A+B+C E F=D+E %F<br />
Habitatge<br />
50%<br />
5.273.587<br />
4.230.889<br />
18.864.066<br />
12.046.622<br />
40.415.163<br />
Equipament i<br />
serveis tècnics (1)<br />
10%<br />
553.142<br />
2.268.002<br />
1.995.371<br />
2.885.262<br />
7.701.777<br />
10.735.227<br />
11.880.688<br />
32.661.651<br />
25.134.044<br />
80.411.610<br />
2.697.769<br />
3.241.251<br />
7.552.080<br />
5.336.472<br />
18.827.572<br />
Activitat econòmica<br />
(4)<br />
40%<br />
Notes: (1) Els equipaments locals han estat estimats en funció <strong>de</strong>ls estàndars urbanístics<br />
(2) El sostre <strong>de</strong> aparcament és una estimació pròpia basada en les NNUU <strong>de</strong>ls p<strong>la</strong>ns Font: CPSV<br />
(3) És refereix a sostre amb p<strong>la</strong>nificació <strong>de</strong>rivada aprovada<br />
(4) Agrupa a les activitats: oficines, terciari, comercial, hotels, indústria, logística i parc tecnológic<br />
13.432.996<br />
15.121.939<br />
40.213.731<br />
30.470.516<br />
99.239.181<br />
%<br />
aprovat<br />
(3)<br />
82%<br />
46%<br />
24%<br />
27%<br />
36%
Composición <strong>de</strong> los puestos <strong>de</strong> trabajo potenciales<br />
Composició <strong>de</strong>ls llocs <strong>de</strong> treball potencials<br />
Llocs per activitat sobre rasant<br />
Terciari,<br />
Oficines comercial i<br />
Hotels<br />
<strong>Barcelona</strong> 91.204<br />
Resta EMT 76.932<br />
Arc Metropolità (7c-s) -<br />
Resta Arc Metropolità 31.096<br />
RMB 199.232<br />
Industrial, logistic<br />
i parc tecnològic<br />
Equipaments i<br />
serveis tècnics<br />
(1)<br />
sota rasant total<br />
Aparcament (2) Llocs totals<br />
A B C D E SUM (A…E)<br />
21.789<br />
35.149<br />
72.316<br />
61.543<br />
190.798<br />
Composició <strong>de</strong>ls llocs <strong>de</strong> treball <strong>de</strong>l sostre sobre rasant<br />
Industrial, logistic i<br />
parc tecnològic<br />
40%<br />
Equipaments i<br />
serveis tècnics (1)<br />
8%<br />
26.793<br />
26.590<br />
143.854<br />
114.738<br />
311.975<br />
Aparcament (2)<br />
1%<br />
4.610<br />
18.900<br />
16.628<br />
24.044<br />
Notes: (1) Els equipaments locals han estat estimats en funció <strong>de</strong>ls estàndars urbanístics<br />
(2) El sostre <strong>de</strong> aparcament és una estimació pròpia basada en les NNUU <strong>de</strong>ls p<strong>la</strong>ns Font: CPSV<br />
64.181<br />
1.226<br />
1.473<br />
3.433<br />
2.426<br />
8.558<br />
Oficines<br />
26%<br />
Terciari, comercial i<br />
Hotels<br />
25%<br />
145.622<br />
159.045<br />
236.231<br />
233.847<br />
774.744