Estudio de la respuesta inmune humoral y celular ... - edigraphic.com
Estudio de la respuesta inmune humoral y celular ... - edigraphic.com
Estudio de la respuesta inmune humoral y celular ... - edigraphic.com

You also want an ePaper? Increase the reach of your titles
YUMPU automatically turns print PDFs into web optimized ePapers that Google loves.
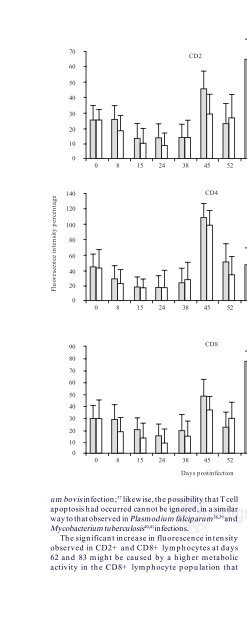
Fluorescence intensity percentage<br />
70<br />
60<br />
50<br />
40<br />
30<br />
20<br />
10<br />
0<br />
140<br />
120<br />
100<br />
80<br />
60<br />
40<br />
20<br />
0<br />
90<br />
80<br />
70<br />
60<br />
50<br />
40<br />
30<br />
20<br />
10<br />
0<br />
CD2<br />
0 8 15 24 38 45 52 62 83 90 98<br />
CD4<br />
0 8 15 24 38 45 52 62 83 90 98<br />
CD8<br />
0 8 15 24 38 45 52 62 83 90 98<br />
Days postinfection<br />
um bovis infection; 37 likewise, the possibility that T cell<br />
apoptosis had occurred cannot be ignored, in a simi<strong>la</strong>r<br />
way to that observed in P<strong>la</strong>smodium falciparum 38,39 and<br />
Mycobacterium tuberculosis 40,41 infections.<br />
The significant increase in fluorescence intensity<br />
observed in CD2+ and CD8+ lymphocytes at days<br />
62 and 83 might be caused by a higher metabolic<br />
activity in the CD8+ lymphocyte popu<strong>la</strong>tion that<br />
*<br />
* *<br />
ñar o establecer medidas inmunoprofilácticas efectivas<br />
<strong>de</strong> control. En este sentido, <strong>la</strong> información generada<br />
en el presente estudio es una contribución más para<br />
el esc<strong>la</strong>recimiento <strong>de</strong> dichos mecanismos.<br />
En cuanto a los resultados, una probable explicación<br />
<strong>de</strong>l marcado <strong>de</strong>scenso <strong>de</strong> los linfocitos CD4+ y CD8+<br />
el día 45 pi observado, es que éstos se hayan localizado<br />
en mayor proporción en órganos linfoi<strong>de</strong>s secundarios<br />
<strong>edigraphic</strong>.<strong>com</strong><br />
*<br />
Figura Figura 3. 3. Porcentaje <strong>de</strong> intensidad <strong>de</strong><br />
fluorescencia <strong>de</strong> linfocitos CD2, CD4 y<br />
CD8 <strong>de</strong> bovinos infectados y<br />
reinfectados (n = 4 barras grises) con el<br />
ais<strong>la</strong>do MEX-17-029-01 <strong>de</strong> Anap<strong>la</strong>sma<br />
marginale (infección día 0 con 1 × 10⁸ eritrocitos parasitados, EP; reinfección<br />
día 60 con 2 × 10⁸ EP) y <strong>de</strong> animales no<br />
infectados (n = 3 barras b<strong>la</strong>ncas). Cada<br />
punto representa el promedio + error<br />
estándar. * P < 0.05.<br />
Percentage of fluorescence intensity in<br />
CD2, CD4 and CD8 lymphocytes from<br />
infected and reinfected cattle (n = 4<br />
gray columns) with the Anap<strong>la</strong>sma<br />
marginale MEX-17-029-01 iso<strong>la</strong>te<br />
(infection at day 0 with 1 × 10⁸ parasitized erithrocytes, PE; reinfection<br />
at day 60 with 2 × 10⁸ PE) and from noninfected<br />
animals (n=3 white columns).<br />
Each point represents the mean + standard<br />
error. *P < 0.05.<br />
MG MG MG MG MG VV<br />
Vet. VV<br />
MM<br />
Méx., MM<br />
34 (3) 2003 255<br />
255