2º Trim 2011 - Servicio Público de Empleo Estatal
2º Trim 2011 - Servicio Público de Empleo Estatal
2º Trim 2011 - Servicio Público de Empleo Estatal

Create successful ePaper yourself
Turn your PDF publications into a flip-book with our unique Google optimized e-Paper software.
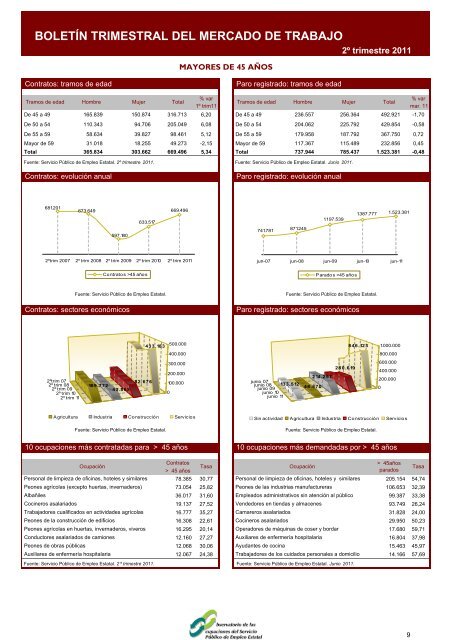
BOLETÍN TRIMESTRAL DEL MERCADO DE TRABAJO<br />
Contratos: tramos <strong>de</strong> edad Paro registrado: tramos <strong>de</strong> edad<br />
<strong>2º</strong> trimestre <strong>2011</strong><br />
Tramos <strong>de</strong> edad Hombre Mujer Total<br />
% var<br />
1º trim11<br />
Tramos <strong>de</strong> edad Hombre Mujer<br />
Total<br />
% var<br />
mar. 11<br />
De 45 a 49 165.839 150.874 316.713 6,20 De 45 a 49 236.557 256.364 492.921 -1,70<br />
De 50 a 54 110.343 94.706 205.049 6,08 De 50 a 54 204.062 225.792 429.854 -0,58<br />
De 55 a 59 58.634 39.827 98.461 5,12 De 55 a 59 179.958 187.792 367.750 0,72<br />
Mayor <strong>de</strong> 59 31.018 18.255 49.273 -2,15 Mayor <strong>de</strong> 59 117.367 115.489 232.856 0,45<br />
Total 365.834 303.662 669.496 5,34 Total 737.944 785.437 1.523.381 -0,48<br />
Fuente: <strong>Servicio</strong> <strong>Público</strong> <strong>de</strong> <strong>Empleo</strong> <strong>Estatal</strong>. <strong>2º</strong> trimestre <strong>2011</strong>. Fuente: <strong>Servicio</strong> <strong>Público</strong> <strong>de</strong> <strong>Empleo</strong> <strong>Estatal</strong>. Junio <strong>2011</strong>.<br />
Contratos: evolución anual Paro registrado: evolución anual<br />
681.201<br />
673.649<br />
597.180<br />
633.517<br />
Fuente: <strong>Servicio</strong> <strong>Público</strong> <strong>de</strong> <strong>Empleo</strong> <strong>Estatal</strong>. Fuente: <strong>Servicio</strong> <strong>Público</strong> <strong>de</strong> <strong>Empleo</strong> <strong>Estatal</strong>.<br />
Contratos: sectores económicos Paro registrado: sectores económicos<br />
Fuente: <strong>Servicio</strong> <strong>Público</strong> <strong>de</strong> <strong>Empleo</strong> <strong>Estatal</strong>.<br />
MAYORES DE 45 AÑOS<br />
669.496<br />
<strong>2º</strong>trim 2007 <strong>2º</strong> trim 2008 <strong>2º</strong> trim 2009 <strong>2º</strong> trim 2010 <strong>2º</strong> trim <strong>2011</strong><br />
<strong>2º</strong>trim 07<br />
<strong>2º</strong> trim 08<br />
<strong>2º</strong> trim 09<br />
<strong>2º</strong> trim 10<br />
<strong>2º</strong> trim 11<br />
109.772<br />
Contratos >45 años<br />
43.865<br />
82.676<br />
433.183<br />
0<br />
500.000<br />
400.000<br />
300.000<br />
200.000<br />
100.000<br />
Agricultura Industria Construcción <strong>Servicio</strong>s<br />
Fuente: <strong>Servicio</strong> <strong>Público</strong> <strong>de</strong> <strong>Empleo</strong> <strong>Estatal</strong>.<br />
10 ocupaciones más contratadas para > 45 años 10 ocupaciones más <strong>de</strong>mandadas por > 45 años<br />
Ocupación<br />
Contratos<br />
> 45 años<br />
Tasa Ocupación<br />
> 45años<br />
parados<br />
Tasa<br />
Personal <strong>de</strong> limpieza <strong>de</strong> oficinas, hoteles y similares 78.385 30,77 Personal <strong>de</strong> limpieza <strong>de</strong> oficinas, hoteles y similares 205.154 54,74<br />
Peones agrícolas (excepto huertas, inverna<strong>de</strong>ros) 73.054 25,82 Peones <strong>de</strong> las industrias manufactureras<br />
106.653 32,39<br />
Albañiles 36.017 31,60 Empleados administrativos sin atención al público<br />
99.387 33,38<br />
Cocineros asalariados<br />
19.137 27,52 Ven<strong>de</strong>dores en tiendas y almacenes<br />
93.749 26,24<br />
Trabajadores cualificados en activida<strong>de</strong>s agrícolas 16.777 35,27 Camareros asalariados<br />
31.828 24,00<br />
Peones <strong>de</strong> la construcción <strong>de</strong> edificios 16.308 22,61 Cocineros asalariados<br />
29.950 50,23<br />
Peones agrícolas en huertas, inverna<strong>de</strong>ros, viveros 16.295 20,14 Operadores <strong>de</strong> máquinas <strong>de</strong> coser y bordar<br />
17.680 59,71<br />
Conductores asalariados <strong>de</strong> camiones 12.160 27,27 Auxiliares <strong>de</strong> enfermería hospitalaria<br />
16.804 37,98<br />
Peones <strong>de</strong> obras públicas 12.068 30,06 Ayudantes <strong>de</strong> cocina<br />
15.463 45,97<br />
Auxiliares <strong>de</strong> enfermería hospitalaria 12.067 24,38 Trabajadores <strong>de</strong> los cuidados personales a domicilio<br />
14.166 57,69<br />
Fuente: <strong>Servicio</strong> <strong>Público</strong> <strong>de</strong> <strong>Empleo</strong> <strong>Estatal</strong>. 2 º trimestre <strong>2011</strong>. Fuente: <strong>Servicio</strong> <strong>Público</strong> <strong>de</strong> <strong>Empleo</strong> <strong>Estatal</strong>. Junio <strong>2011</strong>.<br />
741.781<br />
871.245<br />
1.1 97.539<br />
1.387.777<br />
1 .523.381<br />
jun-07 jun-08 jun-09 jun-10 jun-11<br />
junio 07<br />
junio 08 133.512<br />
junio 09<br />
junio 10<br />
junio 11<br />
Parados >45 años<br />
214.257<br />
48.870<br />
280.619<br />
846.123<br />
600.000<br />
400.000<br />
200.000<br />
0<br />
1.000.000<br />
800.000<br />
Sin actividad Agricultura Industria Construcción <strong>Servicio</strong>s<br />
9