2º Trim 2011 - Servicio Público de Empleo Estatal
2º Trim 2011 - Servicio Público de Empleo Estatal
2º Trim 2011 - Servicio Público de Empleo Estatal

Create successful ePaper yourself
Turn your PDF publications into a flip-book with our unique Google optimized e-Paper software.
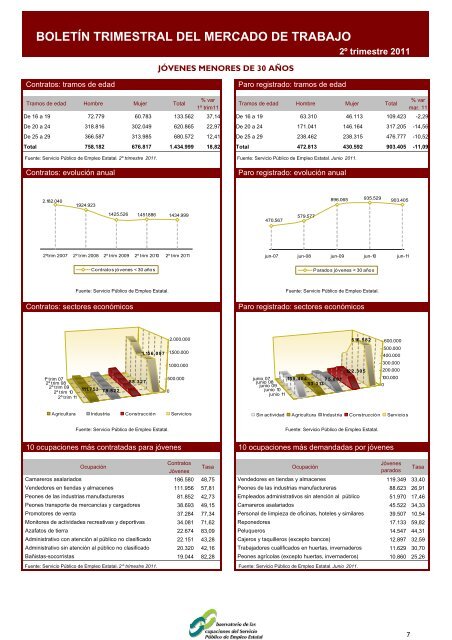
BOLETÍN TRIMESTRAL DEL MERCADO DE TRABAJO<br />
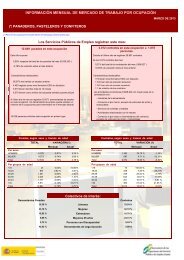
Contratos: tramos <strong>de</strong> edad Paro registrado: tramos <strong>de</strong> edad<br />
<strong>2º</strong> trimestre <strong>2011</strong><br />
Tramos <strong>de</strong> edad Hombre Mujer Total<br />
% var<br />
1º trim11<br />
Tramos <strong>de</strong> edad Hombre Mujer Total<br />
% var<br />
mar. 11<br />
De 16 a 19 72.779 60.783 133.562 37,14 De 16 a 19 63.310 46.113 109.423 -2,29<br />
De 20 a 24 318.816 302.049 620.865 22,97 De 20 a 24 171.041 146.164 317.205 -14,56<br />
De 25 a 29 366.587 313.985 680.572 12,41 De 25 a 29 238.462 238.315 476.777 -10,52<br />
Total 758.182 676.817 1.434.999 18,82 Total 472.813 430.592 903.405 -11,09<br />
Fuente: <strong>Servicio</strong> <strong>Público</strong> <strong>de</strong> <strong>Empleo</strong> <strong>Estatal</strong>. <strong>2º</strong> trimestre <strong>2011</strong>. Fuente: <strong>Servicio</strong> <strong>Público</strong> <strong>de</strong> <strong>Empleo</strong> <strong>Estatal</strong>. Junio <strong>2011</strong>.<br />
Contratos: evolución anual Paro registrado: evolución anual<br />
2.182.040<br />
1.924.923<br />
1.425.526<br />
1.451.886<br />
Fuente: <strong>Servicio</strong> <strong>Público</strong> <strong>de</strong> <strong>Empleo</strong> <strong>Estatal</strong>. Fuente: <strong>Servicio</strong> <strong>Público</strong> <strong>de</strong> <strong>Empleo</strong> <strong>Estatal</strong>.<br />
Contratos: sectores económicos Paro registrado: sectores económicos<br />
Fuente: <strong>Servicio</strong> <strong>Público</strong> <strong>de</strong> <strong>Empleo</strong> <strong>Estatal</strong>.<br />
JÓVENES MENORES DE 30 AÑOS<br />
1.434.999<br />
<strong>2º</strong>trim 2007 <strong>2º</strong> trim 2008 <strong>2º</strong> trim 2009 <strong>2º</strong> trim 2010 <strong>2º</strong> trim <strong>2011</strong><br />
1º t rim 07<br />
<strong>2º</strong> trim 08<br />
<strong>2º</strong> trim 09<br />
<strong>2º</strong> trim 10<br />
<strong>2º</strong> trim 11<br />
111.7 5 3<br />
Contratos jóvenes < 30 años<br />
78.822<br />
88.327<br />
1.156.097<br />
0<br />
2.000.000<br />
1.500.000<br />
1.000.000<br />
500.000<br />
Agricultura Industria Construcción <strong>Servicio</strong>s<br />
Fuente: <strong>Servicio</strong> <strong>Público</strong> <strong>de</strong> <strong>Empleo</strong> <strong>Estatal</strong>.<br />
10 ocupaciones más contratadas para jóvenes 10 ocupaciones más <strong>de</strong>mandadas por jóvenes<br />
Ocupación<br />
Contratos<br />
Jóvenes<br />
Tasa Ocupación<br />
Jóvenes<br />
parados<br />
Tasa<br />
Camareros asalariados 186.580 48,75 Ven<strong>de</strong>dores en tiendas y almacenes<br />
119.349 33,40<br />
Ven<strong>de</strong>dores en tiendas y almacenes 111.956 57,81 Peones <strong>de</strong> las industrias manufactureras<br />
88.623 26,91<br />
Peones <strong>de</strong> las industrias manufactureras 81.852 42,73 Empleados administrativos sin atención al público<br />
51.970 17,46<br />
Peones transporte <strong>de</strong> mercancías y cargadores<br />
38.693 49,15 Camareros asalariados<br />
45.522 34,33<br />
Promotores <strong>de</strong> venta 37.284 77,34 Personal <strong>de</strong> limpieza <strong>de</strong> oficinas, hoteles y similares 39.507 10,54<br />
Monitores <strong>de</strong> activida<strong>de</strong>s recreativas y <strong>de</strong>portivas 34.081 71,62 Reponedores<br />
17.133 59,82<br />
Azafatos <strong>de</strong> tierra 22.674 83,09 Peluqueros<br />
14.547 44,31<br />
Administrativo con atención al público no clasificado 22.151 43,28 Cajeros y taquilleros (excepto bancos)<br />
12.897 32,59<br />
Administrativo sin atención al público no clasificado 20.320 42,16 Trabajadores cualificados en huertas, inverna<strong>de</strong>ros<br />
11.629 30,70<br />
Bañistas-socorristas 19.044 82,28 Peones agrícolas (excepto huertas, inverna<strong>de</strong>ros)<br />
10.860 25,26<br />
470.567<br />
579.577<br />
896.065<br />
Fuente: <strong>Servicio</strong> <strong>Público</strong> <strong>de</strong> <strong>Empleo</strong> <strong>Estatal</strong>. 2 º trimestre <strong>2011</strong>. Fuente: <strong>Servicio</strong> <strong>Público</strong> <strong>de</strong> <strong>Empleo</strong> <strong>Estatal</strong>. Junio <strong>2011</strong>.<br />
935.529<br />
903.405<br />
jun-07 jun-08 jun-09 jun-10 jun-11<br />
junio 07 15 5 .4 0 4 75.801<br />
junio 08<br />
junio 09<br />
33.313<br />
junio 10<br />
junio 11<br />
Parados jóvenes < 30 años<br />
516.582<br />
122.305<br />
600.000<br />
500.000<br />
400.000<br />
300.000<br />
200.000<br />
100.000<br />
0<br />
Sin actividad Agricultura Industria Construcción <strong>Servicio</strong>s<br />
7