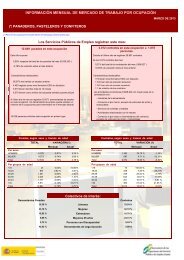
2º Trim 2011 - Servicio Público de Empleo Estatal
2º Trim 2011 - Servicio Público de Empleo Estatal
2º Trim 2011 - Servicio Público de Empleo Estatal

Create successful ePaper yourself
Turn your PDF publications into a flip-book with our unique Google optimized e-Paper software.
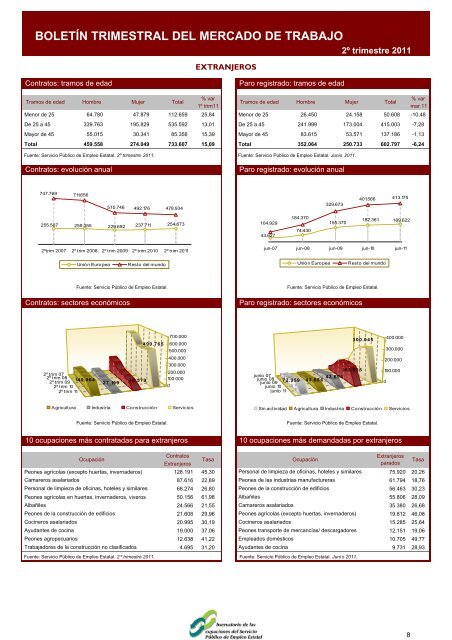
BOLETÍN TRIMESTRAL DEL MERCADO DE TRABAJO<br />
Contratos: tramos <strong>de</strong> edad Paro registrado: tramos <strong>de</strong> edad<br />
<strong>2º</strong> trimestre <strong>2011</strong><br />
Tramos <strong>de</strong> edad Hombre Mujer Total<br />
% var<br />
1º trim11<br />
Tramos <strong>de</strong> edad Hombre Mujer Total<br />
% var<br />
mar.11<br />
Menor <strong>de</strong> 25 64.780 47.879 112.659 25,84 Menor <strong>de</strong> 25 26.450 24.158 50.608 -10,48<br />
De 25 a 45 339.763 195.829 535.592 13,01 De 25 a 45 241.999 173.004 415.003 -7,28<br />
Mayor <strong>de</strong> 45 55.015 30.341 85.356 15,39 Mayor <strong>de</strong> 45 83.615 53.571 137.186 -1,13<br />
Total 459.558 274.049 733.607 15,09 Total 352.064 250.733 602.797 -6,24<br />
Fuente: <strong>Servicio</strong> <strong>Público</strong> <strong>de</strong> <strong>Empleo</strong> <strong>Estatal</strong>. <strong>2º</strong> trimestre <strong>2011</strong>. Fuente: <strong>Servicio</strong> <strong>Público</strong> <strong>de</strong> <strong>Empleo</strong> <strong>Estatal</strong>. Junio <strong>2011</strong>.<br />
Contratos: evolución anual Paro registrado: evolución anual<br />
747.769<br />
255.507<br />
711.656<br />
259.355<br />
51 0.746<br />
229.692<br />
492.176<br />
237.711<br />
Fuente: <strong>Servicio</strong> <strong>Público</strong> <strong>de</strong> <strong>Empleo</strong> <strong>Estatal</strong>. Fuente: <strong>Servicio</strong> <strong>Público</strong> <strong>de</strong> <strong>Empleo</strong> <strong>Estatal</strong>.<br />
Contratos: sectores económicos Paro registrado: sectores económicos<br />
Fuente: <strong>Servicio</strong> <strong>Público</strong> <strong>de</strong> <strong>Empleo</strong> <strong>Estatal</strong>.<br />
478.934<br />
254.673<br />
<strong>2º</strong>trim 2007 <strong>2º</strong> trim 2008 <strong>2º</strong> trim 2009 <strong>2º</strong> trim 201 0 <strong>2º</strong> trim <strong>2011</strong><br />
<strong>2º</strong> trim 07<br />
<strong>2º</strong> trim 08<br />
140.064<br />
<strong>2º</strong> trim 09<br />
<strong>2º</strong> trim 10<br />
<strong>2º</strong> trim 11<br />
Unión Europea Resto <strong>de</strong>l mundo<br />
27.199<br />
700.000<br />
490.765 600.000<br />
500.000<br />
400.000<br />
300.000<br />
200.000<br />
75.579 100.000<br />
0<br />
Agricultura Industria Construcción <strong>Servicio</strong>s<br />
EXTRANJEROS<br />
Fuente: <strong>Servicio</strong> <strong>Público</strong> <strong>de</strong> <strong>Empleo</strong> <strong>Estatal</strong>.<br />
10 ocupaciones más contratadas para extranjeros 10 ocupaciones más <strong>de</strong>mandadas por extranjeros<br />
Ocupación<br />
Contratos<br />
Extranjeros<br />
Tasa<br />
Ocupación<br />
Extranjeros<br />
parados<br />
Tasa<br />
Peones agrícolas (excepto huertas, inverna<strong>de</strong>ros) 128.191 45,30 Personal <strong>de</strong> limpieza <strong>de</strong> oficinas, hoteles y similares<br />
75.920 20,26<br />
Camareros asalariados<br />
87.616 22,89 Peones <strong>de</strong> las industrias manufactureras<br />
61.794 18,76<br />
Personal <strong>de</strong> limpieza <strong>de</strong> oficinas, hoteles y similares<br />
68.274 26,80 Peones <strong>de</strong> la construcción <strong>de</strong> edificios<br />
56.463 30,23<br />
Peones agrícolas en huertas, inverna<strong>de</strong>ros, viveros 50.156 61,98 Albañiles<br />
55.806 28,09<br />
Albañiles 24.566 21,55 Camareros asalariados<br />
35.380 26,68<br />
Peones <strong>de</strong> la construcción <strong>de</strong> edificios 21.608 29,96 Peones agrícolas (excepto huertas, inverna<strong>de</strong>ros)<br />
19.812 46,08<br />
Cocineros asalariados 20.995 30,19 Cocineros asalariados<br />
15.285 25,64<br />
Ayudantes <strong>de</strong> cocina 19.000 37,06 Peones transporte <strong>de</strong> mercancías/ <strong>de</strong>scargadores<br />
12.151 19,06<br />
Peones agropecuarios 12.638 41,22 Empleados domésticos<br />
10.705 49,77<br />
Trabajadores <strong>de</strong> la construcción no clasificados 4.695 31,20 Ayudantes <strong>de</strong> cocina<br />
9.731 28,93<br />
1 04.929<br />
1 55.370<br />
Fuente: <strong>Servicio</strong> <strong>Público</strong> <strong>de</strong> <strong>Empleo</strong> <strong>Estatal</strong>. 2 º trimestre <strong>2011</strong>. Fuente: <strong>Servicio</strong> <strong>Público</strong> <strong>de</strong> <strong>Empleo</strong> <strong>Estatal</strong>. Juni o <strong>2011</strong>.<br />
43.627<br />
1 84.370<br />
74.430<br />
329.673<br />
401.566<br />
1 82.361<br />
41 3.175<br />
1 89.622<br />
jun-07 jun-08 jun-09 jun-10 jun-11<br />
Unión Europea Resto <strong>de</strong>l mundo<br />
300.045<br />
400.000<br />
300.000<br />
200.000<br />
143.035 100.000<br />
junio 07<br />
junio 08 72.359<br />
junio 09<br />
junio 10<br />
junio 11<br />
43.694<br />
43.664<br />
0<br />
Sin actividad Agricultura Industria Construcción <strong>Servicio</strong>s<br />
8