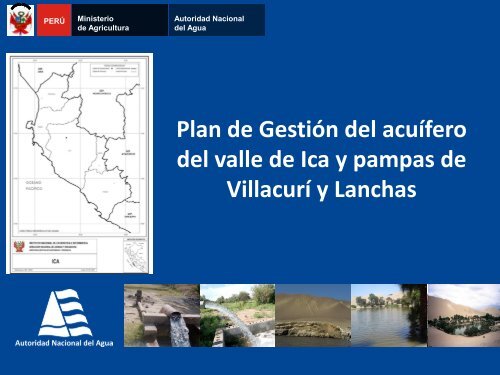
Plan de Gestión del acuífero del valle de Ica y pampas de Villacurí y ...
Plan de Gestión del acuífero del valle de Ica y pampas de Villacurí y ...
Plan de Gestión del acuífero del valle de Ica y pampas de Villacurí y ...

Create successful ePaper yourself
Turn your PDF publications into a flip-book with our unique Google optimized e-Paper software.
PERÚ<br />
Ministerio<br />
<strong>de</strong> Agricultura<br />
Autoridad Nacional<br />
<strong>de</strong>l Agua<br />
<strong>Plan</strong> <strong>de</strong> <strong>Gestión</strong> <strong>de</strong>l <strong>acuífero</strong><br />
<strong>de</strong>l <strong>valle</strong> <strong>de</strong> <strong>Ica</strong> y <strong>pampas</strong> <strong>de</strong><br />
<strong>Villacurí</strong> y Lanchas
1. CONTEXTO ECONÓMICO<br />
ACTUAL DE ICA<br />
<strong>Plan</strong> <strong>de</strong> <strong>Gestión</strong> <strong>de</strong>l <strong>acuífero</strong> <strong>de</strong>l <strong>valle</strong> <strong>de</strong> <strong>Ica</strong><br />
y <strong>pampas</strong> <strong>de</strong> <strong>Villacurí</strong> y Lanchas
Población histórica y estimada <strong>de</strong> <strong>Ica</strong> 2001-2018<br />
(en miles <strong>de</strong> personas)<br />
En miles <strong>de</strong><br />
personas<br />
850,0<br />
800,0<br />
750,0<br />
700,0<br />
650,0<br />
600,0<br />
Fuente: Perú. Instituto Nacional <strong>de</strong> Estadística e Informática – INEI. 2011<br />
<strong>Plan</strong> <strong>de</strong> <strong>Gestión</strong> <strong>de</strong>l <strong>acuífero</strong> <strong>de</strong>l <strong>valle</strong> <strong>de</strong> <strong>Ica</strong><br />
y <strong>pampas</strong> <strong>de</strong> <strong>Villacurí</strong> y Lanchas<br />
2001 2002 2003 2004 2005 2006 2007 2008 2009 2010 2011 2012 2013 2014 2015 2016 2017 2018<br />
Histórico Proyectado
Valor agregado bruto por <strong>de</strong>partamentos* <strong>de</strong>l Perú y<br />
participación <strong>de</strong> valor agregado bruto, 2010<br />
En miles <strong>de</strong> S/.<br />
12.000.000<br />
10.000.000<br />
8.000.000<br />
6.000.000<br />
4.000.000<br />
2.000.000<br />
0<br />
Tercio Superior<br />
El VAB <strong>de</strong> <strong>Ica</strong> fue <strong>de</strong> S/.<br />
5’958’189,000,<br />
representando el 3.14% <strong>de</strong>l<br />
VAB nacional<br />
<strong>Plan</strong> <strong>de</strong> <strong>Gestión</strong> <strong>de</strong>l <strong>acuífero</strong> <strong>de</strong>l <strong>valle</strong> <strong>de</strong> <strong>Ica</strong><br />
y <strong>pampas</strong> <strong>de</strong> <strong>Villacurí</strong> y Lanchas<br />
Participación en<br />
el VAB Nacional<br />
(%)<br />
7,00%<br />
Fuente: Perú. Instituto Nacional <strong>de</strong> Estadística e Informática – INEI, «Producto Bruto Interno Por Departamentos, 2001 - 2010», Lima,<br />
2011<br />
Notas: * No se consi<strong>de</strong>ra Lima, que logró un VAB <strong>de</strong> S/. 100’445’690,000(**) y que representa el 52.97% <strong>de</strong>l VAB nacional.<br />
** A precios constantes <strong>de</strong> 1994<br />
6,00%<br />
5,00%<br />
4,00%<br />
3,00%<br />
2,00%<br />
1,00%<br />
0,00%
Economía <strong>de</strong> <strong>Ica</strong> por sectores<br />
Valor Agregado Bruto <strong>de</strong> <strong>Ica</strong> (en<br />
miles <strong>de</strong> nuevos soles*), 2001-2010<br />
6.000.000<br />
5.000.000<br />
4.000.000<br />
3.000.000<br />
2.000.000<br />
1.000.000<br />
0<br />
En miles<br />
<strong>de</strong> S/.<br />
2001<br />
2002<br />
2003<br />
2004<br />
2005<br />
2006<br />
2007P/<br />
2008P/<br />
2009P/<br />
2010E/<br />
Fuente: Perú. Instituto Nacional <strong>de</strong> Estadística e Informática - INEI, «Producto<br />
Bruto Interno Por Departamentos, 2001 - 2010», Lima, 2011<br />
Notas: P/ Preliminar<br />
E/ Estimado<br />
** A precios constantes <strong>de</strong> 1994<br />
<strong>Plan</strong> <strong>de</strong> <strong>Gestión</strong> <strong>de</strong>l <strong>acuífero</strong> <strong>de</strong>l <strong>valle</strong> <strong>de</strong> <strong>Ica</strong><br />
y <strong>pampas</strong> <strong>de</strong> <strong>Villacurí</strong> y Lanchas<br />
Distribución porcentual <strong>de</strong>l Valor Agregado Bruto <strong>de</strong><br />
<strong>Ica</strong> según actividad económica, 2010<br />
Fuente: Perú. Instituto Nacional <strong>de</strong> Estadística e Informática - INEI, «Producto Bruto Interno Por Departamentos,<br />
2001 - 2010», Lima, 2011
Empleo en <strong>Ica</strong>, en términos <strong>de</strong> la PEA ocupada<br />
2001-2010<br />
En miles <strong>de</strong><br />
personas<br />
390<br />
370<br />
350<br />
330<br />
310<br />
290<br />
270<br />
250<br />
296,9<br />
290,4<br />
305,7<br />
311,8<br />
Fuente: Perú. Instituto Nacional <strong>de</strong> Estadística e Informática - INEI, «Perú: Evolución <strong>de</strong> los Indicadores <strong>de</strong> Empleo e Ingresos por<br />
Departamentos, 2001-2010», Lima, 2011<br />
331,9<br />
333,9 345,1<br />
En el 2010, la PEA Ocupada<br />
en <strong>Ica</strong> ascendió a 377,338<br />
personas<br />
358,8<br />
367,3<br />
2001 2002 2003 2004 2005 2006 2007 2008 2009 2010<br />
<strong>Plan</strong> <strong>de</strong> <strong>Gestión</strong> <strong>de</strong>l <strong>acuífero</strong> <strong>de</strong>l <strong>valle</strong> <strong>de</strong> <strong>Ica</strong><br />
y <strong>pampas</strong> <strong>de</strong> <strong>Villacurí</strong> y Lanchas<br />
377,4
Distribución <strong>de</strong> la PEA ocupada en <strong>Ica</strong> según actividad<br />
económica, 2010<br />
Enseñanza; 5,8%<br />
Inmobiliarias y<br />
alquileres; 3,6%<br />
Hoteles y<br />
Restaurantes; 6,9%<br />
Administración<br />
pública, Defensa,<br />
<strong>Plan</strong>es <strong>de</strong> Seg.social;<br />
3,4%<br />
Transportes y<br />
Comunicaciones;<br />
10,1%<br />
Otros servicios 1/;<br />
9,7%<br />
Comercio; 21,0%<br />
Agricultura; 17,3%<br />
Pesca; 0,7%<br />
Minería; 2,2%<br />
Manufactura; 12,9%<br />
Construcción; 6,5%<br />
Fuente: Perú. Instituto Nacional <strong>de</strong> Estadística e Informática - INEI, «Perú: Evolución <strong>de</strong> los Indicadores <strong>de</strong> Empleo e Ingresos por<br />
Departamentos, 2001-2010», Lima, 2011<br />
Nota: 1/ Otros Servicios lo componen las ramas <strong>de</strong> actividad <strong>de</strong> electricidad, gas y agua, intermediación financiera, activida<strong>de</strong>s<br />
<strong>de</strong> servicios sociales y <strong>de</strong> salud, otras activ. <strong>de</strong> serv. comunitarias, sociales y personales y hogares privados con servicio<br />
doméstico.<br />
<strong>Plan</strong> <strong>de</strong> <strong>Gestión</strong> <strong>de</strong>l <strong>acuífero</strong> <strong>de</strong>l <strong>valle</strong> <strong>de</strong> <strong>Ica</strong><br />
y <strong>pampas</strong> <strong>de</strong> <strong>Villacurí</strong> y Lanchas
Superficie (has)<br />
Superficie cosechada promedio <strong>de</strong> los cultivos <strong>de</strong><br />
esparrago, ají páprika y vid en el <strong>de</strong>partamento <strong>de</strong> <strong>Ica</strong><br />
Superficie (has)<br />
5,500<br />
5,000<br />
4,500<br />
4,000 3,700<br />
3,500<br />
3,000<br />
2,500<br />
2,000<br />
1,500<br />
1,000<br />
500<br />
12,000<br />
10,000<br />
0<br />
8,000<br />
6,000<br />
4,000<br />
2,000<br />
1980<br />
0<br />
1982<br />
411<br />
1984<br />
1991<br />
1986<br />
1993<br />
CHINCHA PISCO ICA PALPA NAZCA<br />
1988<br />
ESPARRAGO<br />
CHINCHA PISCO ICA PALPA NAZCA<br />
1990<br />
1995<br />
1992<br />
1997<br />
VID<br />
1994<br />
1996<br />
1999<br />
Años<br />
Años<br />
1998<br />
2001<br />
2000<br />
2002<br />
2003<br />
2004<br />
2005<br />
2006<br />
2008<br />
2007<br />
2011<br />
2010<br />
2009<br />
5,082<br />
10,400<br />
2011<br />
<strong>Plan</strong> <strong>de</strong> <strong>Gestión</strong> <strong>de</strong>l <strong>acuífero</strong> <strong>de</strong>l <strong>valle</strong> <strong>de</strong> <strong>Ica</strong><br />
y <strong>pampas</strong> <strong>de</strong> <strong>Villacurí</strong> y Lanchas<br />
• En los últimos 20 años, se<br />
evi<strong>de</strong>ncia crecimiento continuo <strong>de</strong><br />
superficies cosechadas.<br />
• El mayor incremento registra la<br />
provincia <strong>de</strong> <strong>Ica</strong><br />
Fuente: Perú. Dirección <strong>de</strong> Información Agraria - MINAG
Años<br />
Superficie cosechada promedio <strong>de</strong> los cultivos <strong>de</strong><br />
esparrago, ají páprika y vid en la provincia <strong>de</strong> <strong>Ica</strong>, 1991-<br />
2011<br />
2011<br />
2009<br />
2007<br />
2005<br />
2003<br />
2001<br />
1999<br />
1997<br />
1995<br />
1993<br />
1991<br />
411<br />
2,000<br />
3,343<br />
5,082<br />
10,400<br />
ESPARRAGO VID AJI PAPRIKA<br />
Superficie (has)<br />
0 1,000 2,000 3,000 4,000 5,000 6,000 7,000 8,000 9,000 10,000 11,000<br />
Fuente: Perú. Dirección <strong>de</strong> Información Agraria - MINAG<br />
<strong>Plan</strong> <strong>de</strong> <strong>Gestión</strong> <strong>de</strong>l <strong>acuífero</strong> <strong>de</strong>l <strong>valle</strong> <strong>de</strong> <strong>Ica</strong><br />
y <strong>pampas</strong> <strong>de</strong> <strong>Villacurí</strong> y Lanchas<br />
En 20 años se incrementó<br />
superficie cultivada <strong>de</strong><br />
espárragos.<br />
(<strong>de</strong> 411 a 10,400 ha.)<br />
Es el cultivo con mayor<br />
<strong>de</strong>manda hídrica.
<strong>Plan</strong> <strong>de</strong> <strong>Gestión</strong> <strong>de</strong>l <strong>acuífero</strong> <strong>de</strong>l <strong>valle</strong> <strong>de</strong> <strong>Ica</strong><br />
y <strong>pampas</strong> <strong>de</strong> <strong>Villacurí</strong> y Lanchas<br />
2. SITUACIÓN ACTUAL DE<br />
LOS ACUÍFEROS DE ICA,<br />
VILLACURÍ Y LANCHAS
Explotación <strong>de</strong> las aguas subterráneas<br />
<strong>Plan</strong> <strong>de</strong> <strong>Gestión</strong> <strong>de</strong>l <strong>acuífero</strong> <strong>de</strong>l <strong>valle</strong> <strong>de</strong> <strong>Ica</strong><br />
y <strong>pampas</strong> <strong>de</strong> <strong>Villacurí</strong> y Lanchas<br />
La explotación anual <strong>de</strong> aguas subterráneas en 49 <strong>acuífero</strong>s evaluados por la ANA, ascien<strong>de</strong> a 1,630.13 Hm3.<br />
El mayor volumen explotado se presenta en el uso agrícola con 1,152.73 Hm3.<br />
En el <strong>acuífero</strong> <strong>de</strong> <strong>Ica</strong> se tiene la mayor explotación 563.35 Hm3, que representa el 35% <strong>de</strong> la explotación <strong>de</strong><br />
aguas subterráneas a nivel nacional.<br />
563.35
Localización <strong>de</strong> <strong>acuífero</strong>s en veda<br />
Acuíferos: resoluciones<br />
<strong>de</strong> <strong>de</strong>claratorias <strong>de</strong> vedas<br />
<strong>Plan</strong> <strong>de</strong> <strong>Gestión</strong> <strong>de</strong>l <strong>acuífero</strong> <strong>de</strong>l <strong>valle</strong> <strong>de</strong> <strong>Ica</strong><br />
y <strong>pampas</strong> <strong>de</strong> <strong>Villacurí</strong> y Lanchas
Localización <strong>de</strong> los <strong>acuífero</strong>s <strong>de</strong> <strong>Ica</strong> , villa Curí y Lanchas<br />
LANCHAS<br />
VILLACURÍ<br />
ICA<br />
VEDAS RATIFICADAS MEDIANTE RJ Nº 330-2011-ANA<br />
<strong>Plan</strong> <strong>de</strong> <strong>Gestión</strong> <strong>de</strong>l <strong>acuífero</strong> <strong>de</strong>l <strong>valle</strong> <strong>de</strong> <strong>Ica</strong><br />
y <strong>pampas</strong> <strong>de</strong> <strong>Villacurí</strong> y Lanchas<br />
AMBITO DE LA ZONA<br />
DE VEDA
Volumen <strong>de</strong> agua (hm 3 )<br />
Balance hídrico promedio <strong>de</strong> la oferta – <strong>de</strong>manda <strong>de</strong><br />
aguas superficiales en la cuenca <strong>Ica</strong> en un año agrícola<br />
100.0<br />
90.0<br />
80.0<br />
70.0<br />
60.0<br />
50.0<br />
40.0<br />
30.0<br />
20.0<br />
10.0<br />
0.0<br />
Sep Oct Nov Dic Ene Feb Mar Abr May Jun Jul Ago<br />
Tiempo (Mes)<br />
Oferta hídrica<br />
Demanda hídrica<br />
Volumen <strong>de</strong> agua subterránea<br />
sobreexplotado<br />
<strong>Plan</strong> <strong>de</strong> <strong>Gestión</strong> <strong>de</strong>l <strong>acuífero</strong> <strong>de</strong>l <strong>valle</strong> <strong>de</strong> <strong>Ica</strong><br />
y <strong>pampas</strong> <strong>de</strong> <strong>Villacurí</strong> y Lanchas<br />
LA OFERTA HÍDRICA:<br />
Correspon<strong>de</strong> al agua superficial<br />
(75% probabilidad <strong>de</strong> ocurrencia) y<br />
la reserva explotable <strong>de</strong> agua<br />
subterránea (189 Hm3/año)<br />
Fuente: Perú. Autoridad Nacional <strong>de</strong>l Agua. DCPRH. 2009<br />
LA DEMANDA HÍDRICA:<br />
Es la <strong>de</strong>manda <strong>de</strong> agua para todos los usos, cuyo déficit es cubierto con la sobre explotación <strong>de</strong> aguas<br />
subterráneas y parte no es atendida.
Reservas explotables y volúmenes otorgados mediante licencia<br />
Acuífero<br />
<strong>Ica</strong> 189 335 -146 134.14 54.86<br />
<strong>Villacurí</strong> 63 228 -165 87.8 -24.8<br />
Lanchas 17 34 -17 3.5 13.5<br />
Fuente: Perú. Autoridad Nacional <strong>de</strong>l Agua. DCPRH.<br />
<strong>Plan</strong> <strong>de</strong> <strong>Gestión</strong> <strong>de</strong>l <strong>acuífero</strong> <strong>de</strong>l <strong>valle</strong> <strong>de</strong> <strong>Ica</strong><br />
y <strong>pampas</strong> <strong>de</strong> <strong>Villacurí</strong> y Lanchas<br />
El volumen asignable será <strong>de</strong>terminado durante la ejecución <strong>de</strong>l plan <strong>de</strong> gestión, en base<br />
al balance oferta – <strong>de</strong>manda.<br />
Pozos utilizados con y sin licencia <strong>de</strong> uso <strong>de</strong> agua subterránea<br />
ACUÍFERO<br />
Pozos<br />
Utilizados<br />
Pozos con<br />
licencia<br />
%<br />
Pozos sin<br />
Licencia<br />
ICA 864 249 29% 615 71%<br />
VILLACURÍ 460 139 30% 321 70%<br />
LANCHAS 436 63 14% 373 86%<br />
Fuente: Perú. Autoridad Nacional <strong>de</strong>l Agua. DCPRH.<br />
%
Estado <strong>de</strong> las aguas subterráneas <strong>de</strong>l <strong>acuífero</strong> <strong>de</strong> <strong>Ica</strong><br />
400<br />
350<br />
300<br />
250<br />
Volumen hm 3/ año<br />
200<br />
150<br />
100<br />
50<br />
0<br />
Incremento <strong>de</strong> explotación<br />
150<br />
EXPLOTACION DEL ACUIFERO DE ICA hm 3 /año<br />
360<br />
320<br />
250<br />
1950 1958 1960 1965 1967 2002 2007 2009<br />
285<br />
Fuente: Perú. Autoridad Nacional <strong>de</strong>l Agua. DCPRH.<br />
225<br />
385,5<br />
Descenso constante <strong>de</strong>l nivel<br />
<strong>de</strong> napa freática<br />
Por incremento <strong>de</strong> explotación (2002)<br />
aumentó velocidad <strong>de</strong> <strong>de</strong>scenso <strong>de</strong> napa<br />
freática hasta 1.4 m/año<br />
335<br />
A partir <strong>de</strong> 1960 explotación disminuyó por<br />
mayor disponibilidad <strong>de</strong> agua superficial <strong>de</strong>l<br />
Proyecto Choclococha (1959) llegando a 225<br />
Hm 3 /año en el 2002.<br />
A partir <strong>de</strong> 2002 explotación se incrementó<br />
significativamente por <strong>de</strong>manda <strong>de</strong> cultivos<br />
<strong>de</strong> agro exportación llegando a 335 hm 3 /año.<br />
Fuente: Perú. Autoridad Nacional <strong>de</strong>l Agua. DCPRH.<br />
<strong>Plan</strong> <strong>de</strong> <strong>Gestión</strong> <strong>de</strong>l <strong>acuífero</strong> <strong>de</strong>l <strong>valle</strong> <strong>de</strong> <strong>Ica</strong><br />
y <strong>pampas</strong> <strong>de</strong> <strong>Villacurí</strong> y Lanchas
Estado <strong>de</strong> las aguas subterráneas <strong>de</strong>l <strong>acuífero</strong> <strong>de</strong> <strong>Ica</strong><br />
El <strong>de</strong>scenso <strong>de</strong>l nivel <strong>de</strong> la napa freática y<br />
disminución <strong>de</strong> recarga con agua superficial, en<br />
algunas zonas <strong>de</strong> <strong>Ica</strong> incrementó salinidad <strong>de</strong><br />
agua subterránea.<br />
Ejm: Pozo IRHS 33 (San José <strong>de</strong> Los Molinos)<br />
salinidad se incrementó <strong>de</strong> 0.5 a 0.84<br />
milimhos/cm en 13 años<br />
Reserva<br />
Explotable Explotación<br />
Sobre<br />
explotación<br />
190 335 76 %<br />
Fuente: Perú. Autoridad Nacional <strong>de</strong>l Agua. DCPRH.<br />
Incremento <strong>de</strong> salinidad<br />
Fuente: Perú. Autoridad Nacional <strong>de</strong>l Agua. DCPRH.<br />
2009: Explotación (335 hm 3 /año) superó<br />
significativamente volumen <strong>de</strong> reserva<br />
explotable (190 hm 3 /año), llegando sobre<br />
explotación a 145 hm 3 /año (76%)<br />
<strong>Plan</strong> <strong>de</strong> <strong>Gestión</strong> <strong>de</strong>l <strong>acuífero</strong> <strong>de</strong>l <strong>valle</strong> <strong>de</strong> <strong>Ica</strong><br />
y <strong>pampas</strong> <strong>de</strong> <strong>Villacurí</strong> y Lanchas
Estado <strong>de</strong> las aguas subterráneas <strong>de</strong>l <strong>acuífero</strong> Villacuri<br />
Incremento <strong>de</strong> explotación<br />
Fuente: Perú. Autoridad Nacional <strong>de</strong>l Agua. DCPRH.<br />
Por incremento <strong>de</strong> explotación, nivel <strong>de</strong><br />
la napa freática está en <strong>de</strong>scenso, a una<br />
velocidad <strong>de</strong> 1.5 m/año<br />
En <strong>Villacurí</strong> se usa exclusivamente aguas<br />
subterráneas, incrementándose explotación <strong>de</strong><br />
60 hm 3 /año (1968) a 228 hm 3 /año (2009).<br />
A partir <strong>de</strong> 2002 incrementos <strong>de</strong> explotación<br />
son más significativos.<br />
Descenso constante <strong>de</strong>l nivel <strong>de</strong> napa freática<br />
Fuente: Perú. Autoridad Nacional <strong>de</strong>l Agua. DCPRH.<br />
<strong>Plan</strong> <strong>de</strong> <strong>Gestión</strong> <strong>de</strong>l <strong>acuífero</strong> <strong>de</strong>l <strong>valle</strong> <strong>de</strong> <strong>Ica</strong><br />
y <strong>pampas</strong> <strong>de</strong> <strong>Villacurí</strong> y Lanchas
Estado <strong>de</strong> las aguas subterráneas <strong>de</strong>l <strong>acuífero</strong> Villacuri<br />
Por <strong>de</strong>scenso <strong>de</strong>l nivel <strong>de</strong> napa freática y<br />
ausencia <strong>de</strong> recarga con agua superficial, se<br />
incrementó la salinidad, <strong>de</strong>teriorando la<br />
calidad <strong>de</strong>l agua.<br />
Ejm: El pozo IRHS-131 (Salas <strong>Villacurí</strong>) la<br />
salinidad se incrementó <strong>de</strong> 1 a 3.8<br />
milimhos/cm.<br />
Reserva<br />
Explotable Explotación<br />
Sobre<br />
explotación<br />
63 228 262%<br />
Fuente: Perú. Autoridad Nacional <strong>de</strong>l Agua. DCPRH.<br />
C.E. (mS/cm)<br />
4<br />
3.5<br />
3<br />
2.5<br />
2<br />
1.5<br />
1<br />
0.5<br />
0<br />
dic-97<br />
Incremento <strong>de</strong> salinidad <strong>de</strong>l agua<br />
dic-98<br />
dic-99<br />
dic-00<br />
IRHS - 131<br />
DISTRITO: SALAS - VILLACURI<br />
SECTOR: FUNDO FORTUNA<br />
dic-01<br />
dic-02<br />
dic-03<br />
Tiempo (años)<br />
Fuente: Perú. Autoridad Nacional <strong>de</strong>l Agua. DCPRH.<br />
<strong>Plan</strong> <strong>de</strong> <strong>Gestión</strong> <strong>de</strong>l <strong>acuífero</strong> <strong>de</strong>l <strong>valle</strong> <strong>de</strong> <strong>Ica</strong><br />
y <strong>pampas</strong> <strong>de</strong> <strong>Villacurí</strong> y Lanchas<br />
dic-04<br />
Data 2009.<br />
La explotación <strong>de</strong>l <strong>acuífero</strong> (228 hm 3 /año) superó el<br />
volumen <strong>de</strong> reserva explotable (63 hm 3 /año) llegando<br />
la sobre explotación a 165 hm 3 /año (262%)<br />
dic-05<br />
dic-06<br />
dic-07<br />
dic-08<br />
dic-09<br />
dic-10
Estado <strong>de</strong> las aguas subterráneas <strong>de</strong>l <strong>acuífero</strong> Lanchas<br />
Incremento <strong>de</strong> explotación<br />
Fuente: Perú. Autoridad Nacional <strong>de</strong>l Agua. DCPRH.<br />
Descenso constante <strong>de</strong>l nivel <strong>de</strong> la<br />
napa freática<br />
Periodo 2000-2004: cuando explotación era 17<br />
hm 3 /año el <strong>acuífero</strong> estaba en equilibrio.<br />
A partir <strong>de</strong> 2005: Incrementa explotación a 34<br />
hm 3 /año y el nivel <strong>de</strong> napa freática <strong>de</strong>scien<strong>de</strong> a<br />
razón <strong>de</strong> 1.85 m/año. Explotación supera recarga<br />
<strong>de</strong>l <strong>acuífero</strong>.<br />
La explotación <strong>de</strong> aguas subterráneas se incrementó<br />
<strong>de</strong> 17 hm 3 /año (2003) a 34 hm 3 /año (2010) por la<br />
creciente <strong>de</strong>manda <strong>de</strong> agua<br />
Fuente: Perú. Autoridad Nacional <strong>de</strong>l Agua. DCPRH.<br />
<strong>Plan</strong> <strong>de</strong> <strong>Gestión</strong> <strong>de</strong>l <strong>acuífero</strong> <strong>de</strong>l <strong>valle</strong> <strong>de</strong> <strong>Ica</strong><br />
y <strong>pampas</strong> <strong>de</strong> <strong>Villacurí</strong> y Lanchas
Estado <strong>de</strong> las aguas subterráneas <strong>de</strong>l <strong>acuífero</strong> Lanchas<br />
Incremento <strong>de</strong> salinidad <strong>de</strong>l agua<br />
La sobre explotación, <strong>de</strong>scenso <strong>de</strong> napa y<br />
ausencia <strong>de</strong> recarga con agua superficial,<br />
<strong>de</strong>terioró calidad <strong>de</strong>l agua por incrementó<br />
<strong>de</strong> salinidad.<br />
Ejm. El Pozo IRHS 266 (Paracas)<br />
salinidad creció <strong>de</strong> 1.4 (2000) a 3.1<br />
milimhos/cm (2010)<br />
Reserva<br />
Explotable Explotación<br />
Sobre<br />
explotación<br />
17 34 100%<br />
Fuente: Perú. Autoridad Nacional <strong>de</strong>l Agua. DCPRH.<br />
Fuente: Perú. Autoridad Nacional <strong>de</strong>l Agua. DCPRH.<br />
En 2000: La explotación fue <strong>de</strong> 17 hm 3 /año.<br />
En 2010: Se incrementó a 34 hm 3 /año, registrando<br />
sobre explotación <strong>de</strong> 17 hm 3 /año (100%)<br />
<strong>Plan</strong> <strong>de</strong> <strong>Gestión</strong> <strong>de</strong>l <strong>acuífero</strong> <strong>de</strong>l <strong>valle</strong> <strong>de</strong> <strong>Ica</strong><br />
y <strong>pampas</strong> <strong>de</strong> <strong>Villacurí</strong> y Lanchas
Efectos <strong>de</strong>l <strong>de</strong>scenso <strong>de</strong>l nivel <strong>de</strong> la napa freática en un<br />
pozo en producción<br />
POZO EN ESTADO INICIAL<br />
Con la totalidad <strong>de</strong> filtros<br />
funcionando<br />
Δh<br />
Fuente: Perú. Autoridad Nacional <strong>de</strong>l Agua. DCPRH.<br />
Q<br />
POZO DESPUÉS DEL DESC. N.E.<br />
Menos filtros activos por <strong>de</strong>sc.<br />
N.E.,mayor pérdidas <strong>de</strong> carga<br />
y arenamiento en el fondo<br />
NE<br />
ND<br />
Δh<br />
Δh = ND - NE<br />
Δh =Abatimiento<br />
N E = Nivel estático<br />
ND = Nivel dinámico<br />
<strong>Plan</strong> <strong>de</strong> <strong>Gestión</strong> <strong>de</strong>l <strong>acuífero</strong> <strong>de</strong>l <strong>valle</strong> <strong>de</strong> <strong>Ica</strong><br />
y <strong>pampas</strong> <strong>de</strong> <strong>Villacurí</strong> y Lanchas<br />
q menor caudal<br />
NE<br />
ND<br />
Arenamiento que obstruye<br />
Parte <strong>de</strong> los filtros
Efectos <strong>de</strong>l <strong>de</strong>scenso <strong>de</strong>l nivel <strong>de</strong> la napa freática<br />
10 m.<br />
N.T.<br />
N.E. 1<br />
N.E. 2<br />
POZO 1 POZO 2 POZO 3 POZO 4 POZO 5<br />
<strong>Plan</strong> <strong>de</strong> <strong>Gestión</strong> <strong>de</strong>l <strong>acuífero</strong> <strong>de</strong>l <strong>valle</strong> <strong>de</strong> <strong>Ica</strong><br />
y <strong>pampas</strong> <strong>de</strong> <strong>Villacurí</strong> y Lanchas<br />
POZO 6<br />
Fuente: Perú. Autoridad Nacional <strong>de</strong>l Agua. DCPRH.<br />
Si el nivel <strong>de</strong> napa freática sigue <strong>de</strong>scendiendo a la velocidad actual, en<br />
un futuro próximo, la producción <strong>de</strong> los pozos <strong>de</strong>scen<strong>de</strong>rá<br />
significativamente, secándose los más antiguos y poco profundos.<br />
LEYENDA<br />
NIVEL DEL T<br />
(N.T.)<br />
NIVEL ESTÁT<br />
(N.E.)<br />
ZONA VADO<br />
ACUIFERO<br />
SATURADO<br />
ESTRATO<br />
IMPERMEAB<br />
BASAMENTO<br />
ROCOSO
Tiempo <strong>de</strong> <strong>de</strong>scenso máximos y mínimos <strong>de</strong>l nivel <strong>de</strong> la<br />
napa freática hasta 10 m, <strong>Ica</strong> y Villacuri<br />
TIEMPO QUE DURARÍA EL DESCENSO DE 10M DEL NIVEL DE LA NAPA EN 10 M CONSIDERADO CRÍTICO- VALLE ICA Y VILLACURÍ<br />
1.- Valle <strong>de</strong> <strong>Ica</strong><br />
DISTRITO<br />
Velocidad Descenso (m/año)<br />
Mínima Máxima<br />
Explotación<br />
Mm3/año<br />
Espesor Saturado Total<br />
H Min. H.Máx<br />
Descenso<br />
total (m)<br />
Tiempo en años para <strong>de</strong>scenso <strong>de</strong> 10m<br />
Para Veloc.Mínima Para Veloc. Máxima<br />
Pueblo Nuevo 1.22 1.84 42.04 10.78 46.78 10 8 5<br />
Tate 0.86 1.07 2.88 18.51 71.51 10 12 9<br />
Pachacutec 0.68 1.3 12.61 27.93 102.93 10 15 8<br />
Parcona 0.68 1.3 6.40 47.43 90.43 10 15 8<br />
Los Aquijes 0.48 1.41 38.83 39.14 90.14 10 21 7<br />
Tinguiña 0.55 1.04 19.90 33.82 97.82 10 18 10<br />
Santiago 0.2 1.75 131.42 12.22 47.22 10 50 6<br />
Subtanjalla 0.46 0.6 17.38 19.29 19.29 10 22 17<br />
<strong>Ica</strong> 0.22 0.75 29.43 13.13 30.13 10 45 13<br />
San Juan Bautista 0.2 0.78 11.23 13.13 30.13 10 50 13<br />
San José Molinos 0.24 0.48 9.83 47.48 74.48 10 42 21<br />
Salas Guadalupe 0.2 0.78 9.88 31.83 59.83 10 50 13<br />
Rosario <strong>de</strong> Yauca 0.2 0.34 0.80 27.53 60.53 10 50 29<br />
Ocucaje 1 <strong>de</strong>scenso. 0.2 0.31 2.36<br />
335.01<br />
38.81 97.81 10 50 32<br />
2. Pampas <strong>de</strong> <strong>Villacurí</strong><br />
Salas <strong>Villacurí</strong> 1 0.51 1.76 32.00<br />
228.34<br />
Salas <strong>Villacurí</strong> 2 0.11 0.47 18.00<br />
85.00<br />
38.00<br />
10 19.61 6<br />
10 90.91 21<br />
Consi<strong>de</strong>rando velocidad actual <strong>de</strong> <strong>de</strong>scenso <strong>de</strong>l nivel <strong>de</strong> napa y calculando el tiempo en años que <strong>de</strong>moraría en<br />
<strong>de</strong>scen<strong>de</strong>r 10m <strong>de</strong> profundidad, se estima que causará una disminución significativa <strong>de</strong>l caudal <strong>de</strong> los pozos y un<br />
incremento <strong>de</strong>l costo <strong>de</strong> bombeo, consecuentemente incremento <strong>de</strong>l costo <strong>de</strong> producción.<br />
Los mas críticos: Pueblo Nuevo, Tate, Pachacutec, Parcona, Los Aquijes ,Santiago, y <strong>Villacurí</strong> 1<br />
Fuente: Perú. Autoridad Nacional <strong>de</strong>l Agua. DCPRH.<br />
<strong>Plan</strong> <strong>de</strong> <strong>Gestión</strong> <strong>de</strong>l <strong>acuífero</strong> <strong>de</strong>l <strong>valle</strong> <strong>de</strong> <strong>Ica</strong><br />
y <strong>pampas</strong> <strong>de</strong> <strong>Villacurí</strong> y Lanchas
Vida útil <strong>de</strong> los pozos por <strong>de</strong>scenso <strong>de</strong> 10 metros <strong>de</strong>l<br />
nivel <strong>de</strong> la napa freática en el <strong>valle</strong> <strong>de</strong> <strong>Ica</strong><br />
DISTRITO<br />
Pozos<br />
Utilizados<br />
Explotación<br />
(hm3/año)<br />
Areas bajo<br />
Riego (has)<br />
Consi<strong>de</strong>rando velocidad máxima <strong>de</strong> <strong>de</strong>scenso <strong>de</strong>l nivel <strong>de</strong> napa y calculando el tiempo<br />
en años que <strong>de</strong>moraría en <strong>de</strong>scen<strong>de</strong>r 10m <strong>de</strong> profundidad, se estima que causará<br />
disminución significativa <strong>de</strong>l caudal <strong>de</strong> los pozos, incremento <strong>de</strong>l costo <strong>de</strong> bombeo y<br />
pérdidas <strong>de</strong> áreas bajo riego.<br />
Desc. Napa<br />
freática<br />
(m/año)<br />
Vida Útil <strong>de</strong><br />
los Pozos<br />
(años)<br />
PUEBLO NUEVO 79 42.04 2100 1.84 5<br />
TATE 8 2.88 140 1.07 9<br />
PACHACUTEC 27 12.61 630 1.3 8<br />
PARCONA 19 6.4 320 1.3 8<br />
LOS AQUIJES 68 38.83 1940 1.41 7<br />
LA TINGUIÑA 62 19.9 1000 1.04 10<br />
SANTIAGO 260 131.42 6570 1.75 6<br />
SUBTANJALLA 45 17.38 870 0.6 17<br />
ICA 101 29.43 1470 0.75 13<br />
SAN JUAN BAUTISTA 41 11.23 560 0.78 13<br />
SAN JOSÉ DE LOS MOLINOS 30 9.83 490 0.48 21<br />
SALAS GUADALUPE 23 9.88 495 0.78 13<br />
ROSARIO DE YAUCA 13 0.8 40 0.34 29<br />
OCUCAJE 88 2.36 115 0.31 32<br />
Fuente: Perú. Autoridad Nacional <strong>de</strong>l Agua. DCPRH.<br />
<strong>Plan</strong> <strong>de</strong> <strong>Gestión</strong> <strong>de</strong>l <strong>acuífero</strong> <strong>de</strong>l <strong>valle</strong> <strong>de</strong> <strong>Ica</strong><br />
y <strong>pampas</strong> <strong>de</strong> <strong>Villacurí</strong> y Lanchas
Vida útil <strong>de</strong> los pozos por <strong>de</strong>scenso <strong>de</strong> 10 metros <strong>de</strong>l<br />
nivel <strong>de</strong> la napa freática en <strong>pampas</strong> <strong>de</strong> <strong>Villacurí</strong> y Lanchas<br />
DISTRITO<br />
Acuífero <strong>de</strong> Pampas <strong>de</strong> <strong>Villacurí</strong><br />
Pozos<br />
Utilizados<br />
Explotación<br />
(hm3/año)<br />
Areas bajo<br />
Riego (has)<br />
Desc. Napa<br />
freática<br />
(m/año)<br />
Vida Útil <strong>de</strong><br />
los Pozos<br />
(años)<br />
SALAS VILLACURÍ 464 228 12800 1.76 6<br />
Fuente: Perú. Autoridad Nacional <strong>de</strong>l Agua. DCPRH.<br />
DISTRITO<br />
Acuífero <strong>de</strong> Pampa <strong>de</strong> Lanchas<br />
Pozos<br />
Utilizados<br />
Explotación<br />
(hm3/año)<br />
Areas bajo<br />
Riego (has)<br />
Desc. Napa<br />
freática<br />
(m/año)<br />
Vida Útil <strong>de</strong><br />
los Pozos<br />
(años)<br />
Paracas 435 34 3800 0.9 11<br />
Fuente: Perú. Autoridad Nacional <strong>de</strong>l Agua. DCPRH.<br />
Consi<strong>de</strong>rando velocidad máxima <strong>de</strong> <strong>de</strong>scenso <strong>de</strong>l nivel <strong>de</strong> napa freática y calculando el<br />
tiempo en años que <strong>de</strong>moraría en <strong>de</strong>scen<strong>de</strong>r 10m <strong>de</strong> profundidad, se estima que<br />
causará disminución significativa <strong>de</strong>l caudal <strong>de</strong> los pozos, incremento <strong>de</strong>l costo <strong>de</strong><br />
bombeo y pérdidas <strong>de</strong> áreas bajo riego.<br />
<strong>Plan</strong> <strong>de</strong> <strong>Gestión</strong> <strong>de</strong>l <strong>acuífero</strong> <strong>de</strong>l <strong>valle</strong> <strong>de</strong> <strong>Ica</strong><br />
y <strong>pampas</strong> <strong>de</strong> <strong>Villacurí</strong> y Lanchas
3. PROSPECTIVA<br />
<strong>Plan</strong> <strong>de</strong> <strong>Gestión</strong> <strong>de</strong>l <strong>acuífero</strong> <strong>de</strong>l <strong>valle</strong> <strong>de</strong> <strong>Ica</strong><br />
y <strong>pampas</strong> <strong>de</strong> <strong>Villacurí</strong> y Lanchas
Si no se toman medidas urgentes: pérdida <strong>de</strong> hectáreas<br />
cultivables<br />
DISTRITO<br />
Pozos<br />
Utilizados<br />
Explotación Áreas bajo<br />
(hm3/año) Riego (has)<br />
Desc. Napa<br />
Vida Util <strong>de</strong><br />
freática<br />
los Pozos<br />
(m/año)<br />
Pérdidas <strong>de</strong> Áreas <strong>de</strong><br />
Cultivo en %<br />
Parcial Acumulado<br />
PUEBLO NUEVO 79 42.04 2100 1.84 5 12.54 12.54<br />
SANTIAGO 260 131.42 6570 1.75 6 39.25 51.79<br />
LOS AQUIJES 68 38.83 1940 1.41 7 11.59 63.38<br />
PACHACUTEC 27 12.61 630 1.3 8 3.76 67.14<br />
PARCONA 19 6.4 320 1.3 8 1.91 69.06<br />
TATE 8 2.88 140 1.07 9 0.84 69.89<br />
LA TINGUIÑA 62 19.9 1000 1.04 10 5.97 75.87<br />
ICA 101 29.43 1470 0.75 13 8.78 84.65<br />
SAN JUAN BAUTISTA 41 11.23 560 0.78 13 3.35 87.99<br />
SALAS GUADALUPE 23 9.88 495 0.78 13 2.96 90.95<br />
SUBTANJALLA 45 17.38 870 0.6 17 5.20 96.15<br />
SAN JOSÉ DE LOS<br />
MOLINOS<br />
30 9.83 490 0.48 21 2.93 99.07<br />
ROSARIO DE YAUCA 13 0.8 40 0.34 29 0.24 99.31<br />
OCUCAJE 88 2.36 115<br />
16,740<br />
0.31 32 0.69 100.00<br />
Fuente: Perú. Autoridad Nacional <strong>de</strong>l Agua. DCPRH.<br />
<strong>Plan</strong> <strong>de</strong> <strong>Gestión</strong> <strong>de</strong>l <strong>acuífero</strong> <strong>de</strong>l <strong>valle</strong> <strong>de</strong> <strong>Ica</strong><br />
y <strong>pampas</strong> <strong>de</strong> <strong>Villacurí</strong> y Lanchas<br />
En 10 años el 75.87 % <strong>de</strong> áreas <strong>de</strong> cultivo en <strong>Ica</strong> será afectada por<br />
extrema escasez <strong>de</strong> agua<br />
En <strong>Villacurí</strong> se afectaría el 100% <strong>de</strong> áreas <strong>de</strong> cultivo (12 800 has) y en<br />
Lanchas casi la totalidad <strong>de</strong>l área (3 800 has)
Si no se toman medidas urgentes: reducción <strong>de</strong>l valor<br />
agregado bruto <strong>de</strong> <strong>Ica</strong><br />
En miles <strong>de</strong> S/.<br />
Valores históricos y estimados* <strong>de</strong>l Valor Agregado Bruto <strong>de</strong> <strong>Ica</strong> (en miles <strong>de</strong><br />
nuevos soles**),<br />
2001-2021<br />
Histórico Proyectado<br />
Fuente: Instituto Nacional <strong>de</strong> Estadística, «Producto Bruto Interno Por Departamentos, 2001 - 2010», Lima, 2011<br />
Notas: * Del 2011-2015, los resultados han sido estimados en base a regresión polinómica.<br />
** A precios constantes <strong>de</strong> 1994.<br />
<strong>Plan</strong> <strong>de</strong> <strong>Gestión</strong> <strong>de</strong>l <strong>acuífero</strong> <strong>de</strong>l <strong>valle</strong> <strong>de</strong> <strong>Ica</strong><br />
y <strong>pampas</strong> <strong>de</strong> <strong>Villacurí</strong> y Lanchas<br />
El 75.87% y 100% <strong>de</strong> áreas <strong>de</strong><br />
cultivo en <strong>Ica</strong> , <strong>Villacurí</strong> y<br />
Lanchas serán afectadas por<br />
extrema escasez <strong>de</strong> agua<br />
Agricultura será la más<br />
afectada. Seguirían<br />
Manufactura, Comercio,<br />
Servicios y Turismo
Si no se toman medidas urgentes: contracción <strong>de</strong> la PEA<br />
ocupada<br />
En miles <strong>de</strong><br />
personas<br />
500<br />
450<br />
400<br />
350<br />
300<br />
250<br />
Valores históricos y estimados* <strong>de</strong> la PEA Ocupada <strong>de</strong> <strong>Ica</strong> (en miles <strong>de</strong><br />
personas),<br />
2001-2021<br />
2001 2002 2003 2004 2005 2006 2007 2008 2009 2010 2011 2012 2013 2014 2015 2016 2017 2018 2019 2020 2021<br />
Fuente: Instituto Nacional <strong>de</strong> Estadística, «Perú: Evolución <strong>de</strong> los Indicadores <strong>de</strong> Empleo e Ingresos por Departamentos, 2001-<br />
2010», Lima, 2011<br />
Notas: * Del 2011-2015, los resultados han sido estimados en base a regresión polinómica.<br />
<strong>Plan</strong> <strong>de</strong> <strong>Gestión</strong> <strong>de</strong>l <strong>acuífero</strong> <strong>de</strong>l <strong>valle</strong> <strong>de</strong> <strong>Ica</strong><br />
y <strong>pampas</strong> <strong>de</strong> <strong>Villacurí</strong> y Lanchas<br />
Se prevé una PEA<br />
ocupada <strong>de</strong> 331,800<br />
personas en <strong>Ica</strong>.<br />
La PEA ocupada en<br />
2021, regresa a los<br />
valores <strong>de</strong>l 2005.
Impacto en <strong>Ica</strong> si se toman las medidas preventivas<br />
La implementación <strong>de</strong>l “<strong>Plan</strong> <strong>de</strong> <strong>Gestión</strong> <strong>de</strong> los Acuíferos <strong>de</strong>l Valle <strong>de</strong> <strong>Ica</strong> y<br />
Pampas <strong>de</strong> <strong>Villacurí</strong> y Lanchas”, logrará tener un real conocimiento <strong>de</strong>l<br />
balance hídrico <strong>de</strong> la zona, permitiendo una explotación sostenible y<br />
eficiente <strong>de</strong>l agua subterránea, manteniendo la productividad <strong>de</strong> las<br />
activida<strong>de</strong>s económicas y el nivel <strong>de</strong> ingreso <strong>de</strong> la población.<br />
La progresiva recuperación <strong>de</strong>l nivel <strong>de</strong> la napa, incrementará la producción<br />
<strong>de</strong> los pozos, disminuirá costo <strong>de</strong> bombeo al extraerse el agua <strong>de</strong><br />
menores profundida<strong>de</strong>s y mejorará la calidad <strong>de</strong>l agua por la recarga <strong>de</strong>l<br />
<strong>acuífero</strong> con agua superficial.<br />
<strong>Plan</strong> <strong>de</strong> <strong>Gestión</strong> <strong>de</strong>l <strong>acuífero</strong> <strong>de</strong>l <strong>valle</strong> <strong>de</strong> <strong>Ica</strong><br />
y <strong>pampas</strong> <strong>de</strong> <strong>Villacurí</strong> y Lanchas
<strong>Plan</strong> <strong>de</strong> gestión <strong>de</strong> los <strong>acuífero</strong>s <strong>de</strong>l <strong>valle</strong>n <strong>de</strong> <strong>Ica</strong> y<br />
<strong>pampas</strong> <strong>de</strong> Villacuri y Lanchas<br />
Finalidad:<br />
Mantener la productividad <strong>de</strong> activida<strong>de</strong>s económicas en el ámbito <strong>de</strong> los<br />
<strong>acuífero</strong>s <strong>de</strong> <strong>Ica</strong>, <strong>Villacurí</strong> y Lanchas, con la explotación sostenible y eficiente<br />
<strong>de</strong>l agua subterránea.<br />
Objetivo General:<br />
Explotación sostenible <strong>de</strong>l <strong>acuífero</strong> manteniendo su nivel <strong>de</strong> equilibrio.<br />
Objetivos específicos, a lograr mediante los programas siguientes:<br />
1. Información, difusión, sensibilización y capacitación<br />
2. Evaluación <strong>de</strong>l <strong>acuífero</strong> para <strong>de</strong>terminar la oferta <strong>de</strong> agua<br />
3. Control y vigilancia <strong>de</strong>l <strong>acuífero</strong><br />
4. Disminución <strong>de</strong> <strong>de</strong>manda <strong>de</strong> agua subterránea con uso eficiente en riego y cambio<br />
<strong>de</strong> cédulas <strong>de</strong> cultivo con menor consumo <strong>de</strong> agua y mayor rentabilidad<br />
5. Incremento <strong>de</strong> la recarga <strong>de</strong>l <strong>acuífero</strong> con agua superficial y uso conjunto<br />
agua superficial-subterránea<br />
6. Mo<strong>de</strong>rnización <strong>de</strong> la gestión integrada <strong>de</strong> los recursos hídricos.<br />
<strong>Plan</strong> <strong>de</strong> <strong>Gestión</strong> <strong>de</strong>l <strong>acuífero</strong> <strong>de</strong>l <strong>valle</strong> <strong>de</strong> <strong>Ica</strong><br />
y <strong>pampas</strong> <strong>de</strong> <strong>Villacurí</strong> y Lanchas
Financiamiento<br />
Monto<br />
presupuestado<br />
(S/.)<br />
Monto<br />
asignado (S/.)<br />
Monto<br />
pendiente<br />
(S/.)<br />
Acciones a realizar<br />
Valle <strong>de</strong> <strong>Ica</strong> 1,626,230 600,000 1,026,230 Programas 1-2-3-4<br />
Pampas <strong>de</strong> <strong>Villacurí</strong> 912,355 0 912,355 Programas 1-2-3-4<br />
Pampa <strong>de</strong> Lanchas 887,445 0 887,445 Programas 1-2-3-4<br />
El financiamiento está <strong>de</strong>stinado para ejecutar los siguientes programas en el plazo<br />
<strong>de</strong> 01 año:<br />
1) Información, difusión, sensibilización y capacitación<br />
2) Evaluación <strong>de</strong>l <strong>acuífero</strong><br />
3) Disminución <strong>de</strong> la <strong>de</strong>manda <strong>de</strong> agua<br />
4) Control y vigilancia <strong>de</strong>l <strong>acuífero</strong><br />
<strong>Plan</strong> <strong>de</strong> <strong>Gestión</strong> <strong>de</strong>l <strong>acuífero</strong> <strong>de</strong>l <strong>valle</strong> <strong>de</strong> <strong>Ica</strong><br />
y <strong>pampas</strong> <strong>de</strong> <strong>Villacurí</strong> y Lanchas<br />
Este financiamiento no compren<strong>de</strong> la ejecución <strong>de</strong> los programas 5 (Incremento <strong>de</strong><br />
la recarga <strong>de</strong>l <strong>acuífero</strong> con agua superficial y uso conjunto aguas superficial-<br />
subterránea) ni 6 (Mo<strong>de</strong>rnización <strong>de</strong> la gestión <strong>de</strong> los recursos hídricos)
Financiamiento<br />
Costo <strong>de</strong> los programas <strong>de</strong>l <strong>Plan</strong> <strong>de</strong> <strong>Gestión</strong> <strong>de</strong> los Acuíferos <strong>Ica</strong>, <strong>Villacurí</strong> y Lanchas<br />
PROGRAMAS ICA VILLACURÍ LANCHAS<br />
1.Información,sensibilización,difusión.<br />
Capacitación<br />
200,000.00<br />
2. Evaluación <strong>de</strong>l <strong>acuífero</strong> 548,110.00<br />
3.Disminución <strong>de</strong> explotación<br />
(Componente "a" : Disminución <strong>de</strong> la<br />
<strong>de</strong>manda <strong>de</strong> agua<br />
515,110.00<br />
4. Control y Vigilancia <strong>de</strong>l Acuífero 363,010.00<br />
TOTAL 1,626,230.00<br />
100,000.00<br />
333,310.00<br />
315,750.00<br />
163,295.00<br />
912,355.00<br />
100,000.00<br />
293,310.00<br />
292,240.00<br />
201,895.00<br />
887,445.00<br />
PROGRAMAS ICA VILLACURÍ LANCHAS<br />
1.Información,sensibilización,difusión.<br />
Capacitación<br />
110,980.00<br />
2. Evaluación <strong>de</strong>l <strong>acuífero</strong> 341,920.00<br />
3.Disminución <strong>de</strong> explotación<br />
(Componente "a" : Disminución <strong>de</strong> la<br />
<strong>de</strong>manda <strong>de</strong> agua<br />
Presupuesto Disponible en el Año 2012<br />
4. Control y Vigilancia <strong>de</strong>l Acuífero 147,400.00<br />
TOTAL 600,300.00<br />
-<br />
-<br />
-<br />
-<br />
-<br />
-<br />
<strong>Plan</strong> <strong>de</strong> <strong>Gestión</strong> <strong>de</strong>l <strong>acuífero</strong> <strong>de</strong>l <strong>valle</strong> <strong>de</strong> <strong>Ica</strong><br />
y <strong>pampas</strong> <strong>de</strong> <strong>Villacurí</strong> y Lanchas<br />
-<br />
-<br />
-<br />
-<br />
-<br />
TOTAL Nuevos<br />
Soles<br />
400,000.00<br />
1,174,730.00<br />
1,123,100.00<br />
728,200.00<br />
3,426,030.00<br />
TOTAL Nuevos<br />
Soles<br />
110,980.00<br />
341,920.00<br />
-<br />
147,400.00<br />
600,300.00
Financiamiento<br />
Costo <strong>de</strong> una brigada <strong>de</strong> campo por 6 meses<br />
DESCRIPCIÓN UNIDAD CANTIDAD<br />
COSTO<br />
UNITARIO<br />
S/.<br />
MESES<br />
COSTO<br />
PARCIAL<br />
S/.<br />
BIENES<br />
Combustible galones 110 14.0 6 9,240.0<br />
Camara fotografica u 1 700.0 700.0<br />
Laptop u 1 5000.0 5,000.0<br />
Sondas eléctricas u 1 1500.0 1,500.0<br />
Sondas <strong>de</strong> profundidad o golpe u 1 850.0 850.0<br />
GPS u 1 1200.0 1,200.0<br />
Analizador combinado u 1 1200.0 1,200.0<br />
Medidor Caudal tipo orificio circular φ 4" u 1 1000.0 1,000.0<br />
Medidor Caudal tipo orificio circular φ 6" u 1 1500.0 1,500.0<br />
Medidor Caudal tipo orificio circular φ 8" u 1 2000.0 2,000.0<br />
Flujómetro u 1 18000.0 18,000.0<br />
SERVICIOS<br />
SUB TOTAL<br />
42,190.0<br />
Alquiler <strong>de</strong> camionetas(22 días/mes) U 1 200.0 6 26400.0<br />
SUB TOTAL<br />
PERSONAL<br />
26,400.0<br />
Ingeniero jefe brigada Ing 1 5000 6 30,000.0<br />
Ingeniero Sig Ing 1 4000 6 24,000.0<br />
Tecnicos <strong>de</strong> campo tco. 2 2000 6 24,000.0<br />
SUB TOTAL<br />
108,000.0<br />
TOTAL 176,590.0<br />
Costo mensual por brigada: S/. 29,431.67<br />
<strong>Plan</strong> <strong>de</strong> <strong>Gestión</strong> <strong>de</strong>l <strong>acuífero</strong> <strong>de</strong>l <strong>valle</strong> <strong>de</strong> <strong>Ica</strong><br />
y <strong>pampas</strong> <strong>de</strong> <strong>Villacurí</strong> y Lanchas
GRACIAS