El sector de la joyería - Icex
El sector de la joyería - Icex
El sector de la joyería - Icex

You also want an ePaper? Increase the reach of your titles
YUMPU automatically turns print PDFs into web optimized ePapers that Google loves.
EL SECTOR DE LA JOYERÍA EN AUSTRALIA…………………… 2006<br />
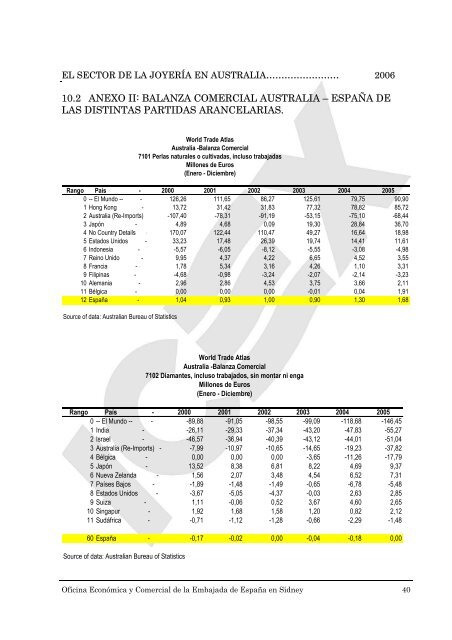
10.2 ANEXO II: BALANZA COMERCIAL AUSTRALIA – ESPAÑA DE<br />
LAS DISTINTAS PARTIDAS ARANCELARIAS.<br />
World Tra<strong>de</strong> At<strong>la</strong>s<br />
Australia -Ba<strong>la</strong>nza Comercial<br />
7101 Per<strong>la</strong>s naturales o cultivadas, incluso trabajadas<br />
Millones <strong>de</strong> Euros<br />
(Enero - Diciembre)<br />
Rango País - 2000 2001 2002 2003 2004 2005<br />
0 -- <strong>El</strong> Mundo -- - 126,26 111,65 86,27 125,61 79,75 90,90<br />
1 Hong Kong - 13,72 31,42 31,83 77,32 78,82 85,72<br />
2 Australia (Re-Imports) -107,40 -78,31 -91,19 -53,15 -75,10 -68,44<br />
3 Japón - 4,89 4,68 0,09 19,30 28,84 36,70<br />
4 No Country Details - 170,07 122,44 110,47 49,27 16,64 18,98<br />
5 Estados Unidos - 33,23 17,48 26,39 19,74 14,41 11,61<br />
6 Indonesia - -5,57 -6,05 -8,12 -5,55 -3,08 -4,98<br />
7 Reino Unido - 9,95 4,37 4,22 6,65 4,52 3,55<br />
8 Francia - 1,78 5,34 3,16 4,26 1,10 3,31<br />
9 Filipinas - -4,68 -0,98 -3,24 -2,07 -2,14 -3,23<br />
10 Alemania - 2,96 2,86 4,53 3,75 3,66 2,11<br />
11 Bélgica - 0,00 0,00 0,00 -0,01 0,04 1,91<br />
12 España - 1,04 0,93 1,00 0,90 1,30 1,68<br />
Source of data: Australian Bureau of Statistics<br />
World Tra<strong>de</strong> At<strong>la</strong>s<br />
Australia -Ba<strong>la</strong>nza Comercial<br />
7102 Diamantes, incluso trabajados, sin montar ni enga<br />
Millones <strong>de</strong> Euros<br />
(Enero - Diciembre)<br />
Rango País - 2000 2001 2002 2003 2004 2005<br />
0 -- <strong>El</strong> Mundo -- - -89,88 -91,05 -98,55 -99,09 -118,68 -146,45<br />
1 India - -26,11 -29,33 -37,34 -43,20 -47,83 -55,27<br />
2 Israel - -46,57 -36,94 -40,39 -43,12 -44,01 -51,04<br />
3 Australia (Re-Imports) - -7,99 -10,97 -10,65 -14,65 -19,23 -37,82<br />
4 Bélgica - 0,00 0,00 0,00 -3,65 -11,26 -17,79<br />
5 Japón - 13,52 8,38 6,81 8,22 4,69 9,37<br />
6 Nueva Ze<strong>la</strong>nda - 1,56 2,07 3,48 4,54 6,52 7,31<br />
7 Países Bajos - -1,89 -1,48 -1,49 -0,65 -6,78 -5,48<br />
8 Estados Unidos - -3,67 -5,05 -4,37 -0,03 2,63 2,85<br />
9 Suiza - 1,11 -0,06 0,52 3,67 4,60 2,65<br />
10 Singapur - 1,92 1,68 1,58 1,20 0,82 2,12<br />
11 Sudáfrica - -0,71 -1,12 -1,28 -0,66 -2,29 -1,48<br />
60 España - -0,17 -0,02 0,00 -0,04 -0,18 0,00<br />
Source of data: Australian Bureau of Statistics<br />
Oficina Económica y Comercial <strong>de</strong> <strong>la</strong> Embajada <strong>de</strong> España en Sidney 40