France Air Catálogo de Difusión
France Air Catálogo de Difusión
France Air Catálogo de Difusión

Create successful ePaper yourself
Turn your PDF publications into a flip-book with our unique Google optimized e-Paper software.
Distancia <strong>de</strong>s<strong>de</strong> el centro <strong>de</strong>l difusor (m)<br />
Velocidad <strong>de</strong>l aire (m/s)<br />
Reducción <strong>de</strong>l <strong>de</strong>lta <strong>de</strong> temperatura (%)<br />
rejillas<br />
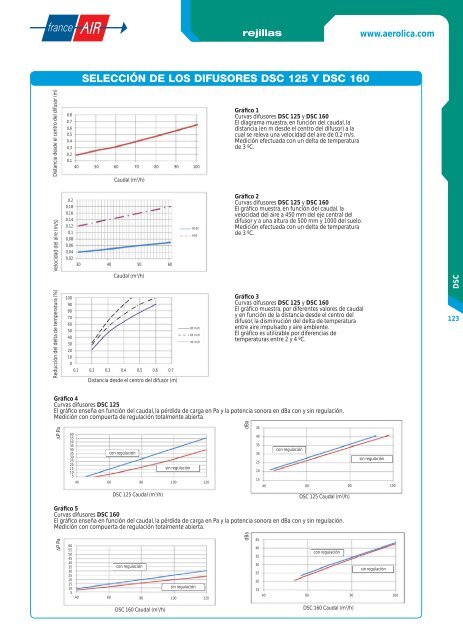
SELECCIÓN DE LOS DIFUSORES DSC 125 Y DSC 160<br />
0,8<br />
0,7<br />
0,6<br />
0,5<br />
0,4<br />
0,3<br />
0,2<br />
0,1<br />
40 50 60 70 80 90 100<br />
0,2<br />
0,18<br />
0,16<br />
0,14<br />
0,12<br />
0,1<br />
0,08<br />
0,06<br />
0,04<br />
0,02<br />
30<br />
Caudal (m 3 /h)<br />
40 50 60<br />
Caudal (m 3 /h)<br />
100<br />
90<br />
80<br />
70<br />
60<br />
50<br />
40<br />
30<br />
20<br />
10<br />
0<br />
0,1 0,2 0,3 0,4 0,5 0,6 0,7<br />
Distancia <strong>de</strong>s<strong>de</strong> el centro <strong>de</strong>l difusor (m)<br />
H100<br />
H50<br />
80 m3 /h<br />
60 m3 /h<br />
40 m 3 /h<br />
Gráfi co 1<br />
Curvas difusores DSC 125 y DSC 160<br />
El diagrama muestra, en función <strong>de</strong>l caudal, la<br />
distancia (en m <strong>de</strong>s<strong>de</strong> el centro <strong>de</strong>l difusor) a la<br />
cual se releva una velocidad <strong>de</strong>l aire <strong>de</strong> 0,2 m/s.<br />
Medición efectuada con un <strong>de</strong>lta <strong>de</strong> temperatura<br />
<strong>de</strong> 3 ºC.<br />
Gráfi co 2<br />
Curvas difusores DSC 125 y DSC 160<br />
El gráfi co muestra, en función <strong>de</strong>l caudal, la<br />
velocidad <strong>de</strong>l aire a 450 mm <strong>de</strong>l eje central <strong>de</strong>l<br />
difusor y a una altura <strong>de</strong> 500 mm y 1000 <strong>de</strong>l suelo.<br />
Medición efectuada con un <strong>de</strong>lta <strong>de</strong> temperatura<br />
<strong>de</strong> 3 ºC.<br />
Gráfi co 3<br />
Curvas difusores DSC 125 y DSC 160<br />
El gráfi co muestra, por diferentes valores <strong>de</strong> caudal<br />
y en función <strong>de</strong> la distancia <strong>de</strong>s<strong>de</strong> el centro <strong>de</strong>l<br />
difusor, la disminución <strong>de</strong>l <strong>de</strong>lta <strong>de</strong> temperatura<br />
entre aire impulsado y aire ambiente.<br />
El gráfi co es utilizable por diferencias <strong>de</strong><br />
temperaturas entre 2 y 4 ºC.<br />
Gráfi co 4<br />
Curvas difusores DSC 125<br />
El gráfi co enseña en función <strong>de</strong>l caudal, la pérdida <strong>de</strong> carga en Pa y la potencia sonora en dBa con y sin regulación.<br />
Medición con compuerta <strong>de</strong> regulación totalmente abierta.<br />
ΔP Pa<br />
45<br />
40<br />
35<br />
con regulación<br />
30<br />
sin regulación<br />
25<br />
20<br />
15<br />
40 60 80 100<br />
DSC 125 Caudal (m 3 /h)<br />
Gráfi co 5<br />
Curvas difusores DSC 160<br />
El gráfi co enseña en función <strong>de</strong>l caudal, la pérdida <strong>de</strong> carga en Pa y la potencia sonora en dBa con y sin regulación.<br />
Medición con compuerta <strong>de</strong> regulación totalmente abierta.<br />
ΔP Pa<br />
60<br />
55<br />
50<br />
45<br />
40<br />
35<br />
30<br />
25<br />
con regulación<br />
20<br />
15<br />
10<br />
5<br />
sin regulación<br />
40 60 80 100 120<br />
60<br />
55<br />
50<br />
45<br />
40<br />
35<br />
30<br />
25<br />
20<br />
15<br />
10<br />
5<br />
DSC 125 Caudal (m 3 /h)<br />
con regulación<br />
DSC 160 Caudal (m 3 /h)<br />
sin regulación<br />
40 60 80 100 120<br />
dBa<br />
dBa<br />
DSC 160 Caudal (m 3 /h)<br />
www.aerolica.com<br />
45<br />
40<br />
con regulación<br />
35<br />
30<br />
sin regulación<br />
25<br />
20<br />
15<br />
40 60 80 100<br />
DSC<br />
123