Prevalencia de alergia - Alergología e Inmunología Clínica
Prevalencia de alergia - Alergología e Inmunología Clínica
Prevalencia de alergia - Alergología e Inmunología Clínica

Create successful ePaper yourself
Turn your PDF publications into a flip-book with our unique Google optimized e-Paper software.
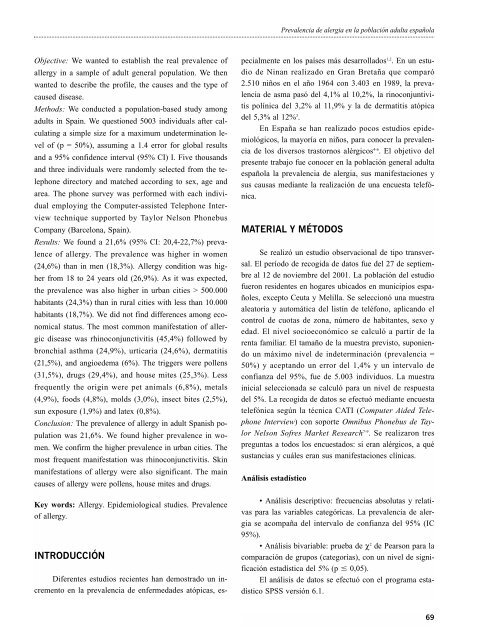
Objective: We wanted to establish the real prevalence of<br />
allergy in a sample of adult general population. We then<br />
wanted to <strong>de</strong>scribe the profile, the causes and the type of<br />
caused disease.<br />
Methods: We conducted a population-based study among<br />
adults in Spain. We questioned 5003 individuals after calculating<br />
a simple size for a maximum un<strong>de</strong>termination level<br />
of (p = 50%), assuming a 1.4 error for global results<br />
and a 95% confi<strong>de</strong>nce interval (95% CI) I. Five thousands<br />
and three individuals were randomly selected from the telephone<br />
directory and matched according to sex, age and<br />
area. The phone survey was performed with each individual<br />
employing the Computer-assisted Telephone Interview<br />
technique supported by Taylor Nelson Phonebus<br />
Company (Barcelona, Spain).<br />
Results: We found a 21,6% (95% CI: 20,4-22,7%) prevalence<br />
of allergy. The prevalence was higher in women<br />
(24,6%) than in men (18,3%). Allergy condition was higher<br />
from 18 to 24 years old (26,9%). As it was expected,<br />
the prevalence was also higher in urban cities > 500.000<br />
habitants (24,3%) than in rural cities with less than 10.000<br />
habitants (18,7%). We did not find differences among economical<br />
status. The most common manifestation of allergic<br />
disease was rhinoconjunctivitis (45,4%) followed by<br />
bronchial asthma (24,9%), urticaria (24,6%), <strong>de</strong>rmatitis<br />
(21,5%), and angioe<strong>de</strong>ma (6%). The triggers were pollens<br />
(31,5%), drugs (29,4%), and house mites (25,3%). Less<br />
frequently the origin were pet animals (6,8%), metals<br />
(4,9%), foods (4,8%), molds (3,0%), insect bites (2,5%),<br />
sun exposure (1,9%) and latex (0,8%).<br />
Conclusion: The prevalence of allergy in adult Spanish population<br />
was 21,6%. We found higher prevalence in women.<br />
We confirm the higher prevalence in urban cities. The<br />
most frequent manifestation was rhinoconjunctivitis. Skin<br />
manifestations of allergy were also significant. The main<br />
causes of allergy were pollens, house mites and drugs.<br />
Key words: Allergy. Epi<strong>de</strong>miological studies. Prevalence<br />
of allergy.<br />
INTRODUCCIÓN<br />
Diferentes estudios recientes han <strong>de</strong>mostrado un incremento<br />
en la prevalencia <strong>de</strong> enfermeda<strong>de</strong>s atópicas, es-<br />
<strong>Prevalencia</strong> <strong>de</strong> <strong>alergia</strong> en la población adulta española<br />
pecialmente en los países más <strong>de</strong>sarrollados 1,2 . En un estudio<br />
<strong>de</strong> Ninan realizado en Gran Bretaña que comparó<br />
2.510 niños en el año 1964 con 3.403 en 1989, la prevalencia<br />
<strong>de</strong> asma pasó <strong>de</strong>l 4,1% al 10,2%, la rinoconjuntivitis<br />
polínica <strong>de</strong>l 3,2% al 11,9% y la <strong>de</strong> <strong>de</strong>rmatitis atópica<br />
<strong>de</strong>l 5,3% al 12% 3 .<br />
En España se han realizado pocos estudios epi<strong>de</strong>miológicos,<br />
la mayoría en niños, para conocer la prevalencia<br />
<strong>de</strong> los diversos trastornos alérgicos 4-6 . El objetivo <strong>de</strong>l<br />
presente trabajo fue conocer en la población general adulta<br />
española la prevalencia <strong>de</strong> <strong>alergia</strong>, sus manifestaciones y<br />
sus causas mediante la realización <strong>de</strong> una encuesta telefónica.<br />
MATERIAL Y MÉTODOS<br />
Se realizó un estudio observacional <strong>de</strong> tipo transversal.<br />
El período <strong>de</strong> recogida <strong>de</strong> datos fue <strong>de</strong>l 27 <strong>de</strong> septiembre<br />
al 12 <strong>de</strong> noviembre <strong>de</strong>l 2001. La población <strong>de</strong>l estudio<br />
fueron resi<strong>de</strong>ntes en hogares ubicados en municipios españoles,<br />
excepto Ceuta y Melilla. Se seleccionó una muestra<br />
aleatoria y automática <strong>de</strong>l listín <strong>de</strong> teléfono, aplicando el<br />
control <strong>de</strong> cuotas <strong>de</strong> zona, número <strong>de</strong> habitantes, sexo y<br />
edad. El nivel socioeconómico se calculó a partir <strong>de</strong> la<br />
renta familiar. El tamaño <strong>de</strong> la muestra previsto, suponiendo<br />
un máximo nivel <strong>de</strong> in<strong>de</strong>terminación (prevalencia =<br />
50%) y aceptando un error <strong>de</strong>l 1,4% y un intervalo <strong>de</strong><br />
confianza <strong>de</strong>l 95%, fue <strong>de</strong> 5.003 individuos. La muestra<br />
inicial seleccionada se calculó para un nivel <strong>de</strong> respuesta<br />
<strong>de</strong>l 5%. La recogida <strong>de</strong> datos se efectuó mediante encuesta<br />
telefónica según la técnica CATI (Computer Ai<strong>de</strong>d Telephone<br />
Interview) con soporte Omnibus Phonebus <strong>de</strong> Taylor<br />
Nelson Sofres Market Research 7-9 . Se realizaron tres<br />
preguntas a todos los encuestados: si eran alérgicos, a qué<br />
sustancias y cuáles eran sus manifestaciones clínicas.<br />
Análisis estadístico<br />
• Análisis <strong>de</strong>scriptivo: frecuencias absolutas y relativas<br />
para las variables categóricas. La prevalencia <strong>de</strong> <strong>alergia</strong><br />
se acompaña <strong>de</strong>l intervalo <strong>de</strong> confianza <strong>de</strong>l 95% (IC<br />
95%).<br />
• Análisis bivariable: prueba <strong>de</strong> χ 2 <strong>de</strong> Pearson para la<br />
comparación <strong>de</strong> grupos (categorías), con un nivel <strong>de</strong> significación<br />
estadística <strong>de</strong>l 5% (p 0,05).<br />
El análisis <strong>de</strong> datos se efectuó con el programa estadístico<br />
SPSS versión 6.1.<br />
69