Download Document - GSMA
Download Document - GSMA
Download Document - GSMA

Create successful ePaper yourself
Turn your PDF publications into a flip-book with our unique Google optimized e-Paper software.
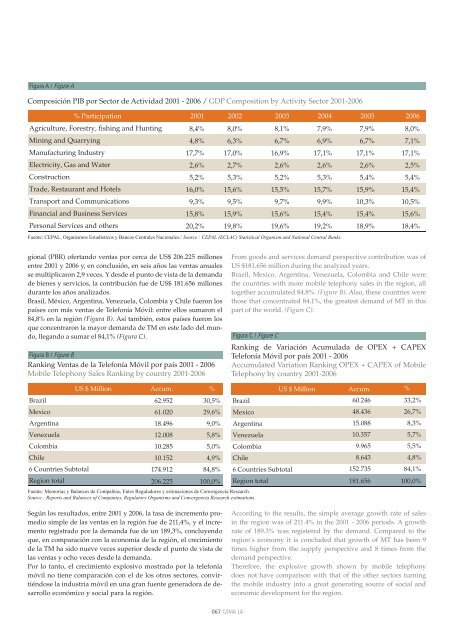
Figura A / Figure A<br />
Composición PIB por Sector de Actividad 2001 - 2006 / GDP Composition by Activity Sector 2001-2006<br />
% Participation 2001 2002 2003 2004 2005 2006<br />
Agriculture, Forestry, fishing and Hunting 8,4% 8,0% 8,1% 7,9% 7,9% 8,0%<br />
Mining and Quarrying 4,8% 6,3% 6,7% 6,9% 6,7% 7,1%<br />
Manufacturing Industry 17,7% 17,0% 16,9% 17,1% 17,1% 17,1%<br />
Electricity, Gas and Water 2,6% 2,7% 2,6% 2,6% 2,6% 2,5%<br />
Construction 5,2% 5,3% 5,2% 5,3% 5,4% 5,4%<br />
Trade, Restaurant and Hotels 16,0% 15,6% 15,5% 15,7% 15,9% 15,4%<br />
Transport and Communications 9,3% 9,5% 9,7% 9,9% 10,3% 10,5%<br />
Financial and Business Services 15,8% 15,9% 15,6% 15,4% 15,4% 15,6%<br />
Personal Services and others 20,2% 19,8% 19,6% 19,2% 18,9% 18,4%<br />
Fuente: CEPAL, Organismos Estadísticos y Bancos Centrales Nacionales./ Source : CEPAL (ECLAC) Statistical Organism and National Central Banks.<br />
gional (PBR) ofertando ventas por cerca de US$ 206.225 millones<br />
entre 2001 y 2006 y, en conclusión, en seis años las ventas anuales<br />
se multiplicaron 2,9 veces. Y desde el punto de vista de la demanda<br />
de bienes y servicios, la contribución fue de US$ 181.656 millones<br />
durante los años analizados.<br />
Brasil, México, Argentina, Venezuela, Colombia y Chile fueron los<br />
países con más ventas de Telefonía Móvil: entre ellos sumaron el<br />
84,8% en la región (Figura B). Así también, estos países fueron los<br />
que concentraron la mayor demanda de TM en este lado del mundo,<br />
llegando a sumar el 84,1% (Figura C).<br />
Figura B / Figure B<br />
Ranking Ventas de la Telefonía Móvil por país 2001 - 2006<br />
Mobile Telephony Sales Ranking by country 2001-2006<br />
From goods and services demand perspective contribution was of<br />
US $181.656 million during the analyzed years.<br />
Brazil, Mexico, Argentina, Venezuela, Colombia and Chile were<br />
the countries with more mobile telephony sales in the region, all<br />
together accumulated 84.8%. (Figure B). Also, these countries were<br />
those that concentrated 84.1%, the greatest demand of MT in this<br />
part of the world. (Figure C).<br />
Figura C / Figure C<br />
Ranking de Variación Acumulada de OPEX + CAPEX<br />
Telefonía Móvil por país 2001 - 2006<br />
Accumulated Variation Ranking OPEX + CAPEX of Mobile<br />
Telephony by country 2001-2006<br />
US $ Million Accum. %<br />
US $ Million Accum. %<br />
Brazil 62.952 30,5% Brazil 60.246 33,2%<br />
Mexico 61.020 29,6% Mexico 48.436 26,7%<br />
Argentina 18.496 9,0% Argentina 15.088 8,3%<br />
Venezuela 12.008 5,8% Venezuela 10.357 5,7%<br />
Colombia 10.285 5,0% Colombia 9.965 5,5%<br />
Chile 10.152 4,9% Chile 8.643 4,8%<br />
6 Countries Subtotal 174.912 84,8% 6 Countries Subtotal 152.735 84,1%<br />
Region total 206.225 100,0% Region total 181.656 100,0%<br />
Fuente: Memorias y Balances de Compañías, Entes Reguladores y estimaciones de Convergencia Research.<br />
Source : Reports and Balances of Companies, Regulatory Organisms and Convergencia Research estimations.<br />
Según los resultados, entre 2001 y 2006, la tasa de incremento promedio<br />
simple de las ventas en la región fue de 211,4%, y el incremento<br />
registrado por la demanda fue de un 189,3%, concluyendo<br />
que, en comparación con la economía de la región, el crecimiento<br />
de la TM ha sido nueve veces superior desde el punto de vista de<br />
las ventas y ocho veces desde la demanda.<br />
Por lo tanto, el crecimiento explosivo mostrado por la telefonía<br />
móvil no tiene comparación con el de los otros sectores, convirtiéndose<br />
la industria móvil en una gran fuente generadora de desarrollo<br />
económico y social para la región.<br />
According to the results, the simple average growth rate of sales<br />
in the region was of 211.4% in the 2001 - 2006 periods. A growth<br />
rate of 189.3% was registered by the demand. Compared to the<br />
region’s economy it is concluded that growth of MT has been 9<br />
times higher from the supply perspective and 8 times from the<br />
demand perspective.<br />
Therefore, the explosive growth shown by mobile telephony<br />
does not have comparison with that of the other sectors turning<br />
the mobile industry into a great generating source of social and<br />
economic development for the region.<br />
067 <strong>GSMA</strong> LA