EstadÃstica de las Elecciones Locales 2009 - Instituto Electoral del ...
EstadÃstica de las Elecciones Locales 2009 - Instituto Electoral del ...
EstadÃstica de las Elecciones Locales 2009 - Instituto Electoral del ...

You also want an ePaper? Increase the reach of your titles
YUMPU automatically turns print PDFs into web optimized ePapers that Google loves.
DIPUTADOS DE REPRESENTACIÓN PROPORCIONAL<br />
Estadística <strong>de</strong> la entidad<br />
Estadística <strong>de</strong> la entidad<br />
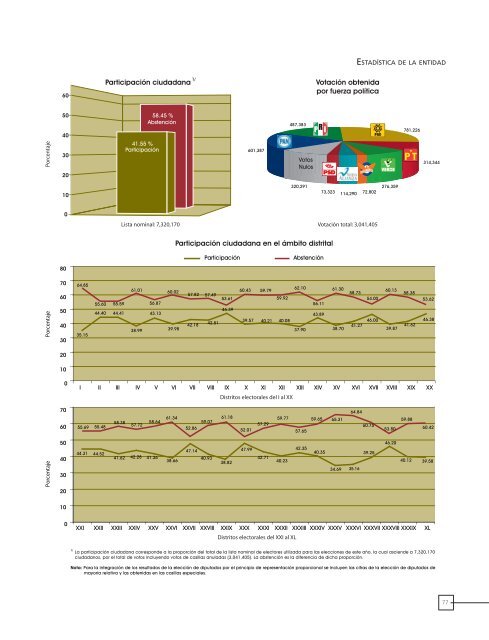
Participación ciudadana 1/ Votación total: 3,041,405<br />
60<br />
Votación obtenida<br />
por fuerza política<br />
Porcentaje<br />
50<br />
40<br />
30<br />
20<br />
41.55 %<br />
Participación<br />
58.45 %<br />
Abstención<br />
601,387<br />
487,383<br />
Votos<br />
Nulos<br />
781,226<br />
314,344<br />
10<br />
320,291<br />
73,323<br />
114,290<br />
72,802<br />
276,359<br />
0<br />
Lista nominal: 7,320,170<br />
Participación ciudadana en el ámbito distrital<br />
80<br />
Participación<br />
Abstención<br />
Porcentaje<br />
70<br />
60<br />
50<br />
40<br />
30<br />
64.85<br />
35.15<br />
61.01<br />
55.60 55.59<br />
56.87<br />
44.40 44.41<br />
43.13<br />
38.99<br />
60.02<br />
39.98<br />
57.82 57.49<br />
53.61<br />
46.39<br />
42.18<br />
42.51<br />
60.43 59.79<br />
59.92<br />
39.57 40.21 40.08<br />
62.10<br />
37.90<br />
56.11<br />
43.89<br />
61.30<br />
38.70<br />
58.73<br />
41.27<br />
54.00<br />
46.00<br />
60.13<br />
39.87<br />
58.38<br />
41.62<br />
53.62<br />
46.38<br />
20<br />
10<br />
0<br />
I<br />
II<br />
III<br />
IV<br />
V<br />
VI<br />
VII<br />
VIII<br />
IX X XI XII<br />
Distritos electorales <strong>de</strong>l I al XX<br />
XIII<br />
XIV<br />
XV<br />
XVI<br />
XVII<br />
XVIII<br />
XIX<br />
XX<br />
70<br />
60<br />
55.69 55.48<br />
58.38<br />
57.72<br />
58.64<br />
61.34<br />
52.86<br />
59.07<br />
61.18<br />
52.01<br />
57.29<br />
59.77<br />
57.65<br />
59.65 65.31<br />
64.84<br />
60.75<br />
53.80<br />
59.88<br />
60.42<br />
Porcentaje<br />
50<br />
40<br />
30<br />
20<br />
44.31 44.52<br />
41.62 42.28 41.36<br />
38.66<br />
47.14<br />
40.93<br />
38.82<br />
47.99<br />
42.71<br />
40.23<br />
42.35<br />
40.35<br />
34.69 35.16<br />
39.25<br />
46.20<br />
40.12 39.58<br />
10<br />
0<br />
XXI<br />
XXII<br />
XXIII<br />
XXIV<br />
XXV<br />
XXVI<br />
XXVII<br />
XXVIII XXIX XXX XXXI XXXII XXXIII<br />
Distritos electorales <strong>de</strong>l XXI al XL<br />
XXXIV<br />
XXXV<br />
XXXVI XXXVII XXXVIII<br />
XXXIX<br />
XL<br />
1/<br />
La participación ciudadana correspon<strong>de</strong> a la proporción <strong>de</strong>l total <strong>de</strong> la lista nominal <strong>de</strong> electores utilizada para <strong>las</strong> elecciones <strong>de</strong> este año, la cual ascien<strong>de</strong> a 7,320,170<br />
ciudadanos, por el total <strong>de</strong> votos incluyendo votos <strong>de</strong> casil<strong>las</strong> anuladas (3,041,405). La abstención es la diferencia <strong>de</strong> dicha proporción.<br />
Nota: Para la integración <strong>de</strong> los resultados <strong>de</strong> la elección <strong>de</strong> diputados por el principio <strong>de</strong> representación proporcional se incluyen <strong>las</strong> cifras <strong>de</strong> la elección <strong>de</strong> diputados <strong>de</strong><br />
mayoría relativa y <strong>las</strong> obtenidas en <strong>las</strong> casil<strong>las</strong> especiales.<br />
75<br />
77