Pruebas de acceso a la Universidad 2009 - Instituto Nacional de ...
Pruebas de acceso a la Universidad 2009 - Instituto Nacional de ...
Pruebas de acceso a la Universidad 2009 - Instituto Nacional de ...

You also want an ePaper? Increase the reach of your titles
YUMPU automatically turns print PDFs into web optimized ePapers that Google loves.
17 <strong>de</strong> diciembre <strong>de</strong> <strong>2009</strong><br />
<strong>Pruebas</strong> <strong>de</strong> Acceso a <strong>la</strong> <strong>Universidad</strong>. Año <strong>2009</strong><br />
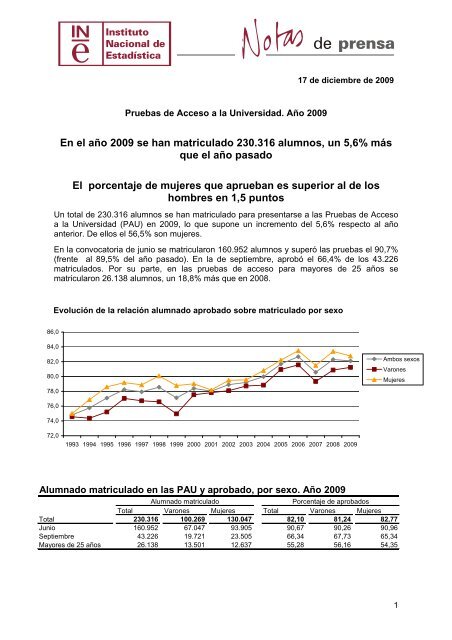
En el año <strong>2009</strong> se han matricu<strong>la</strong>do 230.316 alumnos, un 5,6% más<br />
que el año pasado<br />
El porcentaje <strong>de</strong> mujeres que aprueban es superior al <strong>de</strong> los<br />
hombres en 1,5 puntos<br />
Un total <strong>de</strong> 230.316 alumnos se han matricu<strong>la</strong>do para presentarse a <strong>la</strong>s <strong>Pruebas</strong> <strong>de</strong> Acceso<br />
a <strong>la</strong> <strong>Universidad</strong> (PAU) en <strong>2009</strong>, lo que supone un incremento <strong>de</strong>l 5,6% respecto al año<br />
anterior. De ellos el 56,5% son mujeres.<br />
En <strong>la</strong> convocatoria <strong>de</strong> junio se matricu<strong>la</strong>ron 160.952 alumnos y superó <strong>la</strong>s pruebas el 90,7%<br />
(frente al 89,5% <strong>de</strong>l año pasado). En <strong>la</strong> <strong>de</strong> septiembre, aprobó el 66,4% <strong>de</strong> los 43.226<br />
matricu<strong>la</strong>dos. Por su parte, en <strong>la</strong>s pruebas <strong>de</strong> <strong>acceso</strong> para mayores <strong>de</strong> 25 años se<br />
matricu<strong>la</strong>ron 26.138 alumnos, un 18,8% más que en 2008.<br />
Evolución <strong>de</strong> <strong>la</strong> re<strong>la</strong>ción alumnado aprobado sobre matricu<strong>la</strong>do por sexo<br />
86,0<br />
84,0<br />
82,0<br />
80,0<br />
78,0<br />
Ambos sexos<br />
Varones<br />
Mujeres<br />
76,0<br />
74,0<br />
72,0<br />
1993 1994 1995 1996 1997 1998 1999 2000 2001 2002 2003 2004 2005 2006 2007 2008 <strong>2009</strong><br />
Alumnado matricu<strong>la</strong>do en <strong>la</strong>s PAU y aprobado, por sexo. Año <strong>2009</strong><br />
Alumnado matricu<strong>la</strong>do<br />
Porcentaje <strong>de</strong> aprobados<br />
Total Varones Mujeres Total Varones Mujeres<br />
Total 230.316 100.269 130.047 82,10 81,24 82,77<br />
Junio 160.952 67.047 93.905 90,67 90,26 90,96<br />
Septiembre 43.226 19.721 23.505 66,34 67,73 65,34<br />
Mayores <strong>de</strong> 25 años 26.138 13.501 12.637 55,28 56,16 54,35<br />
1
<strong>Instituto</strong> <strong>Nacional</strong> <strong>de</strong> Estadística<br />
Las mujeres obtienen un porcentaje mayor <strong>de</strong> aprobados<br />
El 82,8% <strong>de</strong> <strong>la</strong>s mujeres aspirantes a ingresar en <strong>la</strong> <strong>Universidad</strong> aprueba. En el caso <strong>de</strong> los<br />
hombres, el porcentaje <strong>de</strong> aprobados se sitúa en el 81,2%.<br />
La opción <strong>de</strong> Ciencias Sociales es <strong>la</strong> preferida por los alumnos<br />
Excluyendo <strong>la</strong>s pruebas para mayores <strong>de</strong> 25 años, el 33,1% <strong>de</strong>l alumnado elige <strong>la</strong> opción <strong>de</strong><br />
Ciencias Sociales, le siguen <strong>la</strong> opción <strong>de</strong> Ciencias <strong>de</strong> <strong>la</strong> Salud (con un 26,0%) y <strong>la</strong> Científico-<br />
Técnica (21,8%). Las dos opciones con menor peso son Combinadas (alumnos que se<br />
presentan a más <strong>de</strong> una opción), con un 4,9%, y Artes, con un 2,5%.<br />
Porcentaje <strong>de</strong> alumnado matricu<strong>la</strong>do por Opciones y sexo<br />
Científico-Técnica<br />
11,2<br />
36,1<br />
Ciencias <strong>de</strong> <strong>la</strong> Salud<br />
Ciencias Sociales<br />
20,5<br />
28,9<br />
30,1<br />
36,2<br />
Mujeres<br />
Varones<br />
Humanida<strong>de</strong>s<br />
7,7<br />
14,8<br />
Artes<br />
3,0<br />
1,8<br />
Combinadas<br />
4,8<br />
5,1<br />
0 5 10 15 20 25 30 35 40<br />
La opción <strong>de</strong> Ciencias Sociales es <strong>la</strong> más elegida por <strong>la</strong>s mujeres y <strong>la</strong><br />
Científico-Técnica por los varones<br />
En cuanto a <strong>la</strong>s preferencias por sexo, el 36,2% <strong>de</strong> <strong>la</strong>s mujeres elige <strong>la</strong> opción <strong>de</strong> Ciencias<br />
Sociales, mientras que sólo un 3,0% opta por Artes.<br />
En el caso <strong>de</strong> los varones, el 36,1% se presenta por <strong>la</strong> opción Científico-Técnica, mientras<br />
que sólo un 1,8% elige Artes.<br />
Más información en INEbase – www.ine.es Todas <strong>la</strong>s notas <strong>de</strong> prensa en: www.ine.es/prensa/prensa.htm<br />
Gabinete <strong>de</strong> prensa: Teléfonos: 91 583 93 63 / 94 08 – Fax: 91 583 90 87 - gprensa@ine.es<br />
Área <strong>de</strong> información: Teléfono: 91 583 91 00 – Fax: 91 583 91 58 – www.ine.es/infoine<br />
2