Percentage of persons aged 50 to 69 , according to number of years ...
Percentage of persons aged 50 to 69 , according to number of years ...
Percentage of persons aged 50 to 69 , according to number of years ...
You also want an ePaper? Increase the reach of your titles
YUMPU automatically turns print PDFs into web optimized ePapers that Google loves.
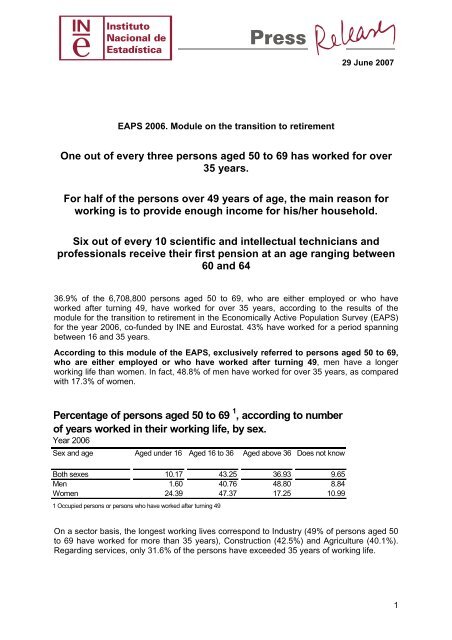
29 June 2007EAPS 2006. Module on the transition <strong>to</strong> retirementOne out <strong>of</strong> every three <strong>persons</strong> <strong>aged</strong> <strong>50</strong> <strong>to</strong> <strong>69</strong> has worked for over35 <strong>years</strong>.For half <strong>of</strong> the <strong>persons</strong> over 49 <strong>years</strong> <strong>of</strong> age, the main reason forworking is <strong>to</strong> provide enough income for his/her household.Six out <strong>of</strong> every 10 scientific and intellectual technicians andpr<strong>of</strong>essionals receive their first pension at an age ranging between60 and 6436.9% <strong>of</strong> the 6,708,800 <strong>persons</strong> <strong>aged</strong> <strong>50</strong> <strong>to</strong> <strong>69</strong>, who are either employed or who haveworked after turning 49, have worked for over 35 <strong>years</strong>, <strong>according</strong> <strong>to</strong> the results <strong>of</strong> themodule for the transition <strong>to</strong> retirement in the Economically Active Population Survey (EAPS)for the year 2006, co-funded by INE and Eurostat. 43% have worked for a period spanningbetween 16 and 35 <strong>years</strong>.According <strong>to</strong> this module <strong>of</strong> the EAPS, exclusively referred <strong>to</strong> <strong>persons</strong> <strong>aged</strong> <strong>50</strong> <strong>to</strong> <strong>69</strong>,who are either employed or who have worked after turning 49, men have a longerworking life than women. In fact, 48.8% <strong>of</strong> men have worked for over 35 <strong>years</strong>, as comparedwith 17.3% <strong>of</strong> women.<strong>Percentage</strong> <strong>of</strong> <strong>persons</strong> <strong>aged</strong> <strong>50</strong> <strong>to</strong> <strong>69</strong> 1 , <strong>according</strong> <strong>to</strong> <strong>number</strong><strong>of</strong> <strong>years</strong> worked in their working life, by sex.Year 2006Sex and age Aged under 16 Aged 16 <strong>to</strong> 36 Aged above 36 Does not knowBoth sexes 10.17 43.25 36.93 9.65Men 1.60 40.76 48.80 8.84Women 24.39 47.37 17.25 10.991 Occupied <strong>persons</strong> or <strong>persons</strong> who have worked after turning 49On a sec<strong>to</strong>r basis, the longest working lives correspond <strong>to</strong> Industry (49% <strong>of</strong> <strong>persons</strong> <strong>aged</strong> <strong>50</strong><strong>to</strong> <strong>69</strong> have worked for more than 35 <strong>years</strong>), Construction (42.5%) and Agriculture (40.1%).Regarding services, only 31.6% <strong>of</strong> the <strong>persons</strong> have exceeded 35 <strong>years</strong> <strong>of</strong> working life.1
In as far as pr<strong>of</strong>essional status is concerned, <strong>50</strong>.1% <strong>of</strong> self-employed men and 47.7% <strong>of</strong> menemployed by others exceed 35 <strong>years</strong> <strong>of</strong> working life. In the case <strong>of</strong> women, less than 17.4%have worked 36 or more <strong>years</strong>, either as employees for others or as self-employed workers.Retirement pensionsThree out <strong>of</strong> every four <strong>persons</strong> <strong>aged</strong> <strong>50</strong> <strong>to</strong> <strong>69</strong>, who are either employed or who have workedafter turning 49, do not receive any type <strong>of</strong> pension, a percentage that stands at 82.1% in thecase <strong>of</strong> women and 70.7% in the case <strong>of</strong> men.These percentages decline as the age <strong>of</strong> the reference group increases. Thus, 82.0% <strong>of</strong> the<strong>persons</strong> <strong>aged</strong> 65 <strong>to</strong> <strong>69</strong> receive a retirement pension. In this age group women are alsoless favoured (68% <strong>of</strong> them receive a pension, versus 89.1% <strong>of</strong> men).<strong>Percentage</strong> <strong>of</strong> <strong>persons</strong> <strong>aged</strong> <strong>50</strong> <strong>to</strong> <strong>69</strong> 1depending on wether they do or do notreceive a retirement pension, by sex and agegroupsYear 2006Sex and age Yes No Does not knowBoth sexes 24.77 74.97 0.26<strong>50</strong>-54 1.45 98.28 0.2855-59 7.57 92.10 0.3360-64 27.34 72.48 0.1865-<strong>69</strong> 81.98 17.76 0.26Men 29.06 70.<strong>69</strong> 0.25<strong>50</strong>-54 1.49 98.38 0.1455-59 9.63 89.92 0.4560-64 32.08 67.72 0.2065-<strong>69</strong> 89.11 10.67 0.21Women 17.64 82.07 0.29<strong>50</strong>-54 1.39 98.12 0.4955-59 4.34 95.53 0.1360-64 18.71 81.13 0.1565-<strong>69</strong> 68.03 31.63 0.34Last occupation before receiving the first retirement pensionAnalysing the different occupations, it is worth noting that 60.7% <strong>of</strong> scientific and intellectualtechnicians and pr<strong>of</strong>essionals received their first pension at ages 60 through 64. Thispercentage exceeds by more than 20 points the <strong>to</strong>tal average (40.0%), and by 45 points thepercentage <strong>of</strong> skilled workers in agriculture and fishing.On the other hand, 68.5% <strong>of</strong> skilled workers in agriculture and fishing and 55.5% <strong>of</strong> businessmanagement and Public Administration workers received their first pension at ages 65through <strong>69</strong>. Both percentages stand well above the <strong>to</strong>tal average (33.7%).2
<strong>Percentage</strong> <strong>of</strong> <strong>persons</strong> <strong>aged</strong> <strong>50</strong> <strong>to</strong> <strong>69</strong> 1 <strong>according</strong> <strong>to</strong> the age at whichthey received their first retirement pension, and based on the las<strong>to</strong>ccupation they 2 worked inYear 2006Occupation 0-54 55-59 60-64 65-<strong>69</strong>Total 11.62 14.75 39.97 33.66Armed forces (*) 20.83 44.31 7.71 27.15Business management and Public Administration 6.68 11.05 26.73 55.54Scientific and intellectual technicians and pr<strong>of</strong>essionals 6.32 9.<strong>50</strong> 60.<strong>69</strong> 23.49Support technicians and pr<strong>of</strong>essionals 16.06 20.21 45.96 17.77Administrative-type employees 19.64 18.75 40.54 21.07Catering, personal services, security and retail workers 6.96 13.58 36.43 43.03Skilled workers in agriculture and fishing 5.26 10.57 15.68 68.49Craftsmen and qualified industry workers, construction andmining workers, except opera<strong>to</strong>rs 10.<strong>50</strong> 13.02 43.41 33.06Facility and machinery opera<strong>to</strong>rs; fitters 5.38 12.14 55.04 27.44Unskilled workers 7.12 7.83 36.86 48.19Not applicable** 20.13 21.38 38.98 19.521 Persons employed or who have worked after turning 49 and perceive a retirement pension2 For employed <strong>persons</strong>, it makes reference <strong>to</strong> their current occupation* Disaggregate results by age groups for this occupation are not significant, due <strong>to</strong> the scarce representation <strong>of</strong> the collective.** Non-applicable makes reference <strong>to</strong> currently unemployed <strong>persons</strong>, who s<strong>to</strong>pped working over 8 <strong>years</strong> ago, and thereforecannot be classified on a sec<strong>to</strong>r basisEstimated expected age for withdrawing from the labour activityOut <strong>of</strong> the <strong>to</strong>tal <strong>number</strong> <strong>of</strong> <strong>persons</strong> <strong>aged</strong> <strong>50</strong> <strong>to</strong> <strong>69</strong> who are occupied or who have worked afterturning 49, 4,486,800 intend <strong>to</strong> keep on working or <strong>to</strong> work again. 33.3% <strong>of</strong> these <strong>persons</strong>will conclude their labour activity at 65 <strong>years</strong> <strong>of</strong> age, 31.9% do not know when they will,21.1% will do so at ages 60 through 64, 9.0% after age 65 and 4.7% before age 60. Nosignificant differences are noticed between age groups on a gender basis.Age 65 is preferred by these people <strong>to</strong> put an end <strong>to</strong> their working life in all sec<strong>to</strong>rs, except inIndustry, where the majority chooses <strong>to</strong> s<strong>to</strong>p working at ages 60 through 64.Reasons <strong>to</strong> continue workingThe <strong>number</strong> <strong>of</strong> <strong>persons</strong> <strong>aged</strong> <strong>50</strong> <strong>to</strong> <strong>69</strong> who continue working, after having received a pensionat any point in time, or who have a right <strong>to</strong> receive one is 1,178,<strong>50</strong>0.3
51.9% <strong>of</strong> this figure states the need <strong>to</strong> earn sufficient household income as the main reason<strong>to</strong> continue working, while for 24.3% the reason is <strong>to</strong> increase their pension earning rights,and another 19.7% argues non-economic reasons.However, reasons vary by age groups. At lower ages, the importance <strong>of</strong> generating sufficientincome becomes more relevant (67.7%). On the other hand, for 57.9% <strong>of</strong> <strong>persons</strong> <strong>aged</strong> 65 <strong>to</strong><strong>69</strong> the main reasons <strong>to</strong> continue working are not <strong>of</strong> an economic nature.Main reason <strong>to</strong> continue working, for <strong>persons</strong> <strong>aged</strong> <strong>50</strong> <strong>to</strong><strong>69</strong> 1 who have either received a retirement pension at somepoint in time, or who, not having received it, are entitled <strong>to</strong>it, by age groupYear 2006. <strong>Percentage</strong>sAgeEarn sufficienthouseholdincomeIncreaseretirementpension rightsNon-economicmotivesDoes notknowTotal 51.87 24.33 19.71 4.09<strong>50</strong>-54 67.72 15.43 12.99 3.8755-59 54.94 26.91 15.20 2.9560-64 36.73 34.33 23.61 5.3365-<strong>69</strong> 23.31 14.11 57.87 4.711 Persons employed or who have worked after turning 49On a gender basis, there are no significant differences for this variable. However, differencesdo appear when analysing it on a sec<strong>to</strong>r or pr<strong>of</strong>essional situation basis.Thus, the percentage <strong>of</strong> <strong>persons</strong> employed in the Construction industry who continueworking <strong>to</strong> earn sufficient household income reaches 63.0% (versus <strong>50</strong>.7% in the remainingsec<strong>to</strong>rs). The percentage <strong>of</strong> <strong>persons</strong> who continue working in said sec<strong>to</strong>r due <strong>to</strong> economicreasons stands at 12.2%, versus 17.0% in Industry, 21.2% in Services and 24.6% inAgriculture.Regarding pr<strong>of</strong>essional situation, 63.0% <strong>of</strong> self-employed workers continue working <strong>to</strong> earnsufficient household income, versus <strong>50</strong>.7% <strong>of</strong> workers employed by others. The situationdiffers when the motives are not economic. This is the argument 12.2% <strong>of</strong> self employedworkers and 21.2% <strong>of</strong> workers employed by others claim as the reason <strong>to</strong> continue working.Duration <strong>of</strong> the working day and extension <strong>of</strong> the working lifeOnly 3.4% <strong>of</strong> the <strong>persons</strong> have agreed <strong>to</strong> reduce their working hours as a transi<strong>to</strong>ry measureprior <strong>to</strong> retirement. 72.5% <strong>of</strong> the remainder who have not done so, have not even consideredreducing them.Regarding fac<strong>to</strong>rs contributing or that might contribute <strong>to</strong> the extension <strong>of</strong> the working life,three out <strong>of</strong> each four <strong>persons</strong> state that neither hour flexibility, continuous training, or safetyconditions are useful at all <strong>to</strong> this regard.4
Reasons for retiringFor <strong>persons</strong> <strong>aged</strong> <strong>50</strong> <strong>to</strong> <strong>69</strong>, the main reason for retiring is having reached retirement age,stated by 47.6% <strong>of</strong> the <strong>to</strong>tal. This percentage is 46.3% for women and 48.1% for men.As a main motive for retiring, illness or disability lag way behind, with 16.0% <strong>of</strong> the <strong>to</strong>tal.The greatest gender differences are noticed in connection with the responsibility for takingcare <strong>of</strong> other <strong>persons</strong> (the percentage <strong>of</strong> women exceeds by more than 3 points that <strong>of</strong> men),and with incentives or economic conditions (the percentage <strong>of</strong> men exceeds almost by threepoints that <strong>of</strong> women).Persons <strong>aged</strong> <strong>50</strong> <strong>to</strong> <strong>69</strong> 1 who retired after quitting theirlast job, <strong>according</strong> <strong>to</strong> the main reason for doing so, andby sexYear 2006. <strong>Percentage</strong>sReason for retiringBothsexesMalesFemalesTotal 100.00 100.00 100.00Loss or disappearance <strong>of</strong> the job post 5.03 5.49 4.01Reaching retirement age 47.55 48.12 46.26Disease or disability 15.95 15.73 16.44Responsibilities in taking care <strong>of</strong> other<strong>persons</strong>.1.90 0.94 4.04Problems related with the work position 2.47 2.92 1.45Economic incentives or conditions favourablefor retirementPreferred <strong>to</strong> s<strong>to</strong>p working due <strong>to</strong> reasons otherthan the aforementioned6.37 7.26 4.3712.79 11.71 15.22Other reasons 6.35 6.38 6.27Does not know 1.59 1.44 1.941 Unemployed <strong>persons</strong> who s<strong>to</strong>pped working after 49 <strong>years</strong> <strong>of</strong> ageFor further information see INEbase-www.ine.es All press releases at: www.ine.es/prensa/prensa.htmPress <strong>of</strong>fice: Telephone <strong>number</strong>s: 91 583 93 63 / 94 08 – Fax: 91 583 90 87 - gprensa@ine.esInformation area: Telephone: 91 583 91 00 – Fax: 91 583 91 58 – www.ine.es/infoine5


