Percentage of persons aged 50 to 69 , according to number of years ...
Percentage of persons aged 50 to 69 , according to number of years ...
Percentage of persons aged 50 to 69 , according to number of years ...

You also want an ePaper? Increase the reach of your titles
YUMPU automatically turns print PDFs into web optimized ePapers that Google loves.
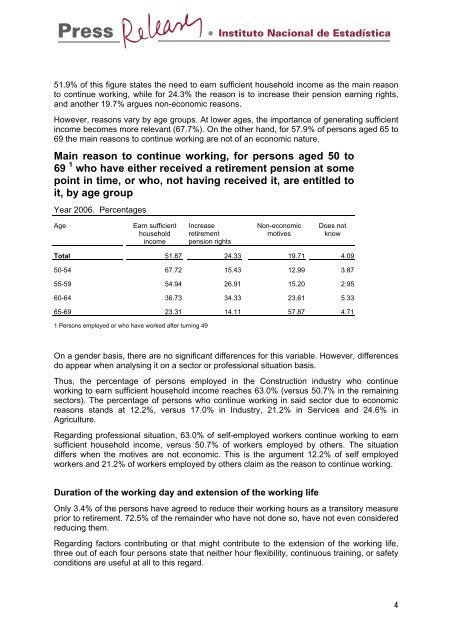
51.9% <strong>of</strong> this figure states the need <strong>to</strong> earn sufficient household income as the main reason<strong>to</strong> continue working, while for 24.3% the reason is <strong>to</strong> increase their pension earning rights,and another 19.7% argues non-economic reasons.However, reasons vary by age groups. At lower ages, the importance <strong>of</strong> generating sufficientincome becomes more relevant (67.7%). On the other hand, for 57.9% <strong>of</strong> <strong>persons</strong> <strong>aged</strong> 65 <strong>to</strong><strong>69</strong> the main reasons <strong>to</strong> continue working are not <strong>of</strong> an economic nature.Main reason <strong>to</strong> continue working, for <strong>persons</strong> <strong>aged</strong> <strong>50</strong> <strong>to</strong><strong>69</strong> 1 who have either received a retirement pension at somepoint in time, or who, not having received it, are entitled <strong>to</strong>it, by age groupYear 2006. <strong>Percentage</strong>sAgeEarn sufficienthouseholdincomeIncreaseretirementpension rightsNon-economicmotivesDoes notknowTotal 51.87 24.33 19.71 4.09<strong>50</strong>-54 67.72 15.43 12.99 3.8755-59 54.94 26.91 15.20 2.9560-64 36.73 34.33 23.61 5.3365-<strong>69</strong> 23.31 14.11 57.87 4.711 Persons employed or who have worked after turning 49On a gender basis, there are no significant differences for this variable. However, differencesdo appear when analysing it on a sec<strong>to</strong>r or pr<strong>of</strong>essional situation basis.Thus, the percentage <strong>of</strong> <strong>persons</strong> employed in the Construction industry who continueworking <strong>to</strong> earn sufficient household income reaches 63.0% (versus <strong>50</strong>.7% in the remainingsec<strong>to</strong>rs). The percentage <strong>of</strong> <strong>persons</strong> who continue working in said sec<strong>to</strong>r due <strong>to</strong> economicreasons stands at 12.2%, versus 17.0% in Industry, 21.2% in Services and 24.6% inAgriculture.Regarding pr<strong>of</strong>essional situation, 63.0% <strong>of</strong> self-employed workers continue working <strong>to</strong> earnsufficient household income, versus <strong>50</strong>.7% <strong>of</strong> workers employed by others. The situationdiffers when the motives are not economic. This is the argument 12.2% <strong>of</strong> self employedworkers and 21.2% <strong>of</strong> workers employed by others claim as the reason <strong>to</strong> continue working.Duration <strong>of</strong> the working day and extension <strong>of</strong> the working lifeOnly 3.4% <strong>of</strong> the <strong>persons</strong> have agreed <strong>to</strong> reduce their working hours as a transi<strong>to</strong>ry measureprior <strong>to</strong> retirement. 72.5% <strong>of</strong> the remainder who have not done so, have not even consideredreducing them.Regarding fac<strong>to</strong>rs contributing or that might contribute <strong>to</strong> the extension <strong>of</strong> the working life,three out <strong>of</strong> each four <strong>persons</strong> state that neither hour flexibility, continuous training, or safetyconditions are useful at all <strong>to</strong> this regard.4