Grupo Concesionario del Oeste - Tulane Burkenroad Reports Latin ...
Grupo Concesionario del Oeste - Tulane Burkenroad Reports Latin ...
Grupo Concesionario del Oeste - Tulane Burkenroad Reports Latin ...

Create successful ePaper yourself
Turn your PDF publications into a flip-book with our unique Google optimized e-Paper software.
<strong>Grupo</strong> <strong>Concesionario</strong> <strong>del</strong> <strong>Oeste</strong> (OEST.BA) BURKENROAD REPORTS LATIN AMERICA 30 de Diciembre de 2009<br />
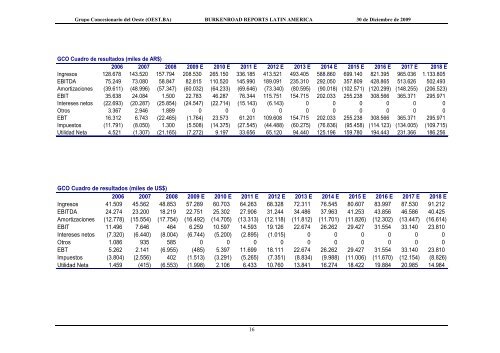
GCO Cuadro de resultados (miles de AR$)<br />
2006 2007 2008 2009 E 2010 E 2011 E 2012 E 2013 E 2014 E 2015 E 2016 E 2017 E 2018 E<br />
Ingresos 128.678 143.520 157.794 208.530 265.150 336.185 413.521 493.405 588.860 699.140 821.395 965.036 1.133.805<br />
EBITDA 75.249 73.080 58.847 82.815 110.520 145.990 189.091 235.310 292.050 357.809 428.865 513.626 502.493<br />
Amortizaciones (39.611) (48.996) (57.347) (60.032) (64.233) (69.646) (73.340) (80.595) (90.018) (102.571) (120.299) (148.255) (206.523)<br />
EBIT 35.638 24.084 1.500 22.783 46.287 76.344 115.751 154.715 202.033 255.238 308.566 365.371 295.971<br />
Intereses netos (22.693) (20.287) (25.854) (24.547) (22.714) (15.143) (6.143) 0 0 0 0 0 0<br />
Otros 3.367 2.946 1.889 0 0 0 0 0 0 0 0 0 0<br />
EBT 16.312 6.743 (22.465) (1.764) 23.573 61.201 109.608 154.715 202.033 255.238 308.566 365.371 295.971<br />
Impuestos (11.791) (8.050) 1.300 (5.508) (14.375) (27.545) (44.488) (60.275) (76.836) (95.458) (114.123) (134.005) (109.715)<br />
Utilidad Neta 4.521 (1.307) (21.165) (7.272) 9.197 33.656 65.120 94.440 125.196 159.780 194.443 231.366 186.256<br />
GCO Cuadro de resultados (miles de US$)<br />
2006 2007 2008 2009 E 2010 E 2011 E 2012 E 2013 E 2014 E 2015 E 2016 E 2017 E 2018 E<br />
Ingresos 41.509 45.562 48.853 57.289 60.703 64.263 68.328 72.311 76.545 80.607 83.997 87.530 91.212<br />
EBITDA 24.274 23.200 18.219 22.751 25.302 27.906 31.244 34.486 37.963 41.253 43.856 46.586 40.425<br />
Amortizaciones (12.778) (15.554) (17.754) (16.492) (14.705) (13.313) (12.118) (11.812) (11.701) (11.826) (12.302) (13.447) (16.614)<br />
EBIT 11.496 7.646 464 6.259 10.597 14.593 19.126 22.674 26.262 29.427 31.554 33.140 23.810<br />
Intereses netos (7.320) (6.440) (8.004) (6.744) (5.200) (2.895) (1.015) 0 0 0 0 0 0<br />
Otros 1.086 935 585 0 0 0 0 0 0 0 0 0 0<br />
EBT 5.262 2.141 (6.955) (485) 5.397 11.699 18.111 22.674 26.262 29.427 31.554 33.140 23.810<br />
Impuestos (3.804) (2.556) 402 (1.513) (3.291) (5.265) (7.351) (8.834) (9.988) (11.006) (11.670) (12.154) (8.826)<br />
Utilidad Neta 1.459 (415) (6.553) (1.998) 2.106 6.433 10.760 13.841 16.274 18.422 19.884 20.985 14.984<br />
16