El Estado de la Responsabilidad Social ... - Compromiso RSE
El Estado de la Responsabilidad Social ... - Compromiso RSE
El Estado de la Responsabilidad Social ... - Compromiso RSE

Create successful ePaper yourself
Turn your PDF publications into a flip-book with our unique Google optimized e-Paper software.
ESTADO DE LA <strong>RSE</strong> 2011 | 1<br />
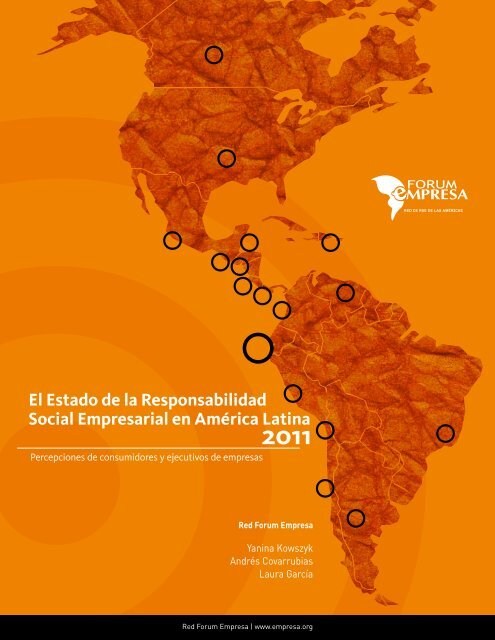
<strong>El</strong> <strong>Estado</strong> <strong>de</strong> <strong>la</strong> <strong>Responsabilidad</strong><br />
<strong>Social</strong> Empresarial en América Latina<br />
2011<br />
Percepciones <strong>de</strong> consumidores y ejecutivos <strong>de</strong> empresas<br />
Red Forum Empresa<br />
Yanina Kowszyk<br />
Andrés Covarrubias<br />
Laura García<br />
Red Forum Empresa | www.empresa.org
ESTADO DE LA <strong>RSE</strong> 2011 | 2<br />
Estudio realizado por Red Forum Empresa<br />
Yanina Kowszyk<br />
Andrés Covarrubias<br />
Laura García<br />
Comité Asesor <strong>de</strong>l Estudio:<br />
• Acción <strong>RSE</strong>, Chile, representado por Alejandro Díaz.<br />
• Deres, Uruguay, representado por Eduardo Shaw.<br />
• Forética, Argentina, representado por Cristián<br />
Pérez y Mónica Calo.<br />
• Fenalco Solidario, Colombia, representado por<br />
Sandra Sierra.<br />
• CERES, Ecuador, representado por Laura Fähndrich<br />
y Fabrice Hansé.<br />
Forum Empresa es una red <strong>de</strong> organizaciones empresariales<br />
que promueve <strong>la</strong> <strong>RSE</strong> en <strong>la</strong>s Américas.<br />
Sobre <strong>la</strong> Red Forum Empresa:<br />
• Cuenta con 21 organizaciones miembro, a través<br />
<strong>de</strong> <strong>la</strong>s cuales congrega a más <strong>de</strong> 3.400 empresas.<br />
• La red reúne a más <strong>de</strong> 400 personas que trabajan<br />
en forma permanente en <strong>la</strong>s instituciones que <strong>la</strong><br />
componen. En conjunto, cuenta con más <strong>de</strong> 200<br />
alianzas internacionales y gracias a sus conferencias,<br />
talleres y seminarios ha sensibilizado a<br />
cerca <strong>de</strong> 20.000 personas en el continente, sobre<br />
temas <strong>de</strong> <strong>RSE</strong>.<br />
• Impulsa proyectos a nivel regional, vincu<strong>la</strong>ndo<br />
esfuerzos nacionales con orientaciones internacionalmente<br />
<strong>de</strong>finidas.<br />
Miembros y Afiliados <strong>de</strong> <strong>la</strong> Red<br />
CANADÁ<br />
ESTADOS UNIDOS<br />
MÉXICO<br />
EL SALVADOR<br />
HONDURAS<br />
PANAMÁ<br />
NICARAGUA<br />
COSTA RICA<br />
VENEZUELA<br />
AFILIADO<br />
ECUADOR<br />
COLOMBIA<br />
AFILIADO<br />
PERÚ<br />
BRASIL<br />
BOLIVIA<br />
PARAGUAY<br />
CHILE<br />
URUGUAY<br />
ARGENTINA<br />
AFILIADOS
ÍNDICE DE CONTENIDOS<br />
Resumen ejecutivo 1<br />
Presentación <strong>de</strong>l estudio 12<br />
Los cuestionarios utilizados<br />
••<br />
Criterios <strong>de</strong> selección <strong>de</strong> ítems 2011<br />
14<br />
14<br />
••¿Cómo interpretar los datos? 18<br />
¿Quiénes son los ejecutivos y consumidores que respondieron<br />
los cuestionarios? 19<br />
••<br />
Características <strong>de</strong> los consumidores 20<br />
••<br />
Características <strong>de</strong> los ejecutivos 21<br />
••<br />
Tamaño <strong>de</strong> <strong>la</strong>s empresas participantes 22<br />
••<br />
Actividad económica 18<br />
<strong>Estado</strong> <strong>de</strong> <strong>la</strong> <strong>RSE</strong> y sus dimensiones 23<br />
••<br />
Nivel <strong>de</strong> <strong>RSE</strong> <strong>de</strong> <strong>la</strong>s empresas participantes según ejecutivos y consumidores 23<br />
••<br />
Nivel <strong>de</strong> <strong>RSE</strong> <strong>de</strong> <strong>la</strong>s empresas <strong>de</strong>ntro y fuera <strong>de</strong>l ranking <strong>de</strong> <strong>la</strong>s 500<br />
más gran<strong>de</strong>s <strong>de</strong> América Latina 26<br />
••<br />
Nivel <strong>de</strong> <strong>RSE</strong> <strong>de</strong> <strong>la</strong>s empresas según actividad económica 27<br />
••<br />
Resultados por dimensión <strong>de</strong> <strong>RSE</strong> 28<br />
••<br />
Brechas <strong>de</strong> percepción sobre <strong>la</strong>s dimensiones <strong>de</strong> <strong>RSE</strong> 29<br />
••<br />
Brechas <strong>de</strong> percepción sobre el nivel <strong>de</strong> <strong>RSE</strong> por país 30<br />
••<br />
Avance en el <strong>de</strong>sempeño <strong>de</strong> <strong>la</strong>s empresas en comparación a 2009 31<br />
Capacidad insta<strong>la</strong>da en <strong>la</strong>s empresas para <strong>la</strong> implementación <strong>de</strong> <strong>la</strong> <strong>RSE</strong> 35<br />
••<br />
Reportes <strong>de</strong> sustentabilidad 35<br />
••<br />
Conocimiento y percepción <strong>de</strong> avance <strong>de</strong> <strong>la</strong> práctica <strong>de</strong> reportar<br />
aspectos <strong>de</strong> <strong>RSE</strong> 38<br />
••<br />
Estrategias o políticas <strong>de</strong> <strong>RSE</strong> 39<br />
••<br />
Estrategias <strong>de</strong> comunicación <strong>de</strong> <strong>RSE</strong> 40<br />
••<br />
Adhesión a estándares internacionales 41<br />
••<br />
Cargo específico <strong>de</strong> <strong>RSE</strong><br />
••<br />
Re<strong>la</strong>ción entre nivel <strong>de</strong> <strong>RSE</strong> y capacidad insta<strong>la</strong>da<br />
42<br />
43<br />
••<br />
Capacidad insta<strong>la</strong>da por país 45<br />
Entorno <strong>la</strong>tinoamericano y avance <strong>de</strong> <strong>la</strong> <strong>RSE</strong> 46<br />
••<br />
Nivel <strong>de</strong> confianza en los sectores <strong>de</strong> <strong>la</strong> sociedad 46<br />
••<br />
Satisfacción <strong>de</strong> ejecutivos y consumidores con <strong>la</strong>s empresas <strong>de</strong> su país 47<br />
••<br />
Preferencia por productos socialmente responsables 48<br />
••<br />
Obstáculos para el avance <strong>de</strong> <strong>la</strong> <strong>RSE</strong> 49<br />
••<br />
Opinión <strong>de</strong> ejecutivos y consumidores sobre el marco legal <strong>de</strong> <strong>la</strong> <strong>RSE</strong>,<br />
<strong>la</strong> regu<strong>la</strong>ción <strong>la</strong>boral y medioambiental 50<br />
Referencias bibliográficas 53<br />
Anexo I: Metodología <strong>de</strong>l estudio<br />
••<br />
Análisis <strong>de</strong> los datos<br />
54<br />
54<br />
••<br />
Limitaciones <strong>de</strong>l estudio 54<br />
••<br />
Cuestionario utilizado para ejecutivos 55<br />
••<br />
Cuestionario utilizado para consumidores 63<br />
••<br />
Pregunta por empresas en el Ranking <strong>de</strong> <strong>la</strong>s 500 compañías<br />
más gran<strong>de</strong>s en América Latina 69<br />
Anexo II: Listado <strong>de</strong> entida<strong>de</strong>s <strong>de</strong> promoción <strong>de</strong> <strong>la</strong> <strong>RSE</strong> en América Latina 72
RESUMEN EJECUTIVO | 1<br />
Resumen Ejecutivo<br />
<strong>El</strong> <strong>Estado</strong> <strong>de</strong> <strong>la</strong> <strong>RSE</strong> 2011 es un<br />
estudio cuantitativo que <strong>de</strong>scribe<br />
<strong>la</strong>s percepciones <strong>de</strong> consumidores<br />
y ejecutivos <strong>de</strong> empresas sobre el<br />
estado <strong>de</strong> <strong>la</strong> <strong>Responsabilidad</strong> <strong>Social</strong><br />
Empresarial (en a<strong>de</strong><strong>la</strong>nte, <strong>RSE</strong>) en<br />
América Latina.<br />
Más <strong>de</strong> 3.200 personas completaron<br />
<strong>la</strong> encuesta. Un total <strong>de</strong> 1.279 ejecutivos<br />
y 1.927 consumidores, <strong>de</strong> 17<br />
países <strong>de</strong> América Latina, respondieron<br />
un cuestionario “online” que<br />
se construyó con <strong>la</strong>s dimensiones<br />
<strong>de</strong> <strong>RSE</strong> y <strong>la</strong>s acciones y expectativas<br />
re<strong>la</strong>cionadas <strong>de</strong> <strong>la</strong> guía ISO 26.000,<br />
que un panel <strong>de</strong> expertos consi<strong>de</strong>ró<br />
como apropiadas y relevantes en<br />
el contexto <strong>la</strong>tinoamericano.<br />
La investigación es impulsada por<br />
<strong>la</strong> Red Forum Empresa que agrupa<br />
21 entida<strong>de</strong>s sin fines <strong>de</strong> lucro que<br />
promueven <strong>la</strong> <strong>RSE</strong> en 18 países <strong>de</strong>l<br />
continente americano, reuniendo<br />
un total <strong>de</strong> 3.400 empresas.<br />
1.279<br />
ejecutivos<br />
completaron <strong>la</strong> encuesta.<br />
1.927<br />
consumidores<br />
completaron <strong>la</strong> encuesta.<br />
Los cuestionarios utilizados indagaron <strong>la</strong> percepción <strong>de</strong><br />
ejecutivos y consumidores sobre los siguientes aspectos:<br />
• Dimensiones <strong>de</strong> <strong>RSE</strong>:<br />
» Toma <strong>de</strong> <strong>de</strong>cisiones y transparencia (incluye prácticas<br />
justas <strong>de</strong> operación).<br />
» Re<strong>la</strong>ción con <strong>la</strong> comunidad.<br />
» Medio ambiente.<br />
» Consumidores o usuarios.<br />
» Re<strong>la</strong>ción con los trabajadores.<br />
• Estrategias <strong>de</strong> difusión <strong>de</strong> información sobre <strong>RSE</strong> <strong>de</strong> <strong>la</strong><br />
empresa.<br />
• Capacidad insta<strong>la</strong>da en <strong>la</strong> empresa para el avance <strong>de</strong> <strong>la</strong><br />
<strong>RSE</strong>.<br />
» Reportes <strong>de</strong> sustentabilidad.<br />
» Adhesión a estándares internacionales.<br />
» Cargo específico sobre <strong>RSE</strong>.<br />
» Adhesión a una entidad promotora <strong>de</strong> <strong>RSE</strong>.<br />
• Ambiente favorable o <strong>de</strong>sfavorable para el <strong>de</strong>sarrollo <strong>de</strong><br />
<strong>la</strong> <strong>RSE</strong>.<br />
» Nivel <strong>de</strong> confianza en los distintos sectores (sólo para<br />
consumidores).<br />
» Opinión sobre <strong>la</strong> legis<strong>la</strong>ción en temas sociales y medioambientales.<br />
» Prácticas <strong>de</strong> consumo responsable (sólo para consumidores).<br />
• Información sobre <strong>la</strong> empresa: actividad económica,<br />
cantidad <strong>de</strong> trabajadores, pertenencia al ranking <strong>de</strong> <strong>la</strong>s<br />
500 más gran<strong>de</strong>s.
RESUMEN EJECUTIVO | 2<br />
Nivel <strong>de</strong> <strong>RSE</strong> <strong>de</strong> <strong>la</strong>s empresas<br />
participantes según ejecutivos<br />
y consumidores: <strong>la</strong> variable “Nivel<br />
<strong>de</strong> <strong>RSE</strong>” es el promedio <strong>de</strong><br />
todos los ítems que componen<br />
<strong>la</strong>s cinco dimensiones <strong>de</strong> <strong>la</strong> <strong>RSE</strong><br />
estudiadas. <strong>El</strong> gráfico N° 1 indica<br />
que los ejecutivos asignaron a <strong>la</strong>s<br />
empresas en <strong>la</strong>s que trabajan un<br />
“Nivel <strong>de</strong> <strong>RSE</strong>” <strong>de</strong>l 73%, mientras<br />
que los consumidores asignaron a<br />
<strong>la</strong>s empresas <strong>de</strong> los países don<strong>de</strong><br />
viven, un 54% en “Nivel <strong>de</strong> <strong>RSE</strong>”.<br />
Al analizar “Nivel <strong>de</strong> <strong>RSE</strong>” según<br />
actividad económica, <strong>la</strong> brecha<br />
<strong>de</strong> 20 puntos se mantiene para<br />
los tres grupos <strong>de</strong> activida<strong>de</strong>s<br />
analizadas: servicios, industria<br />
y comercio.<br />
Nivel <strong>de</strong> <strong>RSE</strong> <strong>de</strong> <strong>la</strong>s empresas<br />
según actividad económica:<br />
tal como lo consigna el gráfico<br />
N° 2, los ejecutivos que mejor<br />
evaluaron a <strong>la</strong>s empresas don<strong>de</strong><br />
trabajan correspon<strong>de</strong>n a los<br />
sectores multi marcas- retail,<br />
agricultura, gana<strong>de</strong>ría y pesca,<br />
construcción y manufacturas.<br />
Los consumidores indicaron que<br />
los sectores económicos más<br />
socialmente responsables <strong>de</strong>s<strong>de</strong><br />
su perspectiva son agricultura,<br />
gana<strong>de</strong>ría y pesca, transporte,<br />
comercio y manufacturas. Un<br />
dato a consi<strong>de</strong>rar es que si bien<br />
el sector <strong>de</strong> <strong>la</strong>s multi marcasretail<br />
está primero en <strong>la</strong> lista<br />
según los ejecutivos, para los<br />
consumidores se encuentra en<br />
el último lugar.<br />
GRÁFICO N° 1<br />
“Nivel <strong>de</strong> <strong>RSE</strong>” según ejecutivos y consumidores<br />
Ejecutivos<br />
73%<br />
Consumidores<br />
54%<br />
GRÁFICO N° 2<br />
Percepción sobre el “Nivel <strong>de</strong> <strong>RSE</strong>” <strong>de</strong> <strong>la</strong>s empresas según actividad económica<br />
Activ. <strong>de</strong> esparcimiento, culturales y <strong>de</strong>portivas<br />
Consumidores<br />
60%<br />
58%<br />
58%<br />
57%<br />
56%<br />
56%<br />
56%<br />
56%<br />
56%<br />
54%<br />
54%<br />
54%<br />
52%<br />
51%<br />
Multi marcas- retail<br />
Agricultura, gana<strong>de</strong>ría, pesca<br />
Construcción<br />
Manufacturas<br />
Agua<br />
Energía<br />
Servicios financieros y bancarios<br />
Turismo, hoteles y restaurantes<br />
Transporte y almacenamiento<br />
Minería<br />
Comercio<br />
Educación, salud, y servicios sociales<br />
Servicios empresariales<br />
Comunicaciones<br />
49% Multi marcas- retail<br />
Agricultura, gana<strong>de</strong>ría, pesca<br />
Transporte y almacenamiento<br />
Comercio<br />
Manufacturas<br />
Comunicaciones<br />
<br />
Minería<br />
<br />
Energía <br />
Construcción<br />
Agua<br />
Servicios empresariales<br />
Servicios financieros y bancarios<br />
Activ. <strong>de</strong> esparcimiento, culturales y <strong>de</strong>portivas<br />
Educación, salud, y servicios sociales<br />
Turismo, hoteles y restaurantes<br />
Ejecutivos<br />
81%<br />
79%<br />
78%<br />
78%<br />
77%<br />
76%<br />
76%<br />
76%<br />
76%<br />
75%<br />
74%<br />
73%<br />
72%<br />
72%<br />
67%
RESUMEN EJECUTIVO | 3<br />
Resultados por dimensión <strong>de</strong> <strong>RSE</strong>:<br />
<strong>la</strong> dimensión “Consumidores y usuarios”<br />
fue <strong>la</strong> mejor evaluada tanto<br />
por ejecutivos como consumidores<br />
en 2011, como lo indica el gráfico<br />
N°3. En segundo lugar, se encuentra<br />
“Re<strong>la</strong>ción con los trabajadores”,<br />
que fue <strong>la</strong> mejor evaluada en 2009.<br />
“Toma <strong>de</strong> <strong>de</strong>cisiones y transparencia”<br />
continúa siendo <strong>la</strong> peor evaluada<br />
<strong>de</strong>s<strong>de</strong> 2009. Sin embargo, este tema<br />
fue el primero en <strong>la</strong> lista cuando<br />
preguntamos a los consumidores:<br />
¿Con qué temas re<strong>la</strong>ciona <strong>la</strong> <strong>RSE</strong>?<br />
-gráfico N° 4.<br />
GRÁFICO N° 3<br />
Dimensiones <strong>de</strong> <strong>RSE</strong> según consumidores y ejecutivos<br />
Ejecutivos 2009<br />
Ejecutivos 2011<br />
Consumidores 2011<br />
Consumidores y usuarios<br />
80%<br />
80%<br />
56%<br />
Re<strong>la</strong>ción con los trabajadores<br />
83%<br />
79%<br />
52%<br />
Re<strong>la</strong>ción con <strong>la</strong> comunidad<br />
78%<br />
73%<br />
54%<br />
Medio ambiente<br />
75%<br />
70%<br />
50%<br />
2009<br />
2011<br />
2011<br />
2009<br />
2011<br />
2011<br />
2009<br />
2011<br />
2011<br />
2009<br />
2011<br />
2011<br />
Toma <strong>de</strong> <strong>de</strong>cisiones y transparencia<br />
64%<br />
69%<br />
55%<br />
2009<br />
2011<br />
2011<br />
GRÁFICO N° 4<br />
¿Con qué temas re<strong>la</strong>ciona <strong>la</strong> <strong>RSE</strong>? Sólo consumidores<br />
30%<br />
Toma <strong>de</strong> <strong>de</strong>cisiones<br />
y transparencia<br />
19%<br />
Re<strong>la</strong>ción con<br />
los trabajadores<br />
17%<br />
Medio ambiente<br />
15%<br />
Re<strong>la</strong>ción con<br />
<strong>la</strong> comunidad<br />
11%<br />
Consumidores<br />
y usuarios
RESUMEN EJECUTIVO | 4<br />
Avance en el <strong>de</strong>sempeño <strong>de</strong> <strong>la</strong>s<br />
empresas en comparación a 2009:<br />
es percepción <strong>de</strong> ejecutivos y consumidores<br />
que <strong>la</strong>s empresas multinacionales<br />
están más avanzadas<br />
que <strong>la</strong>s nacionales en el nivel <strong>de</strong><br />
<strong>RSE</strong>- gráfico N° 6.<br />
No obstante, ejecutivos y consumidores<br />
consi<strong>de</strong>ran en mayor proporción<br />
(72%) que <strong>la</strong>s empresas nacionales<br />
han mejorado en los últimos dos<br />
años, frente a una menor proporción<br />
(64%) <strong>de</strong> quienes consi<strong>de</strong>ran que<br />
<strong>la</strong>s multinacionales han mejorado<br />
<strong>de</strong>s<strong>de</strong> 2009 -gráfico N° 7.<br />
Asimismo, el 55% <strong>de</strong> los consumidores<br />
piensa que <strong>la</strong> implementación<br />
<strong>de</strong> <strong>RSE</strong> por parte <strong>de</strong>l total <strong>de</strong> <strong>la</strong>s<br />
empresas ha mejorado en los dos<br />
últimos años -gráfico N° 5.<br />
GRÁFICO N° 5<br />
¿Cómo consi<strong>de</strong>ra el <strong>de</strong>sempeño <strong>de</strong> <strong>la</strong>s empresas <strong>de</strong> su país en <strong>RSE</strong> a comparación<br />
a dos años atrás? Sólo consumidores<br />
Ha mejorado<br />
55%<br />
GRÁFICO N° 6<br />
Ha empeorado 8%<br />
Se ha mantenido<br />
31%<br />
No contesta<br />
6%<br />
Ud. consi<strong>de</strong>ra que en su país <strong>la</strong>s empresas que más han avanzado en <strong>RSE</strong> son<br />
(percepción <strong>de</strong> ejecutivos y <strong>de</strong> consumidores):<br />
Nacionales<br />
25%<br />
Filiales <strong>de</strong><br />
multinacionales<br />
62%
EJECUTIVO | 5<br />
GRÁFICO N° 7<br />
¿Cómo se han comportado <strong>la</strong>s empresas en los últimos dos años?<br />
Ejecutivos y consumidores<br />
consi<strong>de</strong>ran que <strong>la</strong>s empresas<br />
nacionales<br />
han mejorado en los<br />
últimos dos años<br />
Nacionales<br />
Ha mejorado 72%<br />
23%<br />
Se ha mantenido<br />
Ha empeorado<br />
5%<br />
Filiales <strong>de</strong><br />
Multinacionales<br />
Ha mejorado 64%<br />
29%<br />
Se ha mantenido<br />
Ha empeorado<br />
7%<br />
RESUMEN
RESUMEN EJECUTIVO | 6<br />
Reportes <strong>de</strong> sustentabilidad: existe<br />
un leve aumento entre 2009 y 2011<br />
en el número <strong>de</strong> empresas que<br />
publican reportes <strong>de</strong> sustentabilidad.<br />
En 2011, casi <strong>la</strong> mitad <strong>de</strong> <strong>la</strong>s<br />
empresas que participaron en el<br />
estudio publica su reporte- gráfico<br />
N° 8. <strong>El</strong> 68% <strong>de</strong> los reportes se basa<br />
en <strong>la</strong> metodología GRI - gráfico N°<br />
9- y el 65% incorpora a sus grupos<br />
<strong>de</strong> interés en su e<strong>la</strong>boración y/o<br />
revisión- gráfico N° 10.<br />
GRÁFICO N° 8<br />
¿Su empresa publica reportes <strong>de</strong> sustentabilidad? Comparación con 2009<br />
40% 2009<br />
GRÁFICO N° 9<br />
Empresas que utilizan metodología GRI. Año 2011<br />
47%<br />
2011<br />
68%<br />
Usa GRI<br />
32%<br />
No usa GRI<br />
GRÁFICO N° 10<br />
Empresas que incorporan a sus grupos <strong>de</strong> interés en <strong>la</strong> e<strong>la</strong>boración <strong>de</strong><br />
reportes. Año 2011<br />
65%<br />
Participan<br />
35%<br />
No participan
RESUMEN EJECUTIVO | 7<br />
GRÁFICO N° 11 (a)<br />
¿Cuenta su empresa con una estrategia/ política <strong>de</strong> sustentabilidad o <strong>RSE</strong><br />
escrita y difundida?<br />
Sí 55%<br />
Estrategias o políticas <strong>de</strong> <strong>RSE</strong>:<br />
La mitad <strong>de</strong> <strong>la</strong>s empresas informó<br />
que cuentan con estrategias o políticas<br />
<strong>de</strong> <strong>RSE</strong> escritas y difundidas<br />
- gráfico N°11 (a). Justamente este<br />
grupo <strong>de</strong> empresas son <strong>la</strong>s que<br />
lograron mejores niveles <strong>de</strong> <strong>RSE</strong><br />
que aquel<strong>la</strong>s que no tienen una<br />
política <strong>de</strong>finida - gráfico N° 11 (b).<br />
39% No<br />
NS/NC<br />
6%<br />
GRÁFICO N° 11 (b)<br />
Re<strong>la</strong>ción entre “Nivel <strong>de</strong> <strong>RSE</strong>” y posee o no posee una política <strong>de</strong><br />
sustentabilidad escrita y difundida<br />
Nivel <strong>de</strong> <strong>RSE</strong><br />
85<br />
80<br />
75<br />
70<br />
65<br />
67%<br />
80%<br />
60<br />
No tiene política<br />
<strong>de</strong> sustentabilidad<br />
Tiene política<br />
<strong>de</strong> sustentabilidad
RESUMEN EJECUTIVO | 8<br />
Re<strong>la</strong>ción entre “Nivel <strong>de</strong> <strong>RSE</strong>” y<br />
“Capacidad insta<strong>la</strong>da”: al igual<br />
que en 2009, en <strong>la</strong> versión actual,<br />
se comprobó que <strong>la</strong>s empresas que<br />
tienen más recursos o capacida<strong>de</strong>s<br />
insta<strong>la</strong>das para el avance <strong>de</strong> <strong>la</strong> <strong>RSE</strong><br />
lograron mejores resultados en<br />
su “Nivel <strong>de</strong> <strong>RSE</strong>” - gráfico N° 12.<br />
GRÁFICO N° 12<br />
Re<strong>la</strong>ción entre “Nivel <strong>de</strong> <strong>RSE</strong>” y “Capacidad insta<strong>la</strong>da” en <strong>la</strong> empresa para<br />
implementar <strong>RSE</strong><br />
100<br />
Nivel <strong>de</strong> <strong>RSE</strong><br />
90<br />
80<br />
70<br />
60<br />
50<br />
65%<br />
57%<br />
Ningún<br />
criterio<br />
69%<br />
63%<br />
Al menos<br />
un criterio<br />
76%<br />
69%<br />
Dos<br />
criterios<br />
79%<br />
75%<br />
Tres<br />
criterios<br />
84%<br />
81%<br />
Cuatro<br />
criterios<br />
2009<br />
2011<br />
Capacidad<br />
insta<strong>la</strong>da<br />
Componentes “Capacidad insta<strong>la</strong>da” <strong>de</strong> <strong>la</strong> Empresa:<br />
1. Cuenta con un reporte <strong>de</strong> sostenibilidad.<br />
2. Ha integrado al menos un estándar internacional.<br />
3. Cuenta con un cargo específico <strong>de</strong> <strong>RSE</strong> entre su personal.<br />
4. Adhiere a una entidad promotora <strong>de</strong> <strong>RSE</strong>.<br />
Categorías:<br />
Capacidad no <strong>de</strong>sarrol<strong>la</strong>da: <strong>la</strong> empresa no cuenta con ninguno <strong>de</strong> los componentes<br />
<strong>de</strong> ”Capacidad insta<strong>la</strong>da”.<br />
Capacidad insta<strong>la</strong>da incipiente: <strong>la</strong> empresa ha integrado uno <strong>de</strong> los componentes.<br />
Capacidad insta<strong>la</strong>da intermedia: <strong>la</strong> empresa ha integrado entre 2 y 3 componentes.<br />
Capacidad insta<strong>la</strong>da avanzada: <strong>la</strong> empresa ha integrado los 4 componentes.
Sí<br />
RESUMEN EJECUTIVO | 9<br />
GRÁFICO N° 13<br />
¿Usted preferiría comprar un producto que fue e<strong>la</strong>borado con prácticas sociales<br />
y ambientalmente responsables, aunque tuviera un precio mayor? ¿Cuánto más<br />
estaría dispuesto a pagar?<br />
Preferencia por productos socialmente<br />
responsables: en Latinoamérica<br />
coexiste una actitud<br />
favorable hacia el consumo <strong>de</strong> productos<br />
socialmente responsables,<br />
pero también <strong>la</strong> creencia <strong>de</strong> que<br />
esta actitud no es generalizada o<br />
compartida por los consumidores<br />
<strong>de</strong> <strong>la</strong> región -gráfico N° 13.<br />
Sí<br />
95%<br />
No<br />
5%<br />
Entre un 6%<br />
y un 20%<br />
66%<br />
26% Menos <strong>de</strong>l 5%<br />
Entre 21% y 60% 6%<br />
2% Más <strong>de</strong>l 61%<br />
No<br />
66%
RESUMEN EJECUTIVO | 10<br />
Obstáculos para el avance <strong>de</strong> <strong>la</strong><br />
<strong>RSE</strong>: En cuanto a los obstáculos<br />
para el avance <strong>de</strong> <strong>la</strong> <strong>RSE</strong> en el<br />
continente, el más relevante para<br />
los ejecutivos es <strong>la</strong> actitud pública<br />
hacia <strong>la</strong> <strong>RSE</strong> (Gráfico N° 14),<br />
a diferencia <strong>de</strong> los consumidores<br />
que responsabilizan a <strong>la</strong> falta<br />
<strong>de</strong> confianza en el sector privado<br />
-gráfico N° 15. Sin embargo, en<br />
aspectos más específicos, como<br />
los medioambientales, hay bastante<br />
acuerdo y los dos afirman que <strong>la</strong><br />
regu<strong>la</strong>ción <strong>de</strong>be incrementarse<br />
-gráfico N° 16. En el ámbito <strong>de</strong> <strong>la</strong><br />
legis<strong>la</strong>ción <strong>la</strong>boral, consumidores<br />
y ejecutivos coinci<strong>de</strong>n en que <strong>de</strong>be<br />
aumentar, aún cuando, los consumidores<br />
se muestran mucho más<br />
convencidos sobre esta necesidad<br />
que los ejecutivos -gráfico N° 17.<br />
GRÁFICO N° 14<br />
Principales obstáculos para el avance <strong>de</strong> <strong>la</strong> <strong>RSE</strong> en su país según ejecutivos<br />
Actitud pública<br />
ante <strong>la</strong> <strong>RSE</strong><br />
30%<br />
Régimen impositivo 13%<br />
Ambiente legal 19%<br />
Ejecutivos<br />
23% Falta <strong>de</strong> confianza<br />
en el sector privado<br />
15% Otro<br />
GRÁFICO N° 15<br />
Principales obstáculos para el avance <strong>de</strong> <strong>la</strong> <strong>RSE</strong> según consumidores<br />
Falta <strong>de</strong> confianza<br />
en el sector privado<br />
30%<br />
25% Ambiente legal<br />
Consumidores<br />
Régimen Impositivo 3%<br />
Actitud pública<br />
ante <strong>la</strong> <strong>RSE</strong><br />
18%<br />
24% Otro
RESUMEN EJECUTIVO | 11<br />
GRÁFICO N° 16<br />
Usted cree que <strong>la</strong> regu<strong>la</strong>ción en temas medioambientales en su país <strong>de</strong>be:<br />
83% Incrementarse<br />
92% Incrementarse<br />
Ejecutivos<br />
14% Mantenerse igual<br />
Consumidores<br />
6% Mantenerse igual<br />
2% Disminuir<br />
1% NS/NC<br />
1% Disminuir<br />
1% NS/NC<br />
GRÁFICO N° 17<br />
Usted cree que <strong>la</strong> regu<strong>la</strong>ción en temas <strong>la</strong>borales en su país <strong>de</strong>be:<br />
Incrementarse 51%<br />
27% Mantenerse igual<br />
17% Incrementarse<br />
Ejecutivos<br />
Consumidores<br />
17% Mantenerse igual<br />
3% NS/NC<br />
19% Disminuir<br />
5% NS/NC<br />
7% Disminuir
ESTADO DE LA <strong>RSE</strong> 2011 | 12<br />
Presentación <strong>de</strong>l estudio<br />
Presentamos este estudio sobre<br />
<strong>la</strong> percepción <strong>de</strong> ejecutivos <strong>de</strong> empresas<br />
y consumidores respecto<br />
al estado <strong>de</strong> <strong>la</strong> <strong>Responsabilidad</strong><br />
<strong>Social</strong> Empresarial (<strong>RSE</strong>) en América<br />
Latina. <strong>El</strong> objetivo es entregar<br />
información que sirva como<br />
disparador <strong>de</strong> nuevas reflexiones<br />
y <strong>de</strong>bates sobre el rol <strong>de</strong> <strong>la</strong>s empresas<br />
en <strong>la</strong> región y sobre cómo<br />
estos resultados nos ayudan en <strong>la</strong><br />
tarea <strong>de</strong> seguir avanzando el tema<br />
en el continente.<br />
<strong>El</strong> <strong>Estado</strong> <strong>de</strong> <strong>la</strong> <strong>RSE</strong> 2011 es un<br />
estudio cuantitativo que <strong>de</strong>staca<br />
<strong>la</strong> importancia <strong>de</strong> conocer en qué<br />
dimensiones <strong>de</strong> <strong>la</strong> <strong>RSE</strong> hay mayores<br />
o menores acuerdos sobre el<br />
avance logrado por <strong>la</strong>s empresas<br />
que operan en <strong>la</strong> región. La mirada<br />
<strong>de</strong> los ejecutivos es c<strong>la</strong>ve, ya que<br />
<strong>de</strong> su diagnóstico, <strong>de</strong>pen<strong>de</strong>n los<br />
avances que se propongan lograr<br />
en sus operaciones. Pero <strong>la</strong> perspectiva<br />
<strong>de</strong>l consumidor también<br />
es fundamental, si se consi<strong>de</strong>ra<br />
que en América Latina parece estar<br />
cada vez más educada y más<br />
interesada en ser protagonista <strong>de</strong><br />
lo que acontece en <strong>la</strong> sociedad en<br />
que vive.<br />
Esta es <strong>la</strong> segunda versión <strong>de</strong>l<br />
estudio cuya primera edición tuvo<br />
lugar en 2009. En dicha oportunidad<br />
529 ejecutivos <strong>de</strong> 15 países<br />
respondieron <strong>la</strong> encuesta. Los<br />
resultados motivaron un <strong>de</strong>bate<br />
<strong>de</strong> gran calidad en los foros y seminarios<br />
internacionales don<strong>de</strong><br />
fue presentado. Fue justamente<br />
en estas instancias en <strong>la</strong>s que<br />
se recogió <strong>la</strong> i<strong>de</strong>a <strong>de</strong> incluir <strong>la</strong><br />
perspectiva <strong>de</strong> los consumidores.<br />
<strong>El</strong> estudio 2009 se constituyó en<br />
una experiencia inédita pues no<br />
existía un trabajo con semejante<br />
alcance. Sin embargo, adolecía <strong>de</strong><br />
un sesgo marcado en los resultados:<br />
los ejecutivos opinaban sobre<br />
sus propios logros y el diseño <strong>de</strong><br />
<strong>la</strong> investigación no permitía incluir<br />
otras opiniones. Entonces, surgió<br />
<strong>la</strong> i<strong>de</strong>a <strong>de</strong> incorporar <strong>la</strong> voz <strong>de</strong>l<br />
consumidor como un actor c<strong>la</strong>ve<br />
para <strong>la</strong>s empresas, que con su<br />
experiencia bien pue<strong>de</strong> co<strong>la</strong>borar<br />
a <strong>la</strong> hora <strong>de</strong> analizar cuál es el<br />
estado <strong>de</strong> <strong>la</strong> <strong>RSE</strong> en Latinoamérica.<br />
La investigación es impulsada por<br />
<strong>la</strong> Red Forum Empresa que agrupa<br />
21 entida<strong>de</strong>s sin fines <strong>de</strong> lucro que<br />
promueven <strong>la</strong> <strong>RSE</strong> en 18 países <strong>de</strong>l<br />
continente americano, reuniendo<br />
un total <strong>de</strong> 3.400 empresas. Dos<br />
fortalezas <strong>de</strong> esta red contribuyen<br />
en <strong>la</strong> producción <strong>de</strong> este estudio:<br />
por un <strong>la</strong>do, su amplio alcance que<br />
permite distribuir información (en<br />
este caso, <strong>la</strong> encuesta) a un gran<br />
número <strong>de</strong> empresas y por otro, <strong>la</strong><br />
cultura co<strong>la</strong>borativa que impregna a<br />
<strong>la</strong> red, en <strong>la</strong> cual se unen esfuerzos<br />
locales bajo <strong>la</strong> certeza que el logro<br />
<strong>de</strong> un resultado regional brinda<br />
información importante para todos.
ESTADO DE LA <strong>RSE</strong> 2011 | 13<br />
Propósito general <strong>de</strong>l estudio:<br />
» Describir <strong>la</strong>s percepciones <strong>de</strong> consumidores y ejecutivos<br />
sobre el estado <strong>de</strong> <strong>la</strong> <strong>RSE</strong> en América Latina.<br />
» Brindar información relevante a entida<strong>de</strong>s que están<br />
promoviendo o aplicando estrategias <strong>de</strong> <strong>RSE</strong> para que<br />
sus propuestas puedan anc<strong>la</strong>rse en datos concretos <strong>de</strong><br />
<strong>la</strong> realidad <strong>de</strong> <strong>la</strong> región.<br />
» Aportar con datos cuantitativos el <strong>de</strong>bate sobre <strong>la</strong> ruta<br />
<strong>de</strong> <strong>la</strong> <strong>RSE</strong> en América Latina.<br />
Debido a <strong>la</strong> amplia cobertura <strong>de</strong><br />
<strong>la</strong> red, <strong>la</strong> distribución <strong>de</strong>l cuestionario<br />
entre ejecutivos <strong>de</strong> América<br />
Latina estaba casi asegurada. Sin<br />
embargo, <strong>la</strong> pregunta que surgió<br />
fue cómo acce<strong>de</strong>r a consumidores<br />
dispuestos a completar el cuestionario.<br />
La respuesta a este <strong>de</strong>safío,<br />
una vez más, fue posible gracias a <strong>la</strong><br />
cooperación que distingue a Forum<br />
Empresa. Así, para po<strong>de</strong>r llegar a<br />
los consumidores se estableció<br />
una serie <strong>de</strong> alianzas con medios<br />
<strong>de</strong> comunicación y entida<strong>de</strong>s <strong>de</strong><br />
alcance regional quienes enviaron el<br />
cuestionario a sus bases <strong>de</strong> datos.<br />
Finalmente, más <strong>de</strong> 3.200 personas<br />
completaron <strong>la</strong> encuesta. En concreto,<br />
1.279 respuestas <strong>de</strong> ejecutivos<br />
y 1.927 respuestas <strong>de</strong> consumidores<br />
<strong>de</strong> 17 países <strong>de</strong> América Latina.<br />
GRACIAS A TODOS LOS QUE CO-<br />
LABORARON. Esperamos que los<br />
resultados que encontramos e incluimos<br />
a continuación, los motiven<br />
a <strong>de</strong>batir, reflexionar y a seguir<br />
tomando <strong>la</strong>s <strong>de</strong>cisiones correctas<br />
para hacer <strong>de</strong> América Latina una<br />
región cada vez más ver<strong>de</strong>, menos<br />
pobre y con más negocios.
ESTADO DE LA <strong>RSE</strong> 2011 | 14<br />
Los cuestionarios utilizados<br />
<strong>El</strong> presente estudio toma como<br />
punto <strong>de</strong> partida <strong>la</strong> guía ISO 26.000<br />
para compren<strong>de</strong>r qué es y qué<br />
temas incluye <strong>la</strong> <strong>Responsabilidad</strong><br />
<strong>Social</strong>, a saber: “<strong>Responsabilidad</strong><br />
<strong>de</strong> una organización ante los impactos<br />
que sus <strong>de</strong>cisiones y activida<strong>de</strong>s<br />
ocasionan en <strong>la</strong> sociedad<br />
y el medioambiente, a través <strong>de</strong><br />
un comportamiento transparente<br />
y ético que:<br />
• contribuya al <strong>de</strong>sarrollo sostenible,<br />
incluyendo <strong>la</strong> salud y el<br />
bienestar <strong>de</strong> <strong>la</strong> sociedad;<br />
• tome en consi<strong>de</strong>ración <strong>la</strong>s expectativas<br />
<strong>de</strong> sus partes interesadas;<br />
• cump<strong>la</strong> con <strong>la</strong> legis<strong>la</strong>ción aplicable<br />
y sea coherente con <strong>la</strong> normativa<br />
internacional <strong>de</strong> comportamiento; y<br />
• esté integrada en toda <strong>la</strong> organización<br />
y se lleve a <strong>la</strong> práctica<br />
en sus re<strong>la</strong>ciones.”<br />
La primera versión <strong>de</strong>l cuestionario<br />
que se construyó en 2009<br />
fue e<strong>la</strong>borada consi<strong>de</strong>rando sólo<br />
los temas <strong>de</strong> <strong>la</strong> ISO 26.000 que se<br />
re<strong>la</strong>cionaban con dimensiones <strong>de</strong>finidas<br />
por Forum Empresa durante<br />
<strong>la</strong> ejecución <strong>de</strong>l proyecto “Promoción<br />
<strong>de</strong> <strong>la</strong> <strong>RSE</strong> en <strong>la</strong>s Américas”<br />
(2004-2008), a saber:<br />
• Toma <strong>de</strong> <strong>de</strong>cisiones y transparencia.<br />
• Re<strong>la</strong>ciones con <strong>la</strong> comunidad.<br />
• Medio ambiente.<br />
• Consumidores y/o usuarios.<br />
• Re<strong>la</strong>ción con los trabajadores.<br />
Dichas dimensiones fueron <strong>de</strong>finidas<br />
por los integrantes <strong>de</strong> <strong>la</strong> Red<br />
Forum Empresa como los temas<br />
más relevantes para <strong>la</strong> realidad<br />
<strong>de</strong> América Latina y por ello, se<br />
incluyeron en el cuestionario. A su<br />
vez, cada una <strong>de</strong> estas dimensiones<br />
se completó con ítems que fueron<br />
<strong>de</strong>sarrol<strong>la</strong>dos utilizando <strong>la</strong> sección<br />
<strong>de</strong> “Acciones y expectativas re<strong>la</strong>cionadas”<br />
<strong>de</strong> <strong>la</strong> ISO 26.000, versión<br />
<strong>de</strong> diciembre <strong>de</strong> 2008.<br />
En 2011 con <strong>la</strong> versión <strong>de</strong>finitiva <strong>de</strong><br />
<strong>la</strong> guía ISO 26.000 se actualizó el<br />
cuestionario para ejecutivos. Para<br />
dichos efectos se realizó una revisión<br />
total <strong>de</strong> <strong>la</strong> guía aprobada con<br />
el fin <strong>de</strong> integrar <strong>la</strong> mayor cantidad<br />
<strong>de</strong> aspectos vincu<strong>la</strong>dos a “Acciones<br />
y expectativas re<strong>la</strong>cionadas”. <strong>El</strong><br />
cuestionario para consumidores se<br />
construyó con los mismos ítems que<br />
el cuestionario para ejecutivos, pero<br />
colocando un lenguaje más simple<br />
y excluyendo aquellos aspectos<br />
que hacían referencia a temas <strong>de</strong><br />
<strong>la</strong> gestión interna <strong>de</strong> <strong>la</strong> empresa,<br />
y que por lo tanto, no podrían ser<br />
respondidos por los consumidores.<br />
La inclusión <strong>de</strong> los nuevos ítems<br />
se hizo consi<strong>de</strong>rando los criterios<br />
que se mencionan a continuación:<br />
Criterios <strong>de</strong> selección <strong>de</strong> ítems<br />
2011 (en base a <strong>la</strong> sección “Acciones<br />
y expectativas asociadas<br />
<strong>de</strong> los temas fundamentales” <strong>de</strong><br />
<strong>la</strong> ISO 26.000):
ESTADO DE LA <strong>RSE</strong> 2011 | 15<br />
• Que <strong>la</strong> afirmación especifique<br />
una buena práctica concreta que<br />
<strong>la</strong> empresa pue<strong>de</strong> realizar. No se<br />
incluyen ítems generales, como<br />
por ejemplo:”Usar eficientemente<br />
los recursos financieros, naturales<br />
y humanos; crear un ambiente<br />
que practique los principios <strong>de</strong><br />
<strong>la</strong> <strong>RSE</strong>”.<br />
• Que <strong>la</strong> afirmación tenga re<strong>la</strong>ción<br />
con una buena práctica sustancial<br />
y relevante. No se incluyen<br />
ítems como por ejemplo: “Llevar<br />
el registro <strong>de</strong> <strong>la</strong>s <strong>de</strong>cisiones tomadas;<br />
revisar frecuentemente<br />
los procesos <strong>de</strong> gobernanza”.<br />
• Que <strong>la</strong> afirmación sea pertinente a<br />
una empresa privada, y no refiera<br />
a otro tipo <strong>de</strong> organizaciones que<br />
se incluyen en <strong>la</strong> guía.<br />
• Que <strong>la</strong> afirmación tenga una terminología<br />
y haga referencia a<br />
una acción que sea común para<br />
interlocutores <strong>de</strong> América Latina.<br />
Estos ítems se validan a través<br />
<strong>de</strong>l panel <strong>de</strong> expertos.<br />
• Que <strong>la</strong> afirmación sea factible <strong>de</strong><br />
cuantificar, y por lo tanto, pueda<br />
ser incluida en un estudio cuantitativo.<br />
• Que <strong>la</strong> afirmación no sólo refleje<br />
una acción <strong>de</strong>seada. No se incluyen<br />
ítems que enuncien juicios<br />
<strong>de</strong> valor, como por ejemplo: “La<br />
organización <strong>de</strong>bería”.<br />
• Que <strong>la</strong> afirmación no esté incluida<br />
en otras afirmaciones más amplias.<br />
Por ejemplo, “Proporciona<br />
condiciones favorables para <strong>la</strong><br />
libertad <strong>de</strong> asociación y <strong>la</strong> negociación<br />
colectiva <strong>de</strong> los trabajadores”<br />
contiene a <strong>la</strong> afirmación:<br />
“No obstruir a los trabajadores<br />
que busquen formar sus propias<br />
organizaciones o unirse a negociar<br />
colectivamente”.<br />
• Que <strong>la</strong> afirmación no haga referencia<br />
a aspectos regu<strong>la</strong>dos por<br />
ley y que son obligatorios.<br />
• En el caso <strong>de</strong>l cuestionario para<br />
consumidores, también se excluyen<br />
todas <strong>la</strong>s afirmaciones que<br />
por su complejidad requerían<br />
un mayor conocimiento sobre<br />
<strong>la</strong>s operaciones internas <strong>de</strong> <strong>la</strong>s<br />
empresas, y que, por lo tanto, hacen<br />
necesaria mayor información<br />
que aquel<strong>la</strong> que el consumidor<br />
tiene. Por ejemplo: “Cuentan con<br />
criterios formales para <strong>de</strong>finir <strong>la</strong><br />
financiación o apoyo a candidatos<br />
políticos.”<br />
La medición se realizó por medio<br />
<strong>de</strong> variables dicotómicas (SÍ- NO-<br />
NS/NC), variables categóricas (<strong>de</strong><br />
respuesta única y múltiple) y variables<br />
ordinales o <strong>de</strong> esca<strong>la</strong>. Para<br />
obtener información acerca <strong>de</strong>l<br />
nivel o puntaje alcanzado <strong>de</strong> <strong>RSE</strong><br />
se utilizaron esca<strong>la</strong>s likert <strong>de</strong> 5<br />
categorías. A modo <strong>de</strong> ejemplo,<br />
para cuantificar <strong>la</strong> dimensión “Toma
ESTADO DE LA <strong>RSE</strong> 2011 | 16<br />
1. Mas información en http://rankings.<br />
americaeconomia.com/2010/500/<br />
<strong>de</strong> <strong>de</strong>cisiones y transparencia” se<br />
presentó a los encuestados una<br />
serie <strong>de</strong> ítems re<strong>la</strong>cionados con 5<br />
posibilida<strong>de</strong>s <strong>de</strong> respuesta (Muy en<br />
<strong>de</strong>sacuerdo / En <strong>de</strong>sacuerdo/ Ni<br />
en acuerdo ni en <strong>de</strong>sacuerdo / De<br />
acuerdo / Totalmente <strong>de</strong> acuerdo<br />
/ NS/NC), entre otros: “Esta empresa…:<br />
incluye a representantes<br />
sindicales en su junta o consejo<br />
directivo, implementa un procedimiento<br />
anónimo <strong>de</strong> <strong>de</strong>nuncia <strong>de</strong> <strong>la</strong><br />
corrupción y los sobornos, cuenta<br />
con criterios formales para <strong>de</strong>finir<br />
<strong>la</strong> financiación o apoyo a candidatos<br />
políticos, etc”.<br />
Algunos ítems <strong>de</strong> <strong>la</strong> dimensión<br />
“Re<strong>la</strong>ciones con <strong>la</strong> comunidad”<br />
son: “Esta empresa…: realiza inversiones<br />
para contribuir al <strong>de</strong>sarrollo<br />
económico y social <strong>de</strong> <strong>la</strong>s<br />
comunida<strong>de</strong>s don<strong>de</strong> opera, invita<br />
a <strong>la</strong> comunidad a participar en el<br />
diseño e implementación <strong>de</strong> los<br />
proyectos <strong>de</strong> inversión social, participa<br />
en activida<strong>de</strong>s que mejoren<br />
<strong>la</strong> calidad <strong>de</strong> <strong>la</strong> educación en <strong>la</strong><br />
comunidad, entre otros”.<br />
Es importante consi<strong>de</strong>rar que para<br />
<strong>la</strong> validación <strong>de</strong> <strong>de</strong> los dos cuestionarios<br />
se utilizó a un panel <strong>de</strong><br />
expertos internacionales que realizaron<br />
sugerencias para ambos<br />
instrumentos. A través <strong>de</strong> esta<br />
vía, se insertaron preguntas que<br />
no estaban en <strong>la</strong> ISO 26.000 pero<br />
que el panel consi<strong>de</strong>ró <strong>de</strong> interés,<br />
por ejemplo, <strong>la</strong>s preguntas sobre<br />
nivel <strong>de</strong> confianza en los sectores<br />
y opinión sobre <strong>la</strong> legis<strong>la</strong>ción <strong>de</strong><br />
los países. Asimismo, una sugerencia<br />
por parte <strong>de</strong>l panel fue <strong>la</strong><br />
inclusión <strong>de</strong> un ítem que permitiera<br />
distinguir el “Nivel <strong>de</strong> <strong>RSE</strong>” <strong>de</strong>l<br />
total <strong>de</strong> empresas participantes<br />
<strong>de</strong> aquel<strong>la</strong>s incluidas en el ranking<br />
<strong>de</strong> <strong>la</strong>s 500 empresas más gran<strong>de</strong>s<br />
<strong>de</strong> América Latina, publicado en<br />
2011 por América Economía¹. De<br />
esta forma, en los resultados se<br />
pue<strong>de</strong>n encontrar algunas comparaciones,<br />
aún cuando son pocas<br />
<strong>la</strong>s empresas que indicaron haber<br />
sido mencionadas en dicho ranking.<br />
<strong>El</strong> listado <strong>de</strong> estas empresas por<br />
país se encuentra en <strong>la</strong> sección<br />
<strong>de</strong>l Anexo Metodológico.<br />
<strong>El</strong> panel <strong>de</strong> expertos se conformó<br />
con los representantes <strong>de</strong> los<br />
miembros <strong>de</strong>l Comité Asesor <strong>de</strong>l<br />
Estudio y <strong>de</strong> <strong>la</strong>s Entida<strong>de</strong>s Adherentes<br />
al estudio.<br />
En síntesis, los cuestionarios incluyen<br />
los siguientes aspectos:<br />
• Dimensiones <strong>de</strong> <strong>RSE</strong>:<br />
» Toma <strong>de</strong> <strong>de</strong>cisiones y transparencia<br />
(incluye prácticas justas<br />
<strong>de</strong> operación).<br />
» Re<strong>la</strong>ción con <strong>la</strong> comunidad.<br />
» Medio ambiente.<br />
» Consumidores o usuarios.<br />
» Re<strong>la</strong>ción con los trabajadores.<br />
• Estrategias <strong>de</strong> difusión <strong>de</strong> información<br />
sobre <strong>la</strong> <strong>RSE</strong> <strong>de</strong> <strong>la</strong> empresa.
ESTADO DE LA <strong>RSE</strong> 2011 | 17<br />
• Capacidad insta<strong>la</strong>da en <strong>la</strong> empresa<br />
para el avance <strong>de</strong> <strong>la</strong> <strong>RSE</strong>.<br />
» Reportes <strong>de</strong> sostenibilidad.<br />
» Adhesión a estándares internacionales.<br />
» Cargo específico sobre <strong>RSE</strong>.<br />
» Adhesión a una entidad promotora<br />
<strong>de</strong> <strong>RSE</strong>.<br />
» Entorno Latinoamericano y<br />
conocimiento sobre <strong>RSE</strong>. Nivel<br />
<strong>de</strong> confianza en los distintos<br />
sectores (sólo para consumidores).<br />
» Opinión sobre <strong>la</strong> legis<strong>la</strong>ción<br />
en temas sociales y medioambientales.<br />
• Prácticas <strong>de</strong> consumo responsable<br />
(sólo para consumidores).<br />
• Información sobre <strong>la</strong> empresa:<br />
actividad económica, cantidad<br />
<strong>de</strong> trabajadores, pertenencia al<br />
ranking <strong>de</strong> <strong>la</strong>s 500 más gran<strong>de</strong>s.<br />
La distribución <strong>de</strong> los cuestionarios<br />
se realizó por email con un link<br />
a <strong>la</strong> p<strong>la</strong>taforma <strong>de</strong> internet “surveymonkey”<br />
que alojó versiones<br />
en español y en portugués <strong>de</strong> <strong>la</strong>s<br />
encuestas para ejecutivos y consumidores.<br />
La invitación a participar<br />
<strong>de</strong>l estudio se envió tanto a <strong>la</strong>s<br />
entida<strong>de</strong>s y empresas miembro <strong>de</strong><br />
<strong>la</strong> red, como a los medios <strong>de</strong> comunicación<br />
aliados e instituciones<br />
adherentes. Todos ellos reenviaron<br />
<strong>la</strong> convocatoria a sus respectivas<br />
bases <strong>de</strong> datos.<br />
Para conocer los cuestionarios utilizados, por favor consulte el Anexo<br />
Anexo I: Metodología <strong>de</strong>l estudio (página 49).
ESTADO DE LA <strong>RSE</strong> 2011 | 18<br />
Ficha técnica <strong>de</strong>l estudio<br />
Metodología<br />
Cuantitativa<br />
Diseño <strong>de</strong>l estudio<br />
No experimental, corre<strong>la</strong>cional - longitudinal<br />
Ámbito geográfico<br />
17 países <strong>de</strong> América Latina<br />
Técnica <strong>de</strong> recolección <strong>de</strong> datos Encuesta auto aplicada vía internet<br />
Pob<strong>la</strong>ción<br />
Ejecutivos <strong>de</strong> empresas y consumidores <strong>de</strong> América Latina<br />
Fecha <strong>de</strong> recolección <strong>de</strong> datos Des<strong>de</strong> el 1 <strong>de</strong> agosto al 15 <strong>de</strong> septiembre <strong>de</strong> 2011<br />
Técnica <strong>de</strong> muestreo<br />
No probabilística por accesibilidad<br />
Muestra<br />
3.206 casos: 1.279 ejecutivos y 1.927 consumidores<br />
¿Cómo interpretar los datos? Un<br />
aspecto c<strong>la</strong>ve para <strong>la</strong> interpretación<br />
<strong>de</strong> los datos es advertir que <strong>la</strong> técnica<br />
<strong>de</strong> muestreo es no probabilística<br />
por conveniencia, con lo cual,<br />
los resultados reflejan <strong>la</strong> mirada<br />
<strong>de</strong> ejecutivos y consumidores que<br />
completaron los cuestionarios.<br />
Por lo tanto, <strong>la</strong> extrapo<strong>la</strong>ción <strong>de</strong><br />
los datos al conjunto <strong>de</strong> empresas<br />
<strong>de</strong> Latinoamérica <strong>de</strong>be realizarse<br />
con caute<strong>la</strong>.<br />
Por otra parte, este estudio es <strong>de</strong><br />
percepción. Visitar a <strong>la</strong>s empresas<br />
<strong>de</strong> <strong>la</strong> región para constatar el nivel<br />
<strong>de</strong> avance <strong>de</strong> cada una <strong>de</strong> el<strong>la</strong>s<br />
resultaría una tarea imposible y<br />
poco eficiente en términos <strong>de</strong> costo<br />
- beneficio. Otras alternativas, como<br />
<strong>la</strong> revisión <strong>de</strong> los reportes <strong>de</strong> sustentabilidad<br />
implicarían un estudio<br />
<strong>de</strong> menor alcance. De este modo,<br />
cuando nos p<strong>la</strong>nteamos <strong>de</strong>scribir<br />
el estado <strong>de</strong> <strong>la</strong> <strong>RSE</strong> en América<br />
Latina, por el momento, contamos<br />
con <strong>la</strong>s percepciones <strong>de</strong> ejecutivos<br />
y consumidores, confiando en que<br />
ambos grupos respondieron con<br />
datos objetivos pero entendiendo,<br />
a <strong>la</strong> vez, que sus <strong>de</strong>seos y aspiraciones<br />
pue<strong>de</strong>n haber influido en<br />
sus respuestas y por lo tanto, en<br />
los resultados <strong>de</strong> este estudio.
ESTADO DE LA <strong>RSE</strong> 2011 | 19<br />
¿Quiénes son los ejecutivos y consumidores<br />
que respondieron los cuestionarios?<br />
La cantidad total <strong>de</strong> ejecutivos y consumidores que respondieron esta<br />
encuesta por país se encuentra a continuación:<br />
N° País Ejecutivos/Total Consumidores/Total<br />
1 Argentina 254 450<br />
2 Bolivia 11 25<br />
3 Brasil 54 79<br />
4 Chile 112 136<br />
5 Colombia 192 435<br />
6 Costa Rica 101 71<br />
7 Ecuador 56 51<br />
8 <strong>El</strong> Salvador 24 45<br />
9 Honduras 47 30<br />
10 México 125 248<br />
11 Nicaragua 15 29<br />
12 Panamá 23 15<br />
13 Paraguay 41 47<br />
14 Perú 77 115<br />
15 Puerto Rico 0 4<br />
16 Uruguay 66 67<br />
17 Venezue<strong>la</strong> 57 65<br />
18 Otro 24 15<br />
TOTAL 1279 1927<br />
3.200 personas completaron <strong>la</strong> encuesta
ESTADO DE LA <strong>RSE</strong> 2011 | 20<br />
GRÁFICO N° 1<br />
En el mundo empresarial, hoy se suele utilizar el término “<strong>Responsabilidad</strong><br />
<strong>Social</strong> Empresarial” (o “<strong>Responsabilidad</strong> <strong>Social</strong> Corporativa”), ¿Ha oído alguna<br />
vez esta expresión?<br />
3%<br />
Lo ha oído mencionar,<br />
pero no sabe su significado<br />
71%<br />
Sabe lo que significa<br />
9%<br />
Intuye lo que significa<br />
2%<br />
No sabe,<br />
no lo ha oído mencionar<br />
Características <strong>de</strong> los consumidores:<br />
En el cuestionario para consumidores<br />
se indicó: “Ud. respon<strong>de</strong><br />
como consumidor <strong>de</strong> productos y<br />
servicios que se ven<strong>de</strong>n en América<br />
Latina”. En este punto cabe resaltar<br />
que el 70% dijo saber qué significa <strong>la</strong><br />
<strong>RSE</strong>, por lo tanto, el estudio refleja<br />
<strong>la</strong> opinión <strong>de</strong> consumidores que<br />
están formados en el tema- gráfico<br />
N° 1. Asimismo, es posible ver en el<br />
gráfico N° 2, que el 31% pertenece<br />
a <strong>la</strong> aca<strong>de</strong>mia y el 25% se <strong>de</strong>fine<br />
como ciudadano sin i<strong>de</strong>ntificarse<br />
con otro sector o categoría.<br />
GRÁFICO N° 2<br />
¿Cuál <strong>de</strong> <strong>la</strong>s siguientes categorías <strong>de</strong>scribe mejor el sector al que usted<br />
pertenece?<br />
25% Ciudadano<br />
Aca<strong>de</strong>mia 32%<br />
16%<br />
Organización sin<br />
fines <strong>de</strong> lucro<br />
Otro 5%<br />
6% Gobierno<br />
16% Profesionales<br />
y prestadores<br />
<strong>de</strong> servicios*<br />
* Dentro <strong>de</strong> <strong>la</strong> categoría ”Profesionales y<br />
prestadores <strong>de</strong> servicios” se incluyen a<br />
consultores, periodistas, abogados, etc.
ESTADO DE LA <strong>RSE</strong> 2011 | 21<br />
Características <strong>de</strong> los ejecutivos:<br />
En el caso <strong>de</strong>l cuestionario para ejecutivos<br />
se incluyó una introducción<br />
que indicaba: Pue<strong>de</strong>n respon<strong>de</strong>r<br />
empresas <strong>de</strong> todos los tamaños,<br />
industrias y niveles <strong>de</strong> <strong>RSE</strong>:<br />
• Respon<strong>de</strong> una persona por empresa,<br />
cada empresa <strong>de</strong>ci<strong>de</strong> quien<br />
respon<strong>de</strong>. La encuesta reconoce<br />
el IP <strong>de</strong> su computador.<br />
• En el caso <strong>de</strong> multinacionales,<br />
el ejecutivo respon<strong>de</strong> por <strong>la</strong> filial<br />
<strong>de</strong> su país.<br />
• En caso <strong>de</strong> empresas con más<br />
<strong>de</strong> una operación / unidad <strong>de</strong><br />
negocios en un país, respon<strong>de</strong><br />
un ejecutivo por cada operación /<br />
unidad <strong>de</strong> negocio <strong>de</strong> <strong>la</strong> empresa.<br />
GRÁFICO N° 3<br />
¿Qué cargo ocupa Ud. <strong>de</strong>ntro <strong>de</strong> su empresa?<br />
Jefe <strong>de</strong> unidad o división<br />
Gerente <strong>de</strong> área<br />
GRÁFICO N° 4<br />
33%<br />
25%<br />
15%<br />
Gerente general<br />
7%<br />
Profesional o técnico<br />
4% Otro<br />
¿Cuánto tiempo ha estado vincu<strong>la</strong>do o estudiando temas <strong>de</strong> <strong>RSE</strong>?<br />
4% Responsable <strong>de</strong> <strong>RSE</strong><br />
en <strong>la</strong> empresa<br />
13% Miembro <strong>de</strong>l consejo<br />
o junta directiva<br />
Como resultado <strong>de</strong>l estudio, interesa<br />
<strong>de</strong>stacar algunas características<br />
<strong>de</strong> los ejecutivos que respondieron<br />
<strong>la</strong> encuesta. Como se advierte en<br />
el gráfico N° 3, <strong>la</strong> mayoría <strong>de</strong> los<br />
ejecutivos que respondieron <strong>la</strong><br />
encuesta son gerentes <strong>de</strong> área o<br />
jefes <strong>de</strong> unidad y tienen entre 5 y<br />
10 años <strong>de</strong> vincu<strong>la</strong>ción con el tema<br />
<strong>de</strong> <strong>la</strong> <strong>RSE</strong>- gráfico N° 4.<br />
1 a 2 años<br />
21%<br />
40%<br />
5 a 10 años<br />
25% 3 a 4 años<br />
Sin experiencia<br />
3%<br />
11%<br />
Menos <strong>de</strong> 1 año
ESTADO DE LA <strong>RSE</strong> 2011 | 22<br />
GRÁFICO N°5<br />
Cantidad <strong>de</strong> trabajadores <strong>de</strong> su empresa.<br />
La c<strong>la</strong>sificación incluyó:<br />
Empresas Gran<strong>de</strong>s: Más <strong>de</strong> 500 trabajadores<br />
Medianas: entre 51 y 500 trabajadores<br />
Pequeñas: Menos <strong>de</strong> 50 trabajadores.<br />
Tamaño <strong>de</strong> <strong>la</strong>s empresas participantes:<br />
Las empresas participantes<br />
correspon<strong>de</strong>n a compañías <strong>de</strong> diversos<br />
tamaños, conformando una<br />
muestra ba<strong>la</strong>nceada <strong>de</strong> empresas<br />
gran<strong>de</strong>s, medianas y pequeñasgráfico<br />
N° 5.<br />
39% Gran<strong>de</strong> 31% Mediana<br />
30% Pequeña
ESTADO DE LA <strong>RSE</strong> 2011 | 23<br />
Actividad económica <strong>de</strong> <strong>la</strong>s empresas<br />
<strong>de</strong>l estudio: Las activida<strong>de</strong>s<br />
económicas incluidas en el estudio<br />
fueron organizadas según <strong>la</strong> C<strong>la</strong>sificación<br />
Internacional Industrial<br />
Uniforme CIIU², y luego agrupadas<br />
en 3 categorías para facilitar el<br />
análisis <strong>de</strong> <strong>la</strong> información.<br />
Industria<br />
Servicios<br />
Comercio<br />
Construcción<br />
Energía (electricidad, gas, y petróleo)<br />
Minería<br />
Transporte y almacenamiento<br />
Sanitarias<br />
Activida<strong>de</strong>s <strong>de</strong> esparcimiento y activida<strong>de</strong>s culturales<br />
y <strong>de</strong>portivas<br />
Comunicaciones<br />
Educación, salud, y servicios sociales<br />
Servicios empresariales (seguros, asesoramientos)<br />
Servicios financieros y bancarios<br />
Turismo, hoteles y restaurantes<br />
Agricultura, gana<strong>de</strong>ría, pesca<br />
Comercio<br />
Manufacturas (alimenticios y bebidas, tabaco, textiles,<br />
cueros, papel, químicos, plástico, maquinaria, aparatos<br />
eléctricos, vehículos, recic<strong>la</strong>je)<br />
Multi marcas- retail<br />
2. Más información sobre <strong>la</strong> c<strong>la</strong>sificación en:<br />
http://unstats.un.org/unsd/cr/registry/regcst.asp?cl=2&lg=3
ESTADO DE LA <strong>RSE</strong> 2011 | 24<br />
A continuación se pue<strong>de</strong> ver <strong>la</strong><br />
distribución <strong>de</strong> <strong>la</strong>s empresas participantes<br />
en el estudio según actividad<br />
económica. <strong>El</strong> gráfico N° 6<br />
muestra una mayoría <strong>de</strong> empresas<br />
<strong>de</strong>l sector servicios, comercio y<br />
un porcentaje más bajo <strong>de</strong>l sector<br />
industria. En servicios, <strong>la</strong> mayoría<br />
<strong>de</strong> <strong>la</strong>s empresas son <strong>de</strong>l rubro<br />
educación, salud, servicios sociales,<br />
y servicios empresariales<br />
(consultores, etc). En el grupo <strong>de</strong><br />
empresas <strong>de</strong> comercio, <strong>la</strong> mayoría<br />
<strong>de</strong> son manufacturas- gráfico N° 7.<br />
La distribución porcentual <strong>de</strong> <strong>la</strong>s<br />
empresas en <strong>la</strong>s <strong>de</strong>más activida<strong>de</strong>s<br />
fue simi<strong>la</strong>r.<br />
GRÁFICO N°6<br />
Principal actividad económica <strong>de</strong> <strong>la</strong> empresa ( agrupada).<br />
28% Comercio<br />
Servicio 42%<br />
18% Industria<br />
12% Otro<br />
GRÁFICO N°7<br />
Principal actividad económica <strong>de</strong> <strong>la</strong> empresa.<br />
Educación, salud y servicios sociales<br />
Servicios empresariales<br />
Servicios financieros y bancarios<br />
Comunicaciones<br />
Turismo, hoteles, restaurantes<br />
Activida<strong>de</strong>s <strong>de</strong> esparcimiento, culturales y <strong>de</strong>portivas<br />
Manufacturas<br />
Comercio<br />
Agricultura, gana<strong>de</strong>ría y pesca<br />
Multimarcas - retail<br />
Energía<br />
Construcción<br />
Minería<br />
Transporte y almacenamiento<br />
Agua<br />
Otra<br />
14%<br />
13%<br />
7%<br />
6%<br />
2%<br />
1%<br />
15%<br />
7%<br />
4%<br />
2%<br />
7%<br />
5%<br />
3%<br />
3%<br />
1%<br />
12%<br />
Industria Comercio Otra<br />
Servicio
ESTADO DE LA <strong>RSE</strong> 2011 | 25<br />
<strong>Estado</strong> <strong>de</strong> <strong>la</strong> <strong>RSE</strong> y sus Dimensiones<br />
Nivel <strong>de</strong> <strong>RSE</strong> <strong>de</strong> <strong>la</strong>s empresas<br />
participantes según ejecutivos y<br />
consumidores: <strong>El</strong> “Nivel <strong>de</strong> <strong>RSE</strong>”<br />
es una variable construida por el<br />
promedio <strong>de</strong> los promedios <strong>de</strong> <strong>la</strong>s<br />
dimensiones <strong>de</strong> <strong>RSE</strong> analizadas.<br />
Como se pue<strong>de</strong> advertir en el gráfico<br />
N° 8, existe una gran diferencia <strong>de</strong><br />
percepción entre los consumidores<br />
y los ejecutivos. Los ejecutivos<br />
asignan a sus propias empresas<br />
un puntaje <strong>de</strong> 73% mientras los<br />
consumidores les asignan 53%. Con<br />
re<strong>la</strong>ción al “Nivel <strong>de</strong> <strong>RSE</strong>” según<br />
ejecutivos <strong>de</strong>l año 2009 (75%) se<br />
pue<strong>de</strong> advertir una leve disminución<br />
en 2011 (73%), que podría<br />
interpretarse como un aumento<br />
en <strong>la</strong> capacidad <strong>de</strong> autocrítica <strong>de</strong>l<br />
sector- gráfico N° 9.<br />
GRÁFICO N° 8<br />
“Nivel <strong>de</strong> <strong>RSE</strong>” según ejecutivos y consumidores.<br />
Ejecutivos<br />
73%<br />
Consumidores<br />
54%<br />
GRÁFICO N° 9<br />
Comparación <strong>de</strong> ”Nivel <strong>de</strong> <strong>RSE</strong>” año 2009 y 2011. Sólo Ejecutivos.<br />
75% 2009<br />
73%<br />
2011
ESTADO DE LA <strong>RSE</strong> 2011 | 26<br />
GRÁFICO N° 10<br />
“Nivel <strong>de</strong> <strong>RSE</strong>” <strong>de</strong> empresas <strong>de</strong>ntro y fuera <strong>de</strong>l ranking <strong>de</strong> <strong>la</strong>s 500 más<br />
gran<strong>de</strong>s <strong>de</strong> América Latina.<br />
Dentro <strong>de</strong>l Ranking<br />
Fuera <strong>de</strong>l Ranking<br />
Brecha <strong>de</strong> percepción entre ambos<br />
Panamá<br />
84% 15%<br />
69%<br />
Colombia<br />
85% 13%<br />
72%<br />
Argentina<br />
84% 11%<br />
73%<br />
México<br />
81% 7%<br />
74%<br />
Chile<br />
71%<br />
66%<br />
5%<br />
Nivel <strong>de</strong> <strong>RSE</strong> <strong>de</strong> <strong>la</strong>s empresas <strong>de</strong>ntro<br />
y fuera <strong>de</strong>l ranking <strong>de</strong> <strong>la</strong>s 500<br />
más gran<strong>de</strong>s <strong>de</strong> América Latina: <strong>El</strong><br />
gráfico N°10, muestra diferencias<br />
en el “Nivel <strong>de</strong> <strong>RSE</strong>” alcanzado por<br />
<strong>la</strong>s empresas <strong>de</strong>ntro y fuera <strong>de</strong>l<br />
ranking <strong>de</strong> <strong>la</strong>s 500 más gran<strong>de</strong>s<br />
<strong>de</strong> <strong>la</strong> región, según América Economía.<br />
Se encontraron diferencias<br />
<strong>de</strong> 15 puntos (en una esca<strong>la</strong> <strong>de</strong> 0 a<br />
100) en Panamá, 13 puntos en el<br />
caso <strong>de</strong> Colombia, 11 puntos en el<br />
caso <strong>de</strong> Argentina, y puntajes más<br />
bajos para México y Chile. Estas<br />
diferencias dan a enten<strong>de</strong>r que<br />
los ejecutivos <strong>de</strong> <strong>la</strong>s empresas que<br />
se encuentran <strong>de</strong>ntro <strong>de</strong>l ranking<br />
poseen un grado <strong>de</strong> acuerdo más<br />
alto (es <strong>de</strong>cir, una percepción más<br />
favorable) acerca <strong>de</strong>l “Nivel <strong>de</strong> <strong>RSE</strong>”<br />
en sus empresas, en comparación<br />
con los ejecutivos <strong>de</strong> <strong>la</strong>s <strong>de</strong>más<br />
empresas.
ESTADO DE LA <strong>RSE</strong> 2011 | 27<br />
Nivel <strong>de</strong> <strong>RSE</strong> <strong>de</strong> <strong>la</strong>s empresas<br />
según actividad económica: Como<br />
se advierte en el gráfico N° 11,<br />
<strong>la</strong> percepción sobre el “Nivel <strong>de</strong><br />
<strong>RSE</strong>” en <strong>la</strong>s empresas <strong>de</strong> los tres<br />
grupos <strong>de</strong> activida<strong>de</strong>s es bastante<br />
simi<strong>la</strong>r en los años 2009 y 2011<br />
según <strong>la</strong> mirada <strong>de</strong> los ejecutivos.<br />
La diferencia más interesante<br />
se produce cuando se comparan<br />
estas visiones con <strong>la</strong> perspectiva<br />
<strong>de</strong>l consumidor, don<strong>de</strong> se producen<br />
brechas <strong>de</strong> 20 puntos <strong>de</strong> diferencia<br />
en los tres sectores: servicios,<br />
comercio e industria.<br />
GRÁFICO N° 11<br />
“Nivel <strong>de</strong> <strong>RSE</strong>” por actividad económica.<br />
Ejecutivos 2009<br />
Ejecutivos 2011<br />
Consumidores 2011<br />
Industria<br />
77% 2009<br />
76%<br />
56% 2009<br />
2011<br />
2011<br />
Comercio<br />
75%<br />
77%<br />
57%<br />
2009<br />
2011<br />
2011<br />
Servicio<br />
74%<br />
72%<br />
53%<br />
2009<br />
2011<br />
2011
ESTADO DE LA <strong>RSE</strong> 2011 | 28<br />
Percepción sobre el Nivel <strong>de</strong> <strong>RSE</strong> <strong>de</strong><br />
<strong>la</strong>s empresas por actividad económica:<br />
En el gráfico N° 12 se incluye<br />
<strong>la</strong> percepción <strong>de</strong> los ejecutivos sobre<br />
el “Nivel <strong>de</strong> <strong>RSE</strong>” <strong>de</strong> sus empresas.<br />
En este caso, los ejecutivos que<br />
mejor evaluaron a sus empresas<br />
correspon<strong>de</strong>n a los sectores multi<br />
marcas- retail, agricultura, gana<strong>de</strong>ría<br />
y pesca, construcción y manufacturas.<br />
En <strong>la</strong> sección <strong>de</strong> abajo, los consumidores<br />
indicaron según su opinión<br />
cuáles son los sectores económicos<br />
más socialmente responsables. En<br />
este caso, se valoró con mayor <strong>RSE</strong><br />
a agricultura, gana<strong>de</strong>ría y pesca,<br />
transporte, comercio y manufacturas.<br />
Un dato a consi<strong>de</strong>rar es que<br />
para los consumidores el sector <strong>de</strong><br />
<strong>la</strong>s multi marcas- retail está en el<br />
último lugar.<br />
GRÁFICO N° 12<br />
Percepción sobre el “Nivel <strong>de</strong> <strong>RSE</strong>” <strong>de</strong> <strong>la</strong>s empresas por actividad económica.<br />
Multi marcas- retail<br />
Agricultura, gana<strong>de</strong>ría, pesca<br />
Construcción<br />
Manufacturas<br />
Agua<br />
Energía<br />
Servicios financieros y bancarios<br />
Turismo, hoteles y restaurantes<br />
Transporte y almacenamiento<br />
Activ. <strong>de</strong> esparcimiento, culturales y <strong>de</strong>portivas<br />
Minería<br />
Comercio<br />
Educación, salud, y servicios sociales<br />
Servicios empresariales<br />
Comunicaciones<br />
Ejecutivos<br />
Consumidores<br />
60%<br />
58%<br />
<br />
58%<br />
Comercio<br />
57%<br />
Manufacturas<br />
56%<br />
Comunicaciones<br />
<br />
56%<br />
Minería<br />
56%<br />
Energía <br />
56%<br />
Construcción<br />
56%<br />
54%<br />
54%<br />
54%<br />
52%<br />
51%<br />
49% Multi marcas- retail<br />
Agricultura, gana<strong>de</strong>ría, pesca<br />
Transporte y almacenamiento<br />
Agua<br />
Servicios empresariales<br />
Servicios financieros y bancarios<br />
81%<br />
79%<br />
78%<br />
78%<br />
77%<br />
76%<br />
76%<br />
76%<br />
76%<br />
75%<br />
74%<br />
73%<br />
72%<br />
72%<br />
67%<br />
Activ. <strong>de</strong> esparcimiento, culturales y <strong>de</strong>portivas<br />
Educación, salud, y servicios sociales<br />
Turismo, hoteles y restaurantes
ESTADO DE LA <strong>RSE</strong> 2011 | 29<br />
GRÁFICO N° 13<br />
Dimensiones <strong>de</strong> <strong>RSE</strong> según consumidores y ejecutivos.<br />
Ejecutivos 2009<br />
Ejecutivos 2011<br />
Consumidores 2011<br />
Consumidores y usuarios<br />
80%<br />
80%<br />
56%<br />
Re<strong>la</strong>ción con los trabajadores<br />
83%<br />
79%<br />
52%<br />
Re<strong>la</strong>ción con <strong>la</strong> comunidad<br />
78%<br />
73%<br />
54%<br />
Medio ambiente<br />
75%<br />
70%<br />
50%<br />
2009<br />
2011<br />
2011<br />
2009<br />
2011<br />
2011<br />
2009<br />
2011<br />
2011<br />
2009<br />
2011<br />
2011<br />
Toma <strong>de</strong> <strong>de</strong>cisiones y transparencia<br />
64%<br />
2009<br />
69%<br />
2011<br />
55%<br />
2011<br />
Resultados por dimensión <strong>de</strong> <strong>RSE</strong>:<br />
Al ahondar en el análisis por dimensiones<br />
<strong>de</strong> <strong>la</strong> <strong>RSE</strong>, se pue<strong>de</strong> advertir<br />
que <strong>la</strong> dimensión “Consumidores<br />
y usuarios” fue <strong>la</strong> mejor evaluada<br />
tanto por ejecutivos como consumidores<br />
en 2011- gráfico N° 13.<br />
En segundo lugar, se encuentra<br />
<strong>la</strong> “Re<strong>la</strong>ción con los trabajadores”,<br />
que fue <strong>la</strong> mejor evaluada<br />
en 2009. “Toma <strong>de</strong> <strong>de</strong>cisiones y<br />
transparencia” continúa siendo<br />
<strong>la</strong> peor evaluada <strong>de</strong>s<strong>de</strong> 2009. Sin<br />
embargo, como es posible advertir<br />
en el gráfico N° 14, que muestra<br />
los resultados <strong>de</strong> <strong>la</strong> pregunta:<br />
¿Con qué temas re<strong>la</strong>ciona <strong>la</strong> <strong>RSE</strong>?<br />
(realizada a los consumidores), el<br />
primero en <strong>la</strong> lista es “Toma <strong>de</strong><br />
<strong>de</strong>cisiones y transparencia”. Este<br />
aspecto no es menor y apoya con<br />
datos cuantitativos el argumento<br />
que indica <strong>la</strong> importancia <strong>de</strong> avanzar<br />
en acciones concretas respecto <strong>de</strong><br />
quienes toman <strong>la</strong>s <strong>de</strong>cisiones en<br />
<strong>la</strong>s empresas, con qué criterios<br />
lo hacen, y cómo estas <strong>de</strong>cisiones<br />
están apoyando el <strong>de</strong>sarrollo <strong>de</strong><br />
<strong>la</strong> región. En “Toma <strong>de</strong> <strong>de</strong>cisiones<br />
y transparencia” también están<br />
incluidas <strong>la</strong>s acciones <strong>de</strong> lucha<br />
contra <strong>la</strong> corrupción que están<br />
implementando <strong>la</strong>s compañías,<br />
temas en los cuales, aún queda un<br />
<strong>la</strong>rgo camino por recorrer.
ESTADO DE LA <strong>RSE</strong> 2011 | 30<br />
GRÁFICO N° 14<br />
¿Con qué temas re<strong>la</strong>ciona <strong>la</strong> <strong>RSE</strong>? Sólo consumidores.<br />
30%<br />
Toma <strong>de</strong> <strong>de</strong>cisiones y<br />
transparencia fue <strong>la</strong><br />
mejor evaluada cuando<br />
preguntamos a los<br />
consumidores.<br />
30%<br />
Toma <strong>de</strong> <strong>de</strong>cisiones<br />
y transparencia<br />
19%<br />
Re<strong>la</strong>ción con<br />
los trabajadores<br />
17%<br />
Medio ambiente<br />
15%<br />
Re<strong>la</strong>ción con<br />
<strong>la</strong> comunidad<br />
11%<br />
Consumidores<br />
y usuarios
ESTADO DE LA <strong>RSE</strong> 2011 | 31<br />
Brechas <strong>de</strong> percepción sobre <strong>la</strong>s<br />
dimensiones <strong>de</strong> <strong>RSE</strong>: En el gráfico<br />
N° 15, se <strong>de</strong>stacan <strong>la</strong>s brechas <strong>de</strong><br />
percepción entre ejecutivos y consumidores<br />
sobre <strong>la</strong>s dimensiones<br />
<strong>de</strong> <strong>RSE</strong> y con ello, se visualiza en<br />
qué aspectos hay más y menos<br />
consenso respecto <strong>de</strong> <strong>la</strong> situación<br />
<strong>de</strong> estas dimensiones en <strong>la</strong> región.<br />
En <strong>la</strong> dimensión vincu<strong>la</strong>da a “Re<strong>la</strong>ción<br />
con los trabajadores” los<br />
ejecutivos y trabajadores difieren<br />
en 27 puntos sobre 100 respecto <strong>de</strong><br />
<strong>la</strong> situación <strong>de</strong>l tema en <strong>la</strong> región.<br />
En segundo lugar, se encuentra el<br />
tema “Consumidores y usuarios”,<br />
en que se advierte una brecha <strong>de</strong><br />
24 puntos sobre 100 <strong>de</strong> diferencia<br />
en <strong>la</strong> percepción <strong>de</strong> ejecutivos y<br />
consumidores. <strong>El</strong> mayor grado <strong>de</strong><br />
consenso entre consumidores y ejecutivos<br />
está en <strong>la</strong> dimensión “Toma<br />
<strong>de</strong> <strong>de</strong>cisiones y transparencia”, aún<br />
cuando –como se mencionó con<br />
anterioridad- es percibida como<br />
más <strong>de</strong>ficiente a nivel regional por<br />
ambos actores.<br />
GRÁFICO N° 15<br />
Brechas <strong>de</strong> percepción entre ejecutivos y consumidores en <strong>la</strong>s dimensiones<br />
<strong>de</strong> <strong>RSE</strong> analizadas. Porcentajes asignados a cada dimensión <strong>de</strong> <strong>RSE</strong>.<br />
Ejecutivos<br />
Consumidores<br />
Brecha <strong>de</strong> percepción entre ambos<br />
Consumidores y usuarios<br />
80%<br />
56%<br />
Re<strong>la</strong>ción con los trabajadores<br />
79%<br />
52%<br />
Re<strong>la</strong>ciones con <strong>la</strong> comunidad<br />
73%<br />
54%<br />
Medio ambiente<br />
70%<br />
50%<br />
24%<br />
27%<br />
19%<br />
19%<br />
Toma <strong>de</strong> <strong>de</strong>cisiones y transparencia<br />
69%<br />
55%<br />
14%
ESTADO DE LA <strong>RSE</strong> 2011 | 32<br />
GRÁFICO N° 16<br />
Brechas <strong>de</strong> percepción entre ejecutivos y consumidores sobre “Nivel <strong>de</strong> <strong>RSE</strong>”<br />
por país.<br />
Ecuador<br />
75%<br />
48%<br />
Bolivia<br />
73%<br />
47%<br />
<strong>El</strong> Salvador<br />
25%<br />
80<br />
55%<br />
Brasil<br />
75%<br />
50%<br />
Nicaragua<br />
24%<br />
84%<br />
60%<br />
27%<br />
26%<br />
19%<br />
Costa Rica<br />
70%<br />
53%<br />
17%<br />
Brechas <strong>de</strong> percepción sobre el<br />
nivel <strong>de</strong> <strong>RSE</strong> por país: También se<br />
ahondó en <strong>la</strong>s brechas <strong>de</strong> percepción<br />
entre ejecutivos y consumidores<br />
sobre el “Nivel <strong>de</strong> <strong>RSE</strong>” según<br />
los países <strong>de</strong>l estudio. Como se<br />
pue<strong>de</strong> observar en el gráfico N°<br />
16, los países don<strong>de</strong> hay mayor<br />
<strong>de</strong>sacuerdo entre consumidores y<br />
ejecutivos sobre el “Nivel <strong>de</strong> <strong>RSE</strong>”<br />
<strong>de</strong> <strong>la</strong>s empresas son Ecuador, Bolivia,<br />
<strong>El</strong> Salvador, Brasil, Nicaragua<br />
y Honduras, entre otros. Cabe<br />
ac<strong>la</strong>rar, que en todos los países<br />
se encontraron brechas que van<br />
<strong>de</strong>s<strong>de</strong> 13 puntos en una esca<strong>la</strong> <strong>de</strong><br />
100 (Uruguay), hasta una brecha<br />
<strong>de</strong> 27 puntos (Ecuador).<br />
Honduras<br />
76%<br />
53%<br />
23%<br />
Chile<br />
66%<br />
50%<br />
16%<br />
Paraguay<br />
77%<br />
55%<br />
22%<br />
Perú<br />
70%<br />
56%<br />
14%<br />
Argentina<br />
74%<br />
53%<br />
22%<br />
Panamá<br />
72%<br />
58%<br />
14%<br />
Mexico<br />
74%<br />
54%<br />
20%<br />
Venezue<strong>la</strong><br />
71%<br />
57%<br />
14%<br />
Colombia<br />
73%<br />
55%<br />
18%<br />
Uruguay<br />
70%<br />
57%<br />
13%<br />
Ejecutivos<br />
Consumidores<br />
Brecha <strong>de</strong> percepción entre ambos
ESTADO DE LA <strong>RSE</strong> 2011 | 33<br />
Avance en el <strong>de</strong>sempeño <strong>de</strong> <strong>la</strong>s<br />
empresas en comparación a 2009:<br />
Un aspecto positivo se muestra en<br />
el gráfico N° 17, ya que el 55% <strong>de</strong><br />
los consumidores piensa que <strong>la</strong><br />
implementación <strong>de</strong> <strong>RSE</strong> por parte<br />
<strong>de</strong> <strong>la</strong>s empresas ha mejorado, y<br />
un 31% que se ha mantenido. En<br />
el gráfico N° 18, se advierte que<br />
tanto ejecutivos como consumidores<br />
consi<strong>de</strong>ran más avanzadas a<br />
<strong>la</strong>s empresas multinacionales en<br />
comparación con <strong>la</strong>s nacionales.<br />
Sin embargo, en el gráfico N° 19 se<br />
advierte que tanto consumidores<br />
como ejecutivos consi<strong>de</strong>ran que en<br />
los últimos dos años <strong>la</strong>s empresas<br />
nacionales han mejorado más que<br />
<strong>la</strong>s filiales <strong>de</strong> multinacionales. Inclusive,<br />
el porcentaje <strong>de</strong> personas<br />
que piensan que el <strong>de</strong>sempeño <strong>de</strong><br />
<strong>la</strong>s multinacionales ha empeorado<br />
(7%) es mayor a quienes opinan<br />
lo mismo <strong>de</strong> <strong>la</strong>s empresas nacionales<br />
(5%), lo que refleja una leve<br />
ten<strong>de</strong>ncia a nivel regional a valorar<br />
positivamente los avances <strong>de</strong> <strong>la</strong>s<br />
empresas locales, a pesar <strong>de</strong> <strong>la</strong><br />
percepción general que apoya el<br />
<strong>de</strong>sempeño en <strong>RSE</strong> <strong>de</strong> <strong>la</strong>s filiales<br />
<strong>de</strong> multinacionales más que <strong>de</strong> <strong>la</strong>s<br />
empresas nacionales.<br />
GRÁFICO N° 17<br />
¿Cómo consi<strong>de</strong>ra el <strong>de</strong>sempeño <strong>de</strong> <strong>la</strong>s empresas <strong>de</strong> su país en <strong>RSE</strong> a<br />
comparación a dos años atrás? Sólo consumidores.<br />
Ha mejorado 55%<br />
Ha empeorado<br />
8%<br />
GRÁFICO N° 18<br />
Ud. consi<strong>de</strong>ra que en su país <strong>la</strong>s empresas que más han avanzado en <strong>RSE</strong> son:<br />
Percepción <strong>de</strong> ejecutivos y <strong>de</strong> consumidores.<br />
Nacionales<br />
25%<br />
31%<br />
Se ha mantenido<br />
6%<br />
No contesta<br />
Filiales <strong>de</strong><br />
multinacionales<br />
62%<br />
Se excluyeron <strong>la</strong>s respuestas NS/NC
ESTADO DE LA <strong>RSE</strong> 2011 | 34<br />
GRÁFICO N° 19<br />
¿Cómo se han comportado <strong>la</strong>s empresas en los últimos dos años?. Percepciones <strong>de</strong> ejecutivos y consumidores.<br />
Nacionales<br />
Ha mejorado 72%<br />
23%<br />
Se ha mantenido<br />
Ha empeorado<br />
5%<br />
Filiales <strong>de</strong><br />
Multinacionales<br />
Ha mejorado 64%<br />
29%<br />
Se ha mantenido<br />
Ha empeorado<br />
7%
ESTADO DE LA <strong>RSE</strong> 2011 | 35<br />
Capacidad insta<strong>la</strong>da en <strong>la</strong>s empresas para <strong>la</strong> implementación <strong>de</strong> <strong>RSE</strong><br />
GRÁFICO N° 20<br />
¿Su empresa publica reportes <strong>de</strong> sustentabilidad?<br />
<strong>El</strong> Salvador 5<br />
Bolivia 4<br />
Chile21<br />
México34<br />
Honduras 10<br />
Costa Rica 22<br />
Venezue<strong>la</strong> 16<br />
Ecuador 11<br />
Perú 16<br />
Brasil 10<br />
Colombia 50<br />
Paraguay 8<br />
Uruguay 8<br />
Argentina 42<br />
Reportes <strong>de</strong> sustentabilidad: A<br />
continuación es posible visualizar el<br />
gráfico N° 20 que indica <strong>la</strong> cantidad<br />
<strong>de</strong> reportes que se mencionaron<br />
según país, siendo Colombia, Argentina<br />
y México en los que se encontraron<br />
más cantidad <strong>de</strong> reportes<br />
<strong>de</strong> sustentabilidad. <strong>El</strong> gráfico N°<br />
21 muestra un leve aumento <strong>de</strong>l<br />
número <strong>de</strong> empresas que publicaron<br />
reportes <strong>de</strong> sustentabilidad<br />
en 2009 (40%) en comparación al<br />
2011 (47%), es <strong>de</strong>cir, casi <strong>la</strong> mitad<br />
<strong>de</strong> <strong>la</strong>s empresas que participaron<br />
en el estudio en 2011 publica<br />
su reporte <strong>de</strong> sustentabilidad. Tal<br />
como aparece en el gráfico N° 22,<br />
el 68% <strong>de</strong> los ejecutivos afirma<br />
que en su e<strong>la</strong>boración se utiliza<br />
<strong>la</strong> metodología GRI, mientras que<br />
el 65% indica que <strong>la</strong>s empresas<br />
incorporan a sus grupos <strong>de</strong> interés<br />
en <strong>la</strong> e<strong>la</strong>boración y/o revisión<br />
<strong>de</strong> dichos reportes- gráfico N° 23.<br />
En los gráficos N° 24 y N° 25, se<br />
pue<strong>de</strong> observar que los países <strong>de</strong><br />
mayor uso <strong>de</strong> <strong>la</strong> metodología GRI<br />
son Chile, <strong>El</strong> Salvador, Argentina y<br />
Panamá, y aquellos don<strong>de</strong> más se<br />
integra a los grupos <strong>de</strong> interés en<br />
el proceso <strong>de</strong> reportar son Panamá,<br />
Honduras y <strong>El</strong> Salvador.
ESTADO DE LA <strong>RSE</strong> 2011 | 36<br />
GRÁFICO N° 21<br />
¿Su empresa publica reportes <strong>de</strong> sustentabilidad? Comparación con 2009.<br />
40% 2009<br />
2011<br />
47%<br />
2011<br />
leve aumento en el número<br />
<strong>de</strong> empresas que publican<br />
reportes <strong>de</strong> sustentabilidad.<br />
GRÁFICO N° 22<br />
Empresas que utilizan metodología GRI. Año 2011.<br />
68%<br />
Usa GRI<br />
68%<br />
32%<br />
No usa GRI<br />
<strong>de</strong> los reportes se basa en <strong>la</strong><br />
metodología GRI.<br />
GRÁFICO N° 23<br />
Empresas que incorporan a sus grupos <strong>de</strong> interés en <strong>la</strong> e<strong>la</strong>boración <strong>de</strong> reportes.<br />
Año 2011.<br />
65%<br />
Participan<br />
incorpora a sus grupos <strong>de</strong><br />
interés en su e<strong>la</strong>boración y/o<br />
revisión.<br />
35% No participan 65%
ESTADO DE LA <strong>RSE</strong> 2011 | 37<br />
GRÁFICO N° 24<br />
Empresas que utilizan metodología GRI, por país.<br />
Chile<br />
<strong>El</strong> Salvador<br />
Argentina<br />
Panamá<br />
Uruguay<br />
Perú<br />
Colombia<br />
Honduras<br />
Bolivia<br />
Ecuador<br />
Costa Rica<br />
México<br />
Venezue<strong>la</strong><br />
Paraguay<br />
Nicaragua<br />
90%<br />
80%<br />
80%<br />
75%<br />
71%<br />
71%<br />
70%<br />
67%<br />
67%<br />
64%<br />
58%<br />
56%<br />
53%<br />
50%<br />
33%<br />
Usa GRI<br />
No usa GRI<br />
10%<br />
20%<br />
20%<br />
25%<br />
29%<br />
29%<br />
30%<br />
33%<br />
33%<br />
36%<br />
42%<br />
44%<br />
47%<br />
50%<br />
67%<br />
GRÁFICO N° 25<br />
Empresas que incluyen a sus grupos <strong>de</strong> interés en <strong>la</strong> e<strong>la</strong>boración <strong>de</strong> los reportes,<br />
por país.<br />
Panamá<br />
Honduras<br />
<strong>El</strong> Salvador<br />
Nicaragua<br />
Chile<br />
Ecuador<br />
Costa Rica<br />
Colombia<br />
Venezue<strong>la</strong><br />
Argentina<br />
Uruguay<br />
Perú<br />
México<br />
Bolivia<br />
Paraguay<br />
83%<br />
80%<br />
80%<br />
75%<br />
75%<br />
73%<br />
73%<br />
67%<br />
67%<br />
67%<br />
57%<br />
53%<br />
53%<br />
50%<br />
33%<br />
Participan<br />
No Participan<br />
17%<br />
20%<br />
20%<br />
25%<br />
29%<br />
27%<br />
27%<br />
33%<br />
33%<br />
33%<br />
43%<br />
47%<br />
47%<br />
50%<br />
67%
ESTADO DE LA <strong>RSE</strong> 2011 | 38<br />
GRÁFICO N° 26<br />
¿Conoce los reportes <strong>de</strong> sustentabilidad? Sólo consumidores.<br />
56% Desconoce<br />
44% Conoce<br />
Conocimiento y percepción <strong>de</strong><br />
avance <strong>de</strong> <strong>la</strong> práctica <strong>de</strong> reportar<br />
aspectos <strong>de</strong> <strong>RSE</strong>: Es interesante<br />
advertir que el 44% <strong>de</strong> los<br />
consumidores participantes en<br />
el estudio conoce <strong>la</strong> práctica <strong>de</strong><br />
publicar reportes- gráfico N° 26<br />
, y <strong>de</strong> ellos, <strong>la</strong> mayoría consi<strong>de</strong>ra<br />
que esta práctica es habitual para<br />
empresas multinacionales pero<br />
también para empresas nacionales.<br />
Sin embargo, también hay un número<br />
importante <strong>de</strong> consumidores<br />
(31%) que indicaron que, <strong>de</strong>s<strong>de</strong> su<br />
punto <strong>de</strong> vista, casi ninguna empresa<br />
publica reportes- gráfico N° 27.<br />
GRÁFICO N° 27<br />
¿Qué tipo <strong>de</strong> empresas ha adoptado esta práctica?<br />
32%<br />
Empresas nacionales<br />
y multinacionales<br />
32%<br />
Sólo empresas<br />
multinacionales<br />
3%<br />
La mayoría <strong>de</strong> <strong>la</strong>s empresas<br />
1%<br />
NS/NC<br />
0,5%<br />
Empresas nacionales<br />
31%<br />
Casi ninguna empresa
ESTADO DE LA <strong>RSE</strong> 2011 | 39<br />
Estrategias o políticas <strong>de</strong> <strong>RSE</strong>: <strong>El</strong><br />
55% <strong>de</strong> los ejecutivos que respondieron<br />
esta encuesta indicaron que<br />
sus empresas cuentan con una<br />
política o estrategia <strong>de</strong> <strong>RSE</strong> escrita<br />
y difundida- gráfico N° 28. Los países<br />
don<strong>de</strong> más se mencionó esta<br />
práctica fueron: Uruguay, Colombia,<br />
Honduras y <strong>El</strong> Salvador, mientras<br />
que don<strong>de</strong> menos se conoce este<br />
aspecto es en Panamá, Argentina<br />
y Brasil- gráfico N° 29. También es<br />
interesante ver que <strong>la</strong>s empresas<br />
que tienen políticas <strong>de</strong> <strong>RSE</strong> lograron<br />
niveles <strong>de</strong> <strong>RSE</strong> más altos que<br />
aquel<strong>la</strong>s que no tienen una política<br />
<strong>de</strong>finida, con una diferencia <strong>de</strong> 13<br />
puntos porcentuales- gráfico N° 30.<br />
GRÁFICO N° 30<br />
GRÁFICO N° 28<br />
Re<strong>la</strong>ción entre “Nivel <strong>de</strong> <strong>RSE</strong>” y posee o no posee una política <strong>de</strong><br />
sustentabilidad escrita y difundida<br />
Nivel <strong>de</strong> <strong>RSE</strong><br />
85<br />
80<br />
75<br />
70<br />
65<br />
60<br />
67%<br />
No tiene política<br />
<strong>de</strong> sustentabilidad<br />
¿Cuenta su empresa con una estrategia/ política <strong>de</strong> sustentabilidad o <strong>RSE</strong><br />
escrita y difundida?<br />
Sí 55%<br />
NS/NC<br />
6%<br />
Tiene política<br />
<strong>de</strong> sustentabilidad<br />
GRÁFICO N° 29<br />
Porcentaje <strong>de</strong> empresas que cuentan con una estrategia<br />
/ política <strong>de</strong> sustentabilidad o <strong>RSE</strong> escrita y difundida.<br />
Por país.<br />
80%<br />
39% No<br />
80%<br />
Uruguay<br />
75%<br />
Colombia<br />
71%<br />
Honduras<br />
62%<br />
<strong>El</strong> Salvador<br />
61%<br />
Perú<br />
59%<br />
Costa Rica<br />
57%<br />
Nicaragua<br />
56%<br />
Ecuador<br />
55%<br />
Bolivia<br />
52%<br />
Paraguay<br />
52%<br />
Venezue<strong>la</strong><br />
52%<br />
Chile<br />
48%<br />
México<br />
43%<br />
Panamá<br />
42%<br />
Argentina<br />
30% Brasil
ESTADO DE LA <strong>RSE</strong> 2011 | 40<br />
GRÁFICO N° 31<br />
¿Cuáles son <strong>la</strong>s principales estrategias <strong>de</strong> comunicación <strong>de</strong> <strong>la</strong> <strong>RSE</strong> en su<br />
empresa?<br />
42%<br />
Página Web<br />
<strong>de</strong> <strong>la</strong> empresa<br />
13%<br />
Re<strong>de</strong>s sociales<br />
1%<br />
Instancias <strong>de</strong><br />
capacitación<br />
8%<br />
Otra<br />
13%<br />
NS/NC<br />
3%<br />
Participación en<br />
eventos, activida<strong>de</strong>s<br />
y publicidad<br />
10%<br />
Informes,<br />
boletines,<br />
publicaciones<br />
8%<br />
Página Web<br />
especial sobre<br />
<strong>RSE</strong><br />
Estrategias <strong>de</strong> comunicación <strong>de</strong><br />
<strong>RSE</strong>: En el gráfico siguiente N°<br />
31 es posible ver que el 43% <strong>de</strong><br />
los ejecutivos que participaron<br />
<strong>de</strong>l estudio indicó que utilizan su<br />
página web para comunicar sus<br />
acciones <strong>de</strong> <strong>RSE</strong> y el 13% participa<br />
<strong>de</strong> eventos en el tema. Sólo el 8%<br />
indicó contar con una página web<br />
especial sobre sus acciones <strong>de</strong><br />
<strong>RSE</strong>. En síntesis, el uso <strong>de</strong> medios<br />
digitales es <strong>la</strong> forma más común<br />
<strong>de</strong> difusión <strong>de</strong> <strong>la</strong>s prácticas <strong>de</strong><br />
<strong>RSE</strong>. Por el contrario, l<strong>la</strong>ma <strong>la</strong><br />
atención <strong>la</strong> escasa utilización <strong>de</strong><br />
<strong>la</strong>s capacitaciones como medio<br />
para dar a conocer dichas acciones,<br />
siendo que estas instancias<br />
“cara a cara” suelen ser bastante<br />
efectivas al momento <strong>de</strong> insta<strong>la</strong>r<br />
nuevas i<strong>de</strong>as en <strong>la</strong> cultura <strong>de</strong> <strong>la</strong>s<br />
empresas.
ESTADO DE LA <strong>RSE</strong> 2011 | 41<br />
Adhesión a estándares internacionales:<br />
Los estándares <strong>de</strong> mayor<br />
adhesión son <strong>la</strong> ISO 9.000 y el Pacto<br />
Global. Sólo el 3,9% indicó estar<br />
utilizando <strong>la</strong> guía ISO 26.000. Esto<br />
último pue<strong>de</strong> estar condicionado por<br />
su reciente publicación, a pesar <strong>de</strong><br />
ser el estándar más consensuado<br />
a nivel mundial- gráfico N° 32. Por<br />
otro <strong>la</strong>do, existe un leve aumento en<br />
<strong>la</strong> adhesión a estándares internacionales<br />
por parte <strong>de</strong> <strong>la</strong>s compañías<br />
entre 2009 y 2011- gráfico N° 33.<br />
GRÁFICO N° 32<br />
¿A cuál <strong>de</strong> estos estándares adhiere su empresa?<br />
20% 15% 7% 7% 6% 4% 2% 2% 1%<br />
ISO 9000<br />
Pacto Global<br />
Indica<strong>RSE</strong><br />
Distintivo Empresa <strong>Social</strong>mente<br />
Responsable (Distintivo ESR)<br />
ISO 14000<br />
ISO 26000<br />
Indicadores Ethos/PLA<strong>RSE</strong><br />
ISO 9001<br />
OHSAS 18001<br />
<strong>El</strong> 4% <strong>de</strong> los ejecutivos mencionaron otros estándares internacionales. <strong>El</strong> 16%<br />
indicó que su empresa no adhiere a ningún estándar.<br />
GRÁFICO N° 33<br />
Comparación <strong>de</strong> adhesión a estándares en 2009 y 2011.<br />
84% 2011 79% 2009
ESTADO DE LA <strong>RSE</strong> 2011 | 42<br />
GRÁFICO N° 34<br />
¿Su empresa tiene un encargado <strong>de</strong> <strong>RSE</strong>?<br />
75% 2011 65% 2009<br />
Cargo específico <strong>de</strong> <strong>RSE</strong>: Tal como<br />
se observa en el gráfico N° 34, en<br />
2011, se produjo un incremento<br />
respecto <strong>de</strong> 2009 en cuanto a <strong>la</strong>s<br />
personas que <strong>de</strong>ntro <strong>de</strong> <strong>la</strong> empresa<br />
ocupan un cargo específico para<br />
<strong>la</strong> <strong>RSE</strong>: disminuye <strong>la</strong> cantidad <strong>de</strong><br />
compañías que ya no cuentan con<br />
un cargo específico para el área, y<br />
aumenta el número <strong>de</strong> gerentes o<br />
directores <strong>de</strong> <strong>RSE</strong>- gráfico N° 35.<br />
GRÁFICO N° 35<br />
¿Cuál es su cargo?<br />
No existe el cargo<br />
25%<br />
35%<br />
2011<br />
2009<br />
Gerente o Director <strong>de</strong> <strong>RSE</strong><br />
24%<br />
2011<br />
17% 2009<br />
Gerente <strong>de</strong> Recursos humanos<br />
11%<br />
2011<br />
10% 2009<br />
Vicepresi<strong>de</strong>nte <strong>de</strong> <strong>RSE</strong><br />
7%<br />
2011<br />
7% 2009<br />
Gerente <strong>de</strong> Marketing o Comunicaciones<br />
2%<br />
2011<br />
4% 2009<br />
Gerente <strong>de</strong> Medioambiente y/o Desarrollo Sostenible<br />
2%<br />
2011<br />
2% 2009
ESTADO DE LA <strong>RSE</strong> 2011 | 43<br />
Capacidad insta<strong>la</strong>da: Esta variable<br />
está construida con el objetivo <strong>de</strong><br />
reunir bajo un solo indicador los<br />
recursos que una empresa pue<strong>de</strong><br />
integrar a su negocio con el fin <strong>de</strong><br />
avanzar en <strong>la</strong> implementación <strong>de</strong><br />
<strong>RSE</strong>, por ello, está construida en<br />
este estudio (como en 2009) por<br />
cuatro componentes: <strong>la</strong> empresa<br />
1. Cuenta con un reporte <strong>de</strong><br />
sostenibilidad, 2. Ha integrado al<br />
menos un estándar internacional, 3.<br />
Cuenta con un cargo específico <strong>de</strong><br />
<strong>RSE</strong> entre su personal, 4, Adhiere<br />
a una entidad promotora <strong>de</strong> <strong>RSE</strong>.<br />
Esta variable fue c<strong>la</strong>sificada en 4<br />
categorías: 1.La empresa no cuenta<br />
con ninguno <strong>de</strong> los componentes <strong>de</strong><br />
”Capacidad insta<strong>la</strong>da”: Capacidad<br />
no <strong>de</strong>sarrol<strong>la</strong>da, 2. La empresa ha<br />
integrado uno <strong>de</strong> los componentes:<br />
Capacidad insta<strong>la</strong>da incipiente, 3.<br />
La empresa ha integrado entre 2 y<br />
3 componentes: Capacidad insta<strong>la</strong>da<br />
intermedia, y 4. La empresa<br />
ha integrado los 4 componentes:<br />
Capacidad insta<strong>la</strong>da avanzada.<br />
Capacidad insta<strong>la</strong>da por país: En el<br />
gráfico N° 36 se pue<strong>de</strong> observar que<br />
el 56% <strong>de</strong> <strong>la</strong>s empresas en este estudio<br />
están en un nivel <strong>de</strong> Capacidad<br />
insta<strong>la</strong>da intermedia. Sólo el 35%<br />
cuenta con un nivel <strong>de</strong> Capacidad<br />
insta<strong>la</strong>da avanzada. En el gráfico<br />
N° 37 se presentan algunos países<br />
con distintos niveles <strong>de</strong> “Capacidad<br />
insta<strong>la</strong>da”. Destaca el caso <strong>de</strong> Brasil<br />
don<strong>de</strong> el 38% <strong>de</strong> <strong>la</strong>s empresas tiene<br />
una Capacidad avanzada, también el<br />
caso <strong>de</strong> Nicaragua. En Paraguay, se<br />
presentó un nivel menos <strong>de</strong>sarrol<strong>la</strong>da,<br />
con un 5% <strong>de</strong> sus empresas.<br />
GRÁFICO N° 36<br />
“Capacidad insta<strong>la</strong>da” para <strong>la</strong> implementación <strong>de</strong> <strong>la</strong> <strong>RSE</strong>.<br />
Capacidad intermedia 56%<br />
35%<br />
Capacidad avanzada<br />
No <strong>de</strong>sarrol<strong>la</strong>da 1%<br />
9%<br />
Capacidad incipiente
ESTADO DE LA <strong>RSE</strong> 2011 | 44<br />
GRÁFICO N° 37<br />
Nivel <strong>de</strong> Capacidad insta<strong>la</strong>da. Países seleccionados.<br />
Capacidad avanzada<br />
Capacidad intermedia<br />
Capacidad incipiente<br />
No <strong>de</strong>sarrol<strong>la</strong>da<br />
62%<br />
47%<br />
Paraguay<br />
32%<br />
Brasil<br />
38%<br />
5%<br />
16%<br />
56%<br />
Argentina<br />
33%<br />
50%<br />
Nicaragua<br />
25%<br />
1%<br />
10%<br />
25%<br />
70%<br />
22%<br />
Uruguay<br />
9%
ESTADO DE LA <strong>RSE</strong> 2011 | 45<br />
Re<strong>la</strong>ción a "Nivel <strong>de</strong> <strong>RSE</strong>" y "Capacidad<br />
insta<strong>la</strong>da": Tanto en 2009<br />
como en 2011 se comprobó que <strong>la</strong>s<br />
empresas que tienen más recursos<br />
o “Capacida<strong>de</strong>s insta<strong>la</strong>da” para el<br />
avance <strong>de</strong> <strong>la</strong> <strong>RSE</strong> lograron mejores<br />
resultados en su “Nivel <strong>de</strong> <strong>RSE</strong>”,<br />
como se pue<strong>de</strong> ver en el gráfico<br />
N° 38.<br />
GRÁFICO N° 38<br />
Re<strong>la</strong>ción entre “Nivel <strong>de</strong> <strong>RSE</strong>” y ”Capacidad insta<strong>la</strong>da” en <strong>la</strong> empresa para<br />
implementar <strong>RSE</strong>.<br />
100<br />
Nivel <strong>de</strong> <strong>RSE</strong><br />
90<br />
80<br />
70<br />
60<br />
50<br />
65%<br />
57%<br />
Ningún<br />
criterio<br />
69%<br />
63%<br />
Al menos<br />
un criterio<br />
76%<br />
69%<br />
Dos<br />
criterios<br />
79%<br />
75%<br />
Tres<br />
criterios<br />
84%<br />
81%<br />
Cuatro<br />
criterios<br />
2009<br />
2011<br />
Capacidad<br />
insta<strong>la</strong>da<br />
Componentes “Capacidad insta<strong>la</strong>da” <strong>de</strong> <strong>la</strong> Empresa:<br />
1. Cuenta con un reporte <strong>de</strong> sostenibilidad.<br />
2. Ha integrado al menos un estándar internacional.<br />
3. Cuenta con un cargo específico <strong>de</strong> <strong>RSE</strong> entre su personal.<br />
4. Adhiere a una entidad promotora <strong>de</strong> <strong>RSE</strong>.<br />
Categorías:<br />
Capacidad no <strong>de</strong>sarrol<strong>la</strong>da: <strong>la</strong> empresa no cuenta con ninguno <strong>de</strong> los componentes<br />
<strong>de</strong> ”Capacidad insta<strong>la</strong>da”.<br />
Capacidad insta<strong>la</strong>da incipiente: <strong>la</strong> empresa ha integrado uno <strong>de</strong> los componentes.<br />
Capacidad insta<strong>la</strong>da intermedia: <strong>la</strong> empresa ha integrado entre 2 y 3 componentes.<br />
Capacidad insta<strong>la</strong>da avanzada: <strong>la</strong> empresa ha integrado los 4 componentes.
ESTADO DE LA <strong>RSE</strong> 2011 | 46<br />
Entorno Latinoamericano y avance <strong>de</strong> <strong>la</strong> <strong>RSE</strong><br />
GRÁFICO N° 39<br />
¿Qué nivel <strong>de</strong> confianza le tiene a los siguientes sectores?<br />
Nivel <strong>de</strong> confianza en los sectores<br />
<strong>de</strong> <strong>la</strong> sociedad: En el gráfico N° 39,<br />
los consumidores indicaron tener<br />
un 70% <strong>de</strong> confianza en <strong>la</strong>s entida<strong>de</strong>s<br />
<strong>de</strong> <strong>la</strong> sociedad civil, casi un<br />
60% <strong>de</strong> confianza en <strong>la</strong>s empresas,<br />
y sólo el 44% <strong>de</strong> confianza en los<br />
gobiernos.<br />
ONG / Organizaciones<br />
<strong>de</strong> <strong>la</strong> Sociedad Civil<br />
71%<br />
Sector Privado<br />
60%<br />
Gobierno / Organismos<br />
Gubernamentales<br />
44%
ESTADO DE LA <strong>RSE</strong> 2011 | 47<br />
Satisfacción <strong>de</strong> ejecutivos y consumidores<br />
con <strong>la</strong>s empresas <strong>de</strong> su<br />
país en re<strong>la</strong>ción a <strong>la</strong>s dimensiones<br />
<strong>de</strong> <strong>RSE</strong>: <strong>El</strong> gráfico <strong>de</strong> <strong>la</strong> izquierda,<br />
N° 40, indica <strong>la</strong> lista <strong>de</strong> países<br />
según el nivel <strong>de</strong> satisfacción que<br />
expresaron los ejecutivos respecto<br />
<strong>de</strong>l <strong>de</strong>sempeño <strong>de</strong> sus empresas<br />
en <strong>la</strong>s dimensiones estudiadas <strong>de</strong><br />
<strong>RSE</strong>. En este caso, los ejecutivos<br />
que indicaron estar más conformes<br />
con el <strong>de</strong>sempeño <strong>de</strong> sus empresas<br />
son <strong>de</strong> Nicaragua, <strong>El</strong> Salvador y Paraguay.<br />
En el gráfico <strong>de</strong> <strong>la</strong> <strong>de</strong>recha,<br />
N° 41, los consumidores evaluaron<br />
a <strong>la</strong>s empresas <strong>de</strong> su país según<br />
<strong>la</strong>s variables estudiadas <strong>de</strong> <strong>RSE</strong>. En<br />
este caso, los consumidores más<br />
satisfechos con sus empresas son<br />
<strong>de</strong> Paraguay, <strong>El</strong> Salvador y Panamá.<br />
GRÁFICO N° 40<br />
Percepción <strong>de</strong> ejecutivos sobre <strong>la</strong> <strong>RSE</strong> <strong>de</strong> <strong>la</strong>s empresas.<br />
GRÁFICO N° 41<br />
Percepción <strong>de</strong> consumidores sobre <strong>la</strong> <strong>RSE</strong> <strong>de</strong> <strong>la</strong>s empresas.<br />
Nicaragua<br />
<strong>El</strong> Salvador<br />
Paraguay<br />
Honduras<br />
Bolivia<br />
Ecuador<br />
Brasil<br />
Panamá<br />
Venezue<strong>la</strong><br />
México<br />
Uruguay<br />
Perú<br />
Costa Rica<br />
Colombia<br />
Chile<br />
Argentina<br />
83%<br />
79%<br />
75%<br />
73%<br />
72%<br />
72%<br />
72%<br />
71%<br />
67%<br />
67%<br />
66%<br />
66%<br />
65%<br />
62%<br />
61%<br />
59%<br />
Paraguay<br />
<strong>El</strong> Salvador<br />
Panamá<br />
Nicaragua<br />
Costa Rica<br />
Venezue<strong>la</strong><br />
Perú<br />
Uruguay<br />
Ecuador<br />
Bolivia<br />
Brasil<br />
Honduras<br />
Chile<br />
Colombia<br />
México<br />
Argentina<br />
60%<br />
58%<br />
55%<br />
55%<br />
54%<br />
54%<br />
53%<br />
52%<br />
52%<br />
48%<br />
48%<br />
47%<br />
47%<br />
46%<br />
42%<br />
41%
ESTADO DE LA <strong>RSE</strong> 2011 | 48<br />
Preferencia por productos socialmente<br />
responsables: <strong>El</strong> 94%<br />
<strong>de</strong> los consumidores indicó que<br />
preferiría comprar un producto<br />
socialmente responsable aunque<br />
este tuviera un precio mayor. <strong>El</strong><br />
65% indicó que pagaría entre un 6<br />
y un 20% más por un producto con<br />
estas características- gráfico N° 42.<br />
Sin embargo, cuando preguntamos<br />
“Ud. cree que los consumidores<br />
<strong>de</strong> su país prefieren los productos<br />
socialmente responsables…”- gráfico<br />
N° 43, el 65% indicó que no.<br />
Esto sugiere que en Latinoamérica<br />
coexisten una actitud favorable<br />
hacia el consumo <strong>de</strong> productos<br />
socialmente responsables, y <strong>la</strong><br />
creencia <strong>de</strong> que esta actitud no<br />
es generalizada o compartida por<br />
los consumidores <strong>de</strong> <strong>la</strong> región. Las<br />
razones pue<strong>de</strong>n re<strong>la</strong>cionarse con<br />
<strong>la</strong>s dificulta<strong>de</strong>s para <strong>la</strong> masificación<br />
<strong>de</strong> este tipo <strong>de</strong> producto o <strong>la</strong>s<br />
complejida<strong>de</strong>s que se presentan<br />
a <strong>la</strong> hora <strong>de</strong> comunicar los argumentos<br />
que hacen responsable un<br />
producto, entre otras.<br />
GRÁFICO N° 42<br />
Usted preferiría comprar un producto que fue e<strong>la</strong>borado con prácticas sociales<br />
y ambientalmente responsables, aunque tuviera un precio mayor? ¿Cuánto más<br />
estaría dispuesto a pagar?<br />
Entre un 6%<br />
y un 20%<br />
66%<br />
Entre 21% y 60% 6%<br />
GRÁFICO N° 43<br />
Sí<br />
95%<br />
No<br />
5%<br />
26% Menos <strong>de</strong>l 5%<br />
2% Más <strong>de</strong>l 61%<br />
¿Ud. cree que los consumidores <strong>de</strong> su país prefieren en general los productos<br />
e<strong>la</strong>borados con prácticas sociales y ambientalmente responsables?<br />
No<br />
66%<br />
Sí<br />
34%
ESTADO DE LA <strong>RSE</strong> 2011 | 49<br />
GRÁFICO N° 44<br />
Principales obstáculos para el avance <strong>de</strong> <strong>la</strong> <strong>RSE</strong> en su país. Sólo ejecutivos.<br />
Actitud pública<br />
ante <strong>la</strong> <strong>RSE</strong><br />
30%<br />
Régimen impositivo 13%<br />
Falta <strong>de</strong> confianza<br />
en el sector privado<br />
Régimen Impositivo 3%<br />
Actitud pública<br />
ante <strong>la</strong> <strong>RSE</strong><br />
Ambiente legal 19%<br />
30%<br />
18%<br />
Ejecutivos<br />
Consumidores<br />
23% Falta <strong>de</strong> confianza<br />
en el sector privado<br />
15% Otro<br />
GRÁFICO N° 45<br />
Principales obstáculos para el avance <strong>de</strong> <strong>la</strong> <strong>RSE</strong> en su país según consumidores.<br />
25% Ambiente legal<br />
24% Otro<br />
Obstáculos para el avance <strong>de</strong> <strong>la</strong><br />
<strong>RSE</strong>: Al integrar <strong>la</strong> mirada <strong>de</strong>l consumidor,<br />
como una innovación <strong>de</strong>l<br />
reporte 2011, resultó interesante<br />
realizar comparaciones sobre sus<br />
percepciones respecto <strong>de</strong>l ambiente<br />
en don<strong>de</strong> se <strong>de</strong>sarrol<strong>la</strong> <strong>la</strong> <strong>RSE</strong> y su<br />
opinión acerca <strong>de</strong> qué aspectos<br />
están favoreciendo más o menos<br />
su avance en América Latina.<br />
Como es posible visualizar en los<br />
gráficos N° 44 y N° 45, el obstáculo<br />
más mencionado tanto por<br />
ejecutivos como consumidores fue<br />
<strong>la</strong> actitud <strong>de</strong> <strong>la</strong>s personas ante<br />
<strong>la</strong> <strong>RSE</strong> (30%),seguido <strong>de</strong> <strong>la</strong> falta<br />
<strong>de</strong> confianza en el sector privado<br />
(23% y 24%, respectivamente). Es<br />
interesante <strong>de</strong>stacar que ejecutivos<br />
y consumidores consi<strong>de</strong>raron que<br />
el régimen impositivo obstaculizaba<br />
menos el avance <strong>de</strong> <strong>la</strong> <strong>RSE</strong> que los<br />
otros ámbitos. .<br />
Así, nos encontramos ante un escenario<br />
en el que ambos actores<br />
atribuyen el mayor o menor avance<br />
<strong>de</strong> <strong>la</strong> <strong>RSE</strong> a causalida<strong>de</strong>s simi<strong>la</strong>res,<br />
es <strong>de</strong> esperar entonces que ello<br />
permita aumentar el diálogo sobre<br />
el tema y que <strong>la</strong>s conversaciones<br />
tengan resultados concretos que<br />
permitan a <strong>la</strong> vez ir disminuyendo<br />
<strong>de</strong>sconfianzas que no co<strong>la</strong>boran<br />
con <strong>la</strong> imp<strong>la</strong>ntación <strong>de</strong> prácticas<br />
socialmente responsables en <strong>la</strong>s<br />
empresas <strong>de</strong> <strong>la</strong> región.
ESTADO DE LA <strong>RSE</strong> 2011 | 50<br />
Opinión <strong>de</strong> ejecutivos y consumidores<br />
sobre el marco legal <strong>de</strong><br />
<strong>la</strong> <strong>RSE</strong>, <strong>la</strong> regu<strong>la</strong>ción <strong>la</strong>boral y<br />
medioambiental: <strong>El</strong> gráfico N°<br />
46 muestra que tanto ejecutivos<br />
como consumidores están divididos<br />
sobre cuánto favorece el marco<br />
legal <strong>de</strong> sus países el avance <strong>de</strong><br />
<strong>la</strong> <strong>RSE</strong>: una mitad piensa que su<br />
marco legal es favorable, pero <strong>la</strong><br />
otra mitad piensa que no lo es. Sin<br />
embargo, cuando preguntamos<br />
sobre aspectos más específicos,<br />
encontramos que en temas medioambientales,<br />
hay bastante acuerdo:<br />
el 82% <strong>de</strong> los ejecutivos y el 91% <strong>de</strong><br />
los consumidores piensa que <strong>de</strong>be<br />
incrementarse- gráfico N° 47. Y si<br />
bien los dos grupos consi<strong>de</strong>ran que<br />
<strong>de</strong>be incrementarse <strong>la</strong> legis<strong>la</strong>ción<br />
en temas <strong>la</strong>borales, los consumidores<br />
se muestran mucho más<br />
convencidos sobre esta necesidad<br />
que los ejecutivos, lo que se refleja<br />
en una diferencia <strong>de</strong> 20 puntos<br />
porcentuales entre ambas posturas<br />
(71% <strong>de</strong> consumidores versus el<br />
51% <strong>de</strong> ejecutivos)- gráfico N° 48.<br />
Asimismo, este gráfico muestra que<br />
el 18,6% <strong>de</strong> <strong>la</strong>s empresas prefiere<br />
que se disminuya dicha regu<strong>la</strong>ción,<br />
mientras que sólo el 7,1% <strong>de</strong> los<br />
consumidores consi<strong>de</strong>ra que esta<br />
sería una buena opción.<br />
GRÁFICO N° 46<br />
¿Usted cree que el marco legal <strong>de</strong> su país es favorable para el avance <strong>de</strong> <strong>la</strong> <strong>RSE</strong>?<br />
Ejecutivos<br />
Sí<br />
51%<br />
Consumidores<br />
Sí<br />
52%<br />
No<br />
49%<br />
No<br />
48%
ESTADO DE LA <strong>RSE</strong> 2011 | 51<br />
GRÁFICO N° 47<br />
Usted cree que <strong>la</strong> regu<strong>la</strong>ción en temas medioambientales en su país <strong>de</strong>be:<br />
Incrementarse 83%<br />
Ejecutivos<br />
14% Mantenerse igual<br />
2% Disminuir<br />
1% NS/NC<br />
Incrementarse 92%<br />
Consumidores<br />
6% Mantenerse igual<br />
1% Disminuir<br />
1% NS/NC
ESTADO DE LA <strong>RSE</strong> 2011 | 52<br />
GRÁFICO N° 48<br />
Usted cree que <strong>la</strong> regu<strong>la</strong>ción en temas <strong>la</strong>borales en su país <strong>de</strong>be:<br />
Incrementarse 51%<br />
27% Mantenerse igual<br />
Ejecutivos<br />
19% Disminuir<br />
3% NS/NC<br />
Incrementarse 71%<br />
Consumidores<br />
17% Mantenerse igual<br />
5% NS/NC<br />
7% Disminuir
ESTADO DE LA <strong>RSE</strong> 2011 | 53<br />
Referencias bibliográficas<br />
• Forética (2011), Evolución <strong>de</strong> <strong>la</strong> <strong>Responsabilidad</strong> <strong>Social</strong> <strong>de</strong> <strong>la</strong>s Empresas<br />
en España, disponible en http://www.foretica.org/biblioteca/<br />
informes-foretica/doc_<strong>de</strong>tails/298-informe-foretica-2011-versionextendida-?<strong>la</strong>ng=en<br />
visita el 13 <strong>de</strong> octubre <strong>de</strong> 2011.<br />
• Forum Empresa (2009), <strong>El</strong> estado <strong>de</strong> <strong>la</strong> <strong>Responsabilidad</strong> <strong>Social</strong> Empresarial<br />
bajo <strong>la</strong> mirada <strong>de</strong> ejecutivos <strong>de</strong> empresas <strong>de</strong> Latinoamérica<br />
2009, disponible en http://www.empresa.org/sitio-2009/documentos/<br />
<strong>Estado</strong><strong>RSE</strong>_FE.pdf visita el 13 <strong>de</strong> octubre <strong>de</strong> 2011.<br />
• Korin, Merce<strong>de</strong>s. Mapeo <strong>de</strong> Promotores <strong>de</strong> <strong>RSE</strong> en América Latina,<br />
versión 2009 (apoyada por Fundación Carolina).Disponible en http://<br />
www.mapeo-rse.info/ visita el 19 <strong>de</strong> octubre <strong>de</strong> 2011.<br />
• Naciones Unidas, División <strong>de</strong> Estadísticas (2011), C<strong>la</strong>sificación<br />
Industrial Internacional Uniforme <strong>de</strong> todas <strong>la</strong>s activida<strong>de</strong>s económicas,<br />
disponible en http://unstats.un.org/unsd/cr/registry/regcst.<br />
asp?cl=2&lg=3 visita el 13 <strong>de</strong> octubre <strong>de</strong> 2011.<br />
• Organización Internacional <strong>de</strong> Estandarización (2010), International<br />
Standard ISO 26000, disponible en HTTP://www.iso.org visita el 13<br />
<strong>de</strong> octubre <strong>de</strong> 2011.
ESTADO DE LA <strong>RSE</strong> 2011 | 54<br />
Anexo I: Metodología <strong>de</strong>l estudio<br />
Análisis <strong>de</strong> los datos<br />
A <strong>la</strong> información obtenida a partir<br />
<strong>de</strong> los datos recopi<strong>la</strong>dos online se le<br />
aplicó <strong>la</strong> prueba t para <strong>la</strong> muestra,<br />
<strong>la</strong> que arrojó un grado <strong>de</strong> error al<br />
95% <strong>de</strong> confianza <strong>de</strong> +-3,2.<br />
La fiabilidad <strong>de</strong> <strong>la</strong>s esca<strong>la</strong>s fueron<br />
analizadas por medio <strong>de</strong> Alpha <strong>de</strong><br />
Cronbach, que arrojó un valor <strong>de</strong><br />
entre 0,7 y 0,95 para <strong>la</strong>s esca<strong>la</strong>s<br />
correspondientes a <strong>la</strong>s distintas<br />
dimensiones <strong>de</strong>l “Nivel <strong>de</strong> <strong>RSE</strong>”.<br />
A <strong>la</strong> vez, se realizaron pruebas <strong>de</strong><br />
corre<strong>la</strong>ción y análisis <strong>de</strong> <strong>la</strong> varianza<br />
entre <strong>la</strong>s variables intervinientes<br />
<strong>de</strong> cada apartado temático <strong>de</strong> <strong>la</strong><br />
encuesta con el fin <strong>de</strong> comprobar<br />
<strong>la</strong> pertinencia <strong>de</strong>l análisis conjunto<br />
<strong>de</strong> <strong>la</strong>s mismas.<br />
Limitaciones <strong>de</strong>l estudio<br />
La limitación <strong>de</strong> este estudio radicó<br />
en el alto porcentaje <strong>de</strong> no<br />
respuesta. Para <strong>de</strong>finir el tamaño<br />
<strong>de</strong> <strong>la</strong> muestra con el cual trabajar<br />
se realizó un análisis <strong>de</strong> missing<br />
value, que arrojó un patrón <strong>de</strong> no<br />
respuesta completamente aleatorio<br />
(MCAR). Los casos que no presentaron<br />
respuestas no fueron consi<strong>de</strong>rados<br />
en el análisis, aún cuando<br />
sí fueron contabilizados <strong>de</strong>ntro <strong>de</strong>l<br />
N total. Con todo, al tratarse <strong>de</strong> un<br />
estudio <strong>de</strong> percepción no se realizó<br />
imputación <strong>de</strong> los datos.<br />
Los cuestionarios utilizados indagaron <strong>la</strong> percepción <strong>de</strong> ejecutivos<br />
y consumidores sobre los siguientes aspectos:<br />
• Dimensiones <strong>de</strong> <strong>RSE</strong>:<br />
» Toma <strong>de</strong> <strong>de</strong>cisiones y transparencia (incluye prácticas justas<br />
<strong>de</strong> operación).<br />
» Re<strong>la</strong>ciones con <strong>la</strong> comunidad.<br />
» Medio ambiente.<br />
» Consumidores o usuarios.<br />
» Re<strong>la</strong>ción con los trabajadores.<br />
• Estrategias <strong>de</strong> difusión <strong>de</strong> información sobre <strong>RSE</strong> <strong>de</strong> <strong>la</strong> empresa.<br />
• Capacidad insta<strong>la</strong>da en <strong>la</strong> empresa para el avance <strong>de</strong> <strong>la</strong> <strong>RSE</strong>.<br />
» Reportes <strong>de</strong> sustentabilidad.<br />
» Adhesión a estándares internacionales.<br />
» Cargo específico sobre <strong>RSE</strong>.<br />
» Adhesión a una entidad promotora <strong>de</strong> <strong>RSE</strong>.<br />
• Ambiente favorable o <strong>de</strong>sfavorable para el <strong>de</strong>sarrollo <strong>de</strong> <strong>la</strong> <strong>RSE</strong>.<br />
» Nivel <strong>de</strong> confianza en los distintos sectores (sólo para consumidores).<br />
» Opinión sobre <strong>la</strong> legis<strong>la</strong>ción en temas sociales y medioambientales.<br />
» Prácticas <strong>de</strong> consumo responsable (sólo para consumidores).<br />
• Información sobre <strong>la</strong> empresa: actividad económica, cantidad <strong>de</strong><br />
trabajadores, pertenencia al ranking <strong>de</strong> <strong>la</strong>s 500 más gran<strong>de</strong>s.
ESTADO DE LA <strong>RSE</strong> 2011 | 55<br />
Cuestionario utilizado para ejecutivos<br />
ESCOJA SU PAÍS (Seleccione una opción)<br />
Argentina Chile <strong>El</strong> Salvador Panamá Uruguay<br />
Bolivia Colombia Honduras Paraguay <strong>Estado</strong>s Unidos<br />
Brasil Costa Rica México Perú Venezue<strong>la</strong><br />
Canadá Ecuador Nicaragua Puerto Rico Otro<br />
IDIOMA (Seleccione una opción): Español/ Portugués<br />
INSTRUCCIONES<br />
Este cuestionario indaga <strong>la</strong> percepción <strong>de</strong> ejecutivos y consumidores<br />
<strong>de</strong> empresas que operan en América Latina sobre el estado <strong>de</strong> <strong>la</strong><br />
<strong>Responsabilidad</strong> <strong>Social</strong> Empresarial (<strong>RSE</strong>) en <strong>la</strong> región.<br />
• Respon<strong>de</strong>r <strong>de</strong>mora 15 minutos. <strong>El</strong> sistema reconoce el IP <strong>de</strong> su<br />
computador por lo que pue<strong>de</strong> respon<strong>de</strong>r en distintos momentos. Sin<br />
embargo sólo <strong>la</strong>s encuestas completas son válidas.<br />
• Pue<strong>de</strong>n respon<strong>de</strong>r empresas <strong>de</strong> todos los tamaños, industrias y<br />
niveles <strong>de</strong> <strong>RSE</strong>:<br />
» Respon<strong>de</strong> una persona por empresa, cada empresa <strong>de</strong>ci<strong>de</strong> quién<br />
respon<strong>de</strong>.<br />
» En el caso <strong>de</strong> multinacionales, el ejecutivo respon<strong>de</strong> por <strong>la</strong> filial <strong>de</strong><br />
su país.<br />
» En caso <strong>de</strong> empresas con más <strong>de</strong> una operación / unidad <strong>de</strong> negocios<br />
en un país, respon<strong>de</strong> un ejecutivo por cada operación / unidad<br />
<strong>de</strong> negocio <strong>de</strong> <strong>la</strong> empresa.<br />
• Todas <strong>la</strong>s respuestas son anónimas y confi<strong>de</strong>nciales.<br />
En agra<strong>de</strong>cimiento <strong>la</strong>s compañías que completen toda <strong>la</strong> encuesta<br />
recibirán: <strong>la</strong> publicación <strong>de</strong>l informe final en PDF, una invitación para<br />
el evento <strong>de</strong> <strong>la</strong>nzamiento <strong>de</strong>l mismo (webinar), y un pequeño informe<br />
confi<strong>de</strong>ncial y comparativo <strong>de</strong> los resultados <strong>de</strong> su empresa en re<strong>la</strong>ción<br />
a los promedios <strong>de</strong> América Latina, su país, e industria (enviado sólo<br />
al email que <strong>la</strong> empresa indique).
ESTADO DE LA <strong>RSE</strong> 2011 | 56<br />
Para más información sobre el proyecto visite www.empresa.org Para<br />
cualquier consulta, por favor escriba a: info@empresa.org<br />
TOMA DE DECISIONES Y TRANSPARENCIA<br />
Por favor señale su grado <strong>de</strong> acuerdo o <strong>de</strong>sacuerdo con <strong>la</strong>s siguientes<br />
afirmaciones: “Esta empresa…”<br />
(Muy en <strong>de</strong>sacuerdo / En <strong>de</strong>sacuerdo/ Ni en Acuerdo ni en Desacuerdo<br />
/ De acuerdo / Totalmente <strong>de</strong> Acuerdo / NS/NC)<br />
1. Incluye a representantes sindicales en su junta o consejo directivo.<br />
2. Cuenta con un código <strong>de</strong> ética que ha sido difundido a sus principales<br />
grupos <strong>de</strong> interés.<br />
3. Brinda incentivos económicos y/o no económicos a los ejecutivos<br />
que consi<strong>de</strong>ran <strong>la</strong> <strong>RSE</strong> en <strong>la</strong> toma <strong>de</strong> <strong>de</strong>cisiones.<br />
4. Dispone <strong>de</strong> políticas y prácticas para combatir <strong>la</strong> corrupción: los<br />
pagos adicionales para facilitar trámites, el soborno y <strong>la</strong> extorsión.<br />
5. Cuenta con criterios formales para <strong>de</strong>finir <strong>la</strong> financiación o apoyo<br />
a candidatos políticos.<br />
6. Posee procedimientos para evitar involucrarse o ser cómplice <strong>de</strong><br />
conductas anti-competencia.<br />
7. Posee un sistema <strong>de</strong> prevención <strong>de</strong> <strong>la</strong> vio<strong>la</strong>ción a los <strong>de</strong>rechos humanos<br />
en <strong>la</strong> organización y su ca<strong>de</strong>na <strong>de</strong> valor.<br />
8. Cuenta con métodos para integrar <strong>la</strong>s necesida<strong>de</strong>s <strong>de</strong> <strong>la</strong>s partes<br />
interesadas en su p<strong>la</strong>nificación.<br />
9. Su directorio tiene participación femenina.<br />
RELACIONES CON LA COMUNIDAD<br />
Por favor señale su grado <strong>de</strong> acuerdo o <strong>de</strong>sacuerdo con <strong>la</strong>s siguientes<br />
afirmaciones: “Esta empresa…”<br />
(Muy en <strong>de</strong>sacuerdo / En <strong>de</strong>sacuerdo/ Ni en Acuerdo ni en Desacuerdo<br />
/ De acuerdo / Totalmente <strong>de</strong> Acuerdo / NS/NC)<br />
10. Realiza inversiones para que <strong>la</strong>s comunida<strong>de</strong>s adquieran capacida<strong>de</strong>s<br />
para p<strong>la</strong>near, administrar recursos, evaluar, negociar y<br />
cooperar con otros actores.<br />
11. Consulta a <strong>la</strong> comunidad para <strong>de</strong>terminar <strong>la</strong>s priorida<strong>de</strong>s <strong>de</strong> <strong>la</strong><br />
inversión social que realiza.<br />
12. Consi<strong>de</strong>ra el impacto <strong>de</strong> sus <strong>de</strong>cisiones <strong>de</strong> inversión sobre <strong>la</strong> creación<br />
<strong>de</strong> empleo en <strong>la</strong>s comunida<strong>de</strong>s vecinas.
ESTADO DE LA <strong>RSE</strong> 2011 | 57<br />
13. Participa en activida<strong>de</strong>s que mejoran <strong>la</strong> calidad <strong>de</strong> <strong>la</strong> educación<br />
en <strong>la</strong> comunidad.<br />
14. Evita <strong>la</strong>s acciones que fomentan <strong>la</strong> <strong>de</strong>pen<strong>de</strong>ncia <strong>de</strong> <strong>la</strong> comunidad<br />
frente a <strong>la</strong> empresa.<br />
15. Prioriza <strong>la</strong> contratación <strong>de</strong> proveedores locales.<br />
16. Capacita a sus proveedores locales para que apliquen buenas<br />
prácticas <strong>de</strong> <strong>RSE</strong>.<br />
17. Contribuye con el acceso a servicios esenciales para <strong>la</strong> comunidad<br />
(salud, agua potable, servicios sanitarios, entre otros).<br />
18. Gestiona los impactos negativos para <strong>la</strong> salud <strong>de</strong> <strong>la</strong> comunidad en<br />
sus productos, servicios y procesos productivos.<br />
19. Cuenta con programas <strong>de</strong> voluntariado corporativo.<br />
20. Ejecuta proyectos en alianza con el sector público.<br />
MEDIO AMBIENTE<br />
Por favor señale su grado <strong>de</strong> acuerdo o <strong>de</strong>sacuerdo con <strong>la</strong>s siguientes<br />
afirmaciones: “Esta empresa…”<br />
(Muy en <strong>de</strong>sacuerdo / En <strong>de</strong>sacuerdo/ Ni en Acuerdo ni en Desacuerdo<br />
/ De acuerdo / Totalmente <strong>de</strong> Acuerdo / NS/NC)<br />
21. I<strong>de</strong>ntifica los impactos ambientales <strong>de</strong> sus operaciones.<br />
22. Posee prácticas e iniciativas que permite gestionar los impactos<br />
ambientales <strong>de</strong> sus operaciones.<br />
23. Incorpora tecnologías que disminuyan su impacto en el medio<br />
ambiente.<br />
24. Realiza el tratamiento <strong>de</strong> residuos sólidos y líquidos para prevenir<br />
<strong>la</strong> contaminación.<br />
25. Divulga ante <strong>la</strong> comunidad <strong>la</strong> cantidad y el tipo <strong>de</strong> materiales tóxicos<br />
y peligrosos que utiliza y libera <strong>de</strong>rivado <strong>de</strong> sus operaciones.<br />
26. Mi<strong>de</strong> <strong>la</strong>s emisiones <strong>de</strong> gases <strong>de</strong> efecto inverna<strong>de</strong>ro <strong>de</strong> sus operaciones.<br />
27. Complementa o reemp<strong>la</strong>za recursos no renovables con fuentes<br />
renovables alternativas <strong>de</strong> bajo impacto.<br />
28. Gestiona los recursos <strong>de</strong> agua asegurando un acceso justo para<br />
todos los usuarios <strong>de</strong>ntro <strong>de</strong> una cuenca hidrográfica.<br />
CONSUMIDORES O USUARIOS<br />
Por favor señale su grado <strong>de</strong> acuerdo o <strong>de</strong>sacuerdo con <strong>la</strong>s siguientes<br />
afirmaciones: “Esta empresa…”
ESTADO DE LA <strong>RSE</strong> 2011 | 58<br />
(Muy en <strong>de</strong>sacuerdo / En <strong>de</strong>sacuerdo/ Ni en Acuerdo ni en Desacuerdo<br />
/ De acuerdo / Totalmente <strong>de</strong> Acuerdo / NS/NC)<br />
29. Implementa medidas para minimizar los riesgos para <strong>la</strong> salud y<br />
seguridad <strong>de</strong>l consumidor.<br />
30. Retira <strong>de</strong>l mercado sus productos cuando presentan un peligro,<br />
un <strong>de</strong>fecto o tienen información falsa.<br />
31. Respeta <strong>la</strong> privacidad <strong>de</strong> los datos <strong>de</strong> sus consumidores o usuarios.<br />
32. Contro<strong>la</strong> que su publicidad no perpetúe estereotipos <strong>de</strong> género,<br />
orientación sexual, religión o raza.<br />
RELACIÓN CON TRABAJADORES<br />
Por favor señale su grado <strong>de</strong> acuerdo o <strong>de</strong>sacuerdo con <strong>la</strong>s siguientes<br />
afirmaciones: “Esta empresa…”<br />
(Muy en <strong>de</strong>sacuerdo / En <strong>de</strong>sacuerdo/ Ni en Acuerdo ni en Desacuerdo<br />
/ De acuerdo / Totalmente <strong>de</strong> Acuerdo / NS/NC)<br />
33. Proporciona condiciones favorables para <strong>la</strong> libertad <strong>de</strong> asociación<br />
y <strong>la</strong> negociación colectiva <strong>de</strong> los trabajadores.<br />
34. Informa y negocia con los trabajadores <strong>la</strong> manera <strong>de</strong> mitigar los<br />
impactos negativos al realizar cambios que afecten el empleo.<br />
35. Cuenta con igualdad <strong>de</strong> sa<strong>la</strong>rios para hombres y mujeres en un<br />
mismo cargo.<br />
36. Posee una política <strong>de</strong> integración <strong>de</strong> discapacitados a sus operaciones.<br />
37. Al contratar personal externo les brinda los mismos beneficios y<br />
condiciones <strong>la</strong>borales que a sus empleados.<br />
38. No tiene trabajo infantil en sus operaciones ni en <strong>la</strong>s <strong>de</strong> su ca<strong>de</strong>na<br />
<strong>de</strong> valor.<br />
39. Capacita a sus trabajadores en temas <strong>de</strong> <strong>RSE</strong> y sostenibilidad.<br />
40. Apoya el equilibrio entre el trabajo y <strong>la</strong> vida privada <strong>de</strong> sus trabajadores.<br />
41. Tiene programas que contribuyen al <strong>de</strong>sarrollo profesional <strong>de</strong> sus<br />
trabajadores.
ESTADO DE LA <strong>RSE</strong> 2011 | 59<br />
DIFUSIÓN DE INFORMACIÓN<br />
42.¿Su empresa publica estados financieros?<br />
43.¿Publica reportes <strong>de</strong> sustentabilidad?<br />
44.¿Utiliza <strong>la</strong> metodología <strong>de</strong>l GRI- Global Reporting<br />
Initiative para e<strong>la</strong>borar su reporte?<br />
45.¿Participan sus grupos <strong>de</strong> interés en <strong>la</strong> e<strong>la</strong>boración<br />
<strong>de</strong>l reporte?<br />
46.¿Cuenta su empresa con una estrategia/política<br />
<strong>de</strong> sustentabilidad/<strong>RSE</strong> escrita y difundida?<br />
Sí<br />
No NS/NC<br />
47. ¿Cuáles son <strong>la</strong>s principales estrategias <strong>de</strong> comunicación <strong>de</strong> <strong>la</strong><br />
<strong>RSE</strong> en su empresa?<br />
• Página web <strong>de</strong> <strong>la</strong> empresa.<br />
• Página web especial sobre <strong>RSE</strong>.<br />
• Re<strong>de</strong>s sociales.<br />
• Otra ¿Cuál?<br />
• NS/NC<br />
48¿A cuál <strong>de</strong> estos estándares adhiere su empresa?<br />
ISO 9000 / ISO 14000 / ISO 26000 / Pacto Global / Principios <strong>de</strong> Ecuador<br />
/ Lineamientos para Empresas Multinacionales OCDE / AA 8000 / AA<br />
1000 / OHSAS 18.001/ Estándares <strong>de</strong> <strong>de</strong>sempeño IFC / Indicadores<br />
Ethos /PLA<strong>RSE</strong> / Indica<strong>RSE</strong> / Otro / Ninguno/ NS/NC<br />
AMBIENTE FAVORABLE O DESFAVORABLE PARA EL DESARRO-<br />
LLO DE LA <strong>RSE</strong><br />
49.¿Cuáles son los principales obstáculos para el avance <strong>de</strong> <strong>la</strong> <strong>RSE</strong><br />
en su país?<br />
• Ambiente legal.<br />
• Régimen impositivo.<br />
• Actitud pública ante <strong>la</strong> <strong>RSE</strong>.<br />
• Falta <strong>de</strong> confianza en el sector privado.<br />
• Otro ¿Cuál?
ESTADO DE LA <strong>RSE</strong> 2011 | 60<br />
50. ¿Usted cree que el marco legal <strong>de</strong> su país es favorable para el<br />
avance <strong>de</strong> <strong>la</strong> <strong>RSE</strong>? Sí/No<br />
51. Usted cree que <strong>la</strong> regu<strong>la</strong>ción en temas <strong>la</strong>borales<br />
en su país <strong>de</strong>be:<br />
52.Usted cree que <strong>la</strong> regu<strong>la</strong>ción en temas medioambientales<br />
en su país <strong>de</strong>be:<br />
Incrementarse Mantenerse<br />
igual<br />
Disminuir NS/NC<br />
53. ¿Cómo calificaría a <strong>la</strong>s empresas <strong>de</strong> su país en su <strong>de</strong>sempeño en<br />
<strong>RSE</strong> en comparación a 2 años atrás?<br />
• Ha mejorado.<br />
• Se ha mantenido.<br />
• Ha empeorado.<br />
• NS/NC<br />
54. Usted consi<strong>de</strong>ra que en su país <strong>la</strong>s empresas que más han<br />
avanzado en <strong>RSE</strong> son:<br />
• Nacionales.<br />
• Filiales <strong>de</strong> Multinacionales.<br />
INFORMACIÓN GENERAL<br />
55. Principal actividad <strong>de</strong> <strong>la</strong> empresa (seleccione una opción)<br />
• Energía (electricidad, gas, petróleo).<br />
• Agua.<br />
• Comunicaciones.<br />
• Turismo, hoteles y restaurantes.<br />
• Activida<strong>de</strong>s <strong>de</strong> esparcimiento y activida<strong>de</strong>s culturales y <strong>de</strong>portivas.<br />
• Agricultura, gana<strong>de</strong>ría, pesca.<br />
• Manufacturas (alimenticios y bebidas, tabaco, textiles, cueros, papel,<br />
químicos, plástico, maquinaria, aparatos eléctricos, vehículos,<br />
recic<strong>la</strong>je).<br />
• Transporte y almacenamiento.<br />
• Servicios financieros y bancarios.<br />
• Servicios empresariales (seguros, asesoramientos).<br />
• Comercio.<br />
• Construcción.
ESTADO DE LA <strong>RSE</strong> 2011 | 61<br />
• Multi marcas- retail.<br />
• Educación, salud, y servicios sociales.<br />
• Minería.<br />
• Otro ¿Cuál?<br />
56.Cantidad <strong>de</strong> trabajadores <strong>de</strong> <strong>la</strong> empresa<br />
• Menos <strong>de</strong> 50.<br />
• Entre 51 y 100.<br />
• Entre 101 y 500.<br />
• Más <strong>de</strong> 500.<br />
57.¿Su empresa tiene encargado <strong>de</strong> <strong>RSE</strong>? ¿Cuál es su cargo?<br />
• Vicepresi<strong>de</strong>nte <strong>de</strong> <strong>RSE</strong>.<br />
• Gerente o Director <strong>de</strong> <strong>RSE</strong>.<br />
• Gerente <strong>de</strong> Marketing o Comunicaciones.<br />
• Gerente <strong>de</strong> Medioambiente y/o Desarrollo Sostenible.<br />
• Gerente <strong>de</strong> Recursos Humanos.<br />
• Otro ¿Cuál?<br />
• Ninguno.<br />
58.Nos interesa comparar el conjunto <strong>de</strong> empresas <strong>de</strong> América Latina<br />
con <strong>la</strong>s 500 más gran<strong>de</strong>s <strong>de</strong>l Ranking <strong>de</strong> América Economía 2011.<br />
¿Su empresa se encuentra en <strong>la</strong> siguiente lista? Sí / No<br />
59.Adhesión <strong>de</strong> <strong>la</strong> empresa a una organización <strong>de</strong> promoción <strong>de</strong> <strong>la</strong><br />
<strong>RSE</strong> (seleccione una o más opciones)<br />
Fundación <strong>de</strong>l Tucumán, IA<strong>RSE</strong>, o Forética, Acción <strong>RSE</strong>, Chile Fun<strong>de</strong>más, <strong>El</strong> Salvador Integrarse, Panamá Cedice, Venezue<strong>la</strong><br />
Argentina<br />
Fundación COBO<strong>RSE</strong> / Pacto Global, Bolivia Ceco<strong>de</strong>s o Fenalco Fundahrse, Honduras ADEC, Paraguay Otra (especifique)<br />
Solidario, Colombia<br />
Instituto Ethos, Brasil AED, Costa Rica Cemefi, México Perú 2021, Perú Ninguna<br />
CBSR, Canadá Red Ceres, Ecuador Unirse, Nicaragua DERES, Uruguay
ESTADO DE LA <strong>RSE</strong> 2011 | 62<br />
60.¿Qué cargo ocupa usted <strong>de</strong>ntro <strong>de</strong> su empresa?<br />
• Miembro <strong>de</strong>l consejo o junta directiva.<br />
• Gerente general.<br />
• Gerente <strong>de</strong> área.<br />
• Jefe <strong>de</strong> unidad o división.<br />
• Otro ¿Cuál?<br />
61.¿Cuánto tiempo ha estado vincu<strong>la</strong>do o estudiando temas <strong>de</strong> <strong>RSE</strong>?<br />
• Menos <strong>de</strong> 1 año.<br />
• 1 a 2 años.<br />
• 3 a 4 años.<br />
• 5 a 10 años.<br />
• No tengo contacto, experiencia y/o conocimiento <strong>de</strong>l tema.
ESTADO DE LA <strong>RSE</strong> 2011 | 63<br />
Cuestionario utilizado para consumidores<br />
En el mundo empresarial, hoy se suele utilizar el término “<strong>Responsabilidad</strong><br />
<strong>Social</strong> Empresarial” (o “<strong>Responsabilidad</strong> <strong>Social</strong> Corporativa”).<br />
¿Ha oído alguna vez esta expresión?<br />
• Sí, a<strong>de</strong>más sé lo que significa.<br />
• Sí, a<strong>de</strong>más intuyo lo que significa.<br />
• Sí, pero no sé lo que significa. (leer <strong>de</strong>scripción)<br />
• No, nunca lo he oído. (leer <strong>de</strong>scripción)<br />
Más allá <strong>de</strong> su respuesta, Ud. pue<strong>de</strong> seguir <strong>la</strong> encuesta y usar <strong>la</strong> opción<br />
No sabe/ No contesta (NS/NC) <strong>de</strong> ser necesario. Descripción:<br />
“(La responsabilidad social empresarial) Es una forma <strong>de</strong> enten<strong>de</strong>r<br />
<strong>la</strong> gestión empresarial por <strong>la</strong> que <strong>la</strong>s empresas comienzan a tener<br />
más en cuenta el impacto social y ambiental <strong>de</strong> su negocio, tratando<br />
<strong>de</strong> no sólo generar rentabilidad para los empresarios, sino también<br />
bienestar social. Para ello, tratan <strong>de</strong> tener en cuenta <strong>la</strong>s necesida<strong>de</strong>s<br />
y expectativas <strong>de</strong> los grupos sociales a los que afecta, directa o indirectamente,<br />
<strong>la</strong> actividad <strong>de</strong> <strong>la</strong> organización o empresa. 3 ”<br />
(Preguntar sólo a los que saben o intuyen lo que es <strong>RSE</strong>) ¿Con qué<br />
temas usted re<strong>la</strong>ciona <strong>la</strong> <strong>RSE</strong>? Seleccione al menos 1 y máximo 3.<br />
• Con gobierno corporativo, transparencia y rendición <strong>de</strong> cuentas.<br />
• Con el respeto a los <strong>de</strong>rechos humanos.<br />
• Con <strong>la</strong> buenas prácticas <strong>la</strong>borales.<br />
• Con <strong>la</strong> protección al medio ambiente.<br />
• Con <strong>la</strong> adopción <strong>de</strong> prácticas justas <strong>de</strong> operación.<br />
• Con <strong>la</strong> protección <strong>de</strong>l consumidor.<br />
• Con <strong>la</strong> participación activa y el aporte al <strong>de</strong>sarrollo <strong>de</strong> <strong>la</strong> comunidad.<br />
TOMA DE DECISIONES Y TRANSPARENCIA<br />
Por favor señale su grado <strong>de</strong> acuerdo o <strong>de</strong>sacuerdo con <strong>la</strong>s siguientes<br />
afirmaciones: “Las empresas <strong>de</strong> mi país…”<br />
3. Informe Forética (2011), Evolución <strong>de</strong> <strong>la</strong><br />
<strong>Responsabilidad</strong> <strong>Social</strong> <strong>de</strong> <strong>la</strong>s Empresas<br />
en España.<br />
(Muy en <strong>de</strong>sacuerdo / En <strong>de</strong>sacuerdo/ Ni en Acuerdo ni en Desacuerdo<br />
/ De acuerdo / Totalmente <strong>de</strong> Acuerdo / NS/NC)
ESTADO DE LA <strong>RSE</strong> 2011 | 64<br />
1. Integran a los representantes sindicales en sus procesos <strong>de</strong> toma<br />
<strong>de</strong> <strong>de</strong>cisiones.<br />
2. Cuentan con un código <strong>de</strong> ética que guía el actuar <strong>de</strong> <strong>la</strong> compañía.<br />
3. Incentivan que sus lí<strong>de</strong>res tomen en cuenta criterios <strong>de</strong> responsabilidad<br />
social en <strong>la</strong>s <strong>de</strong>cisiones que adoptan.<br />
4. Disponen <strong>de</strong> políticas y prácticas para combatir <strong>la</strong> corrupción y los<br />
sobornos.<br />
5. Tienen procedimientos para asegurar <strong>la</strong> libre competencia entre<br />
empresas.<br />
6. Respetan los <strong>de</strong>rechos humanos <strong>de</strong> clientes, trabajadores, proveedores,<br />
etc.<br />
7. Integran a <strong>la</strong>s mujeres en <strong>la</strong>s máximas esferas <strong>de</strong> <strong>la</strong> empresa (directorio,<br />
gerentes, ejecutivas <strong>de</strong> primera línea, etc.).<br />
RELACIONES CON LA COMUNIDAD<br />
Por favor señale su grado <strong>de</strong> acuerdo o <strong>de</strong>sacuerdo con <strong>la</strong>s siguientes<br />
afirmaciones: “Las empresas <strong>de</strong> mi país…”<br />
8. Realizan inversiones para que <strong>la</strong>s comunida<strong>de</strong>s adquieran capacida<strong>de</strong>s<br />
para p<strong>la</strong>near, administrar recursos, evaluar, negociar y<br />
cooperar con otros actores.<br />
9. Consultan a <strong>la</strong> comunidad para <strong>de</strong>terminar <strong>la</strong>s priorida<strong>de</strong>s <strong>de</strong> <strong>la</strong><br />
inversión social que realizan.<br />
10. Consi<strong>de</strong>ran el impacto <strong>de</strong> sus <strong>de</strong>cisiones <strong>de</strong> inversión sobre <strong>la</strong><br />
creación <strong>de</strong> empleo en <strong>la</strong>s comunida<strong>de</strong>s vecinas.<br />
11. Participan en activida<strong>de</strong>s que mejoran <strong>la</strong> calidad <strong>de</strong> <strong>la</strong> educación<br />
en <strong>la</strong> comunidad.<br />
12. Evitan <strong>la</strong>s acciones que fomentan <strong>la</strong> <strong>de</strong>pen<strong>de</strong>ncia <strong>de</strong> <strong>la</strong> comunidad<br />
frente a <strong>la</strong> empresa.<br />
13. Priorizan <strong>la</strong> contratación <strong>de</strong> proveedores locales.<br />
14. Contribuyen con el acceso a servicios esenciales para <strong>la</strong> comunidad<br />
(salud, agua potable, servicios sanitarios, entre otros).<br />
15. <strong>El</strong>iminan los impactos negativos para <strong>la</strong> salud <strong>de</strong> <strong>la</strong> comunidad en<br />
sus productos, servicios y procesos productivos.<br />
16. Cuentan con programas <strong>de</strong> voluntariado corporativo.<br />
17. Ejecutan proyectos en alianza con el sector público <strong>de</strong> mi país.<br />
MEDIO AMBIENTE<br />
Por favor señale su grado <strong>de</strong> acuerdo o <strong>de</strong>sacuerdo con <strong>la</strong>s siguientes<br />
afirmaciones: “Las empresas <strong>de</strong> mi país…”
ESTADO DE LA <strong>RSE</strong> 2011 | 65<br />
18. Toman en cuenta los impactos ambientales <strong>de</strong> sus operaciones al<br />
momento <strong>de</strong> tomar <strong>de</strong>cisiones.<br />
19. Poseen prácticas e iniciativas que permite gestionar los impactos<br />
ambientales <strong>de</strong> sus operaciones.<br />
20. Incorporan tecnologías que disminuyan su impacto en el medio<br />
ambiente.<br />
21. Realizan el tratamiento <strong>de</strong> residuos sólidos y líquidos para prevenir<br />
<strong>la</strong> contaminación que pue<strong>de</strong>n producir sus operaciones.<br />
22. Dan a conocer a <strong>la</strong> comunidad <strong>la</strong> cantidad y el tipo <strong>de</strong> materiales<br />
tóxicos y peligrosos que utilizan y liberan <strong>de</strong>rivado <strong>de</strong> <strong>la</strong>s operaciones.<br />
23. Gestionan los recursos <strong>de</strong> agua asegurando un acceso justo a este<br />
elemento vital para <strong>la</strong>s comunida<strong>de</strong>s.<br />
CONSUMIDORES O USUARIOS<br />
Por favor señale su grado <strong>de</strong> acuerdo o <strong>de</strong>sacuerdo con <strong>la</strong>s siguientes<br />
afirmaciones: “Las empresas <strong>de</strong> mi país…”<br />
24. Entregan información necesaria para que sus consumidores o<br />
usuarios tomen <strong>de</strong>cisiones <strong>de</strong> compra.<br />
25. Implementan medidas para minimizar los riesgos para <strong>la</strong> salud y<br />
seguridad <strong>de</strong> los consumidores o usuarios.<br />
26. Retiran <strong>de</strong>l mercado sus productos cuando presentan un peligro,<br />
un <strong>de</strong>fecto o tienen información falsa.<br />
27. Respetan <strong>la</strong> privacidad <strong>de</strong> los datos <strong>de</strong> sus consumidores o usuarios.<br />
28. Contro<strong>la</strong>n que los textos o imágenes no perpetúen estereotipos <strong>de</strong><br />
género, orientación sexual, religión o raza.<br />
RELACIÓN CON TRABAJADORES<br />
Por favor señale su grado <strong>de</strong> acuerdo o <strong>de</strong>sacuerdo con <strong>la</strong>s siguientes<br />
afirmaciones: “Las empresas <strong>de</strong> mi país…”<br />
29. Proporcionan condiciones favorables para el funcionamiento <strong>de</strong><br />
los sindicatos.<br />
30. Informan y negocian con los trabajadores <strong>la</strong> manera <strong>de</strong> mitigar<br />
los impactos negativos al realizar cambios que afecten el empleo.<br />
31. Cuentan con igualdad <strong>de</strong> sa<strong>la</strong>rios para hombres y mujeres en un<br />
mismo cargo.
ESTADO DE LA <strong>RSE</strong> 2011 | 66<br />
32. Al contratar personal externo, les brindan los mismos beneficios<br />
y condiciones <strong>la</strong>borales que a sus empleados.<br />
33. No tienen trabajo infantil en sus operaciones ni en <strong>la</strong>s operaciones<br />
<strong>de</strong> sus proveedores.<br />
34. Apoyan el equilibrio entre el trabajo y <strong>la</strong> vida privada <strong>de</strong> sus trabajadores.<br />
35. Tienen programas que contribuyen al <strong>de</strong>sarrollo profesional <strong>de</strong><br />
sus trabajadores.<br />
36. ¿Qué nivel <strong>de</strong> confianza le tiene a los siguientes sectores? (En<br />
cuanto a <strong>la</strong> veracidad <strong>de</strong> información y percepción sobre el sector).<br />
Esca<strong>la</strong> <strong>de</strong> 1 a 5, siendo 1 el menor y 5 el mayor.<br />
• Gobierno/organismos gubernamentales.<br />
• Sector privado (empresas).<br />
• ONGs/ sociedad civil.<br />
37. ¿Cómo calificaría a <strong>la</strong>s empresas <strong>de</strong> su país en su <strong>de</strong>sempeño en<br />
<strong>RSE</strong> a comparación <strong>de</strong> 2 años atrás?<br />
• Ha mejorado.<br />
• Se ha mantenido.<br />
• Ha empeorado.<br />
• NS/NC<br />
38. Usted consi<strong>de</strong>ra que en su país <strong>la</strong>s empresas que más han avanzado<br />
en <strong>RSE</strong> son:<br />
• Nacionales.<br />
• Filiales <strong>de</strong> multinacionales.<br />
39. ¿Cuál <strong>de</strong> <strong>la</strong>s siguientes industrias ha actuado <strong>de</strong> modo más responsable<br />
en los últimos 2 años?<br />
• Energía (electricidad, gas, petróleo).<br />
• Sanitarias.<br />
• Comunicaciones.<br />
• Turismo, hoteles y restaurantes.<br />
• Activida<strong>de</strong>s <strong>de</strong> esparcimiento y activida<strong>de</strong>s culturales y <strong>de</strong>portivas.<br />
• Agricultura, gana<strong>de</strong>ría, pesca.<br />
• Manufacturas (alimenticios y bebidas, tabaco, textiles, cueros, papel,<br />
químicos, plástico, maquinaria, aparatos eléctricos, vehículos,<br />
recic<strong>la</strong>je).<br />
• Transporte y almacenamiento.
ESTADO DE LA <strong>RSE</strong> 2011 | 67<br />
• Servicios financieros y bancarios.<br />
• Servicios empresariales (seguros, asesoramientos).<br />
• Comercio.<br />
• Construcción.<br />
• Multi marcas- retail.<br />
• Educación, salud, y servicios sociales.<br />
• Minería.<br />
• Otro ¿Cuál?<br />
• NS/NC<br />
40.¿Usted conoce los reportes <strong>de</strong> sostenibilidad? Sí / No<br />
41. (Preguntar sólo a aquellos que conoce los reportes <strong>de</strong> sostenibilidad)<br />
¿Cómo <strong>de</strong>scribiría el avance <strong>de</strong> <strong>la</strong> práctica <strong>de</strong> publicar reportes<br />
<strong>de</strong> sostenibilidad en su país?<br />
• Es una práctica adoptada por <strong>la</strong> mayoría <strong>la</strong>s empresas <strong>de</strong> mi país.<br />
• Es una práctica concentrada específicamente empresas multinacionales.<br />
• Es una práctica que realizan tanto empresas multinacionales como<br />
nacionales.<br />
• Es una práctica que realizan específicamente empresas nacionales.<br />
• Es una práctica que casi ninguna empresa realiza.<br />
• NS/NC<br />
AMBIENTE FAVORABLE O DESFAVORABLE PARA EL DESARRO-<br />
LLO DE LA <strong>RSE</strong><br />
42.¿Usted cree que el marco legal <strong>de</strong> su país es favorable para el<br />
avance <strong>de</strong> <strong>la</strong> <strong>RSE</strong>?<br />
Sí/ No<br />
43.¿Cuáles consi<strong>de</strong>ra usted que son los principales obstáculos para<br />
el avance <strong>de</strong> <strong>la</strong> <strong>RSE</strong> en su país? (Marque una o más opciones)<br />
• Ambiente legal.<br />
• Régimen impositivo.<br />
• Actitud pública ante <strong>la</strong> <strong>RSE</strong>.<br />
• Falta <strong>de</strong> confianza en el sector privado.<br />
• Otro ¿Cuál?<br />
• NS/NC
ESTADO DE LA <strong>RSE</strong> 2011 | 68<br />
44.Usted cree que <strong>la</strong> regu<strong>la</strong>ción en temas <strong>la</strong>borales<br />
en su país <strong>de</strong>be:<br />
45.Usted cree que <strong>la</strong> regu<strong>la</strong>ción en temas medioambientales<br />
en su país <strong>de</strong>be:<br />
Incrementarse Mantenerse<br />
igual<br />
Disminuir NS/NC<br />
PRÁCTICAS DE CONSUMO RESPONSABLE<br />
46. ¿Usted preferiría comprar un producto que sabe que fue e<strong>la</strong>borado<br />
con prácticas sociales y ambientalmente responsables, aunque<br />
tuviera un precio mayor?<br />
• Sí<br />
• No<br />
Si respon<strong>de</strong> sí<br />
47.¿Cuánto más estaría dispuesto a pagar por un producto e<strong>la</strong>borado<br />
con prácticas social y ambientalmente responsable?<br />
• Menos <strong>de</strong>l 5% más que el producto alternativo.<br />
• Entre un 6% y un 20% más que el producto alternativo.<br />
• 21% a 60% más que el producto alternativo.<br />
• Más <strong>de</strong>l 61% más que el producto alternativo.<br />
48.¿Usted cree que los consumidores <strong>de</strong> su país prefieren en general<br />
los productos e<strong>la</strong>borados con prácticas sociales y ambientalmente<br />
responsables? Sí / No<br />
INFORMACIÓN GENERAL<br />
49.¿Cuál <strong>de</strong> <strong>la</strong>s siguientes categorías <strong>de</strong>scribe mejor el sector al que<br />
Ud. pertenece?<br />
• Gobierno.<br />
• Organización sin fin <strong>de</strong> lucro.<br />
• Aca<strong>de</strong>mia.<br />
• Servicios organizacionales (consultores, periodistas, abogados, etc.).<br />
• Ciudadano / consumidor.<br />
• Otro… ¿Cuál?<br />
Si <strong>de</strong>sea recibir una el informe final <strong>de</strong>l estudio y ser invitado a un<br />
webinar (reunión virtual) <strong>de</strong> <strong>la</strong>nzamiento <strong>de</strong> los resultados, por favor<br />
indique un correo electrónico (OPCIONAL). Usted ha completado<br />
exitosamente <strong>la</strong> encuesta. ¡¡¡MUCHAS GRACIAS POR RESPONDER Y<br />
POR SU COLABORACIÓN!!!
ESTADO DE LA <strong>RSE</strong> 2011 | 69<br />
Pregunta por empresas en Ranking <strong>de</strong> 500 más gran<strong>de</strong>s en América Latina<br />
En el Cuestionario para Ejecutivos se incluyó <strong>la</strong> siguiente pregunta:<br />
“Nos interesa comparar el conjunto <strong>de</strong> empresas <strong>de</strong> América Latina<br />
con <strong>la</strong>s 500 más gran<strong>de</strong>s <strong>de</strong>l Ranking <strong>de</strong> América Economía 2011. Por<br />
favor indique si su empresa se encuentra en <strong>la</strong> siguiente lista”:<br />
Brasil Chile México<br />
Petrobras Distribuidora Enersis Pemex Refinación<br />
Vale Cencosud América Móvil<br />
Ultrapar Empresas Copec Wal-Mart <strong>de</strong> México<br />
O<strong>de</strong>brecht Enap Comisión Fe<strong>de</strong>ral <strong>de</strong> <strong>El</strong>ectricidad<br />
JBS Friboi Escondida Cemex<br />
Telemar Fa<strong>la</strong>bel<strong>la</strong> FEMSA<br />
Grupo Votorantim En<strong>de</strong>sa Pemex Gas y Petroquímica Básica<br />
<strong>El</strong>etrobrás D&S General Motors <strong>de</strong> México<br />
Gerdau CGE Telcel<br />
Cdb - Grupo Pão <strong>de</strong> Açúcar Lan Nissan Mexicana<br />
Ambev Col<strong>la</strong>huasi Teléfonos <strong>de</strong> México<br />
Carrefour CMPC Papeles y Cartones Grupo Bimbo<br />
Telefônica Brasil Arauco Chrysler<br />
Volkswagen Sudamericana <strong>de</strong> Vapores Grupo Alfa<br />
Fiat Automóveis Antofagasta Plc Grupo BAL<br />
Bunge Alimentos Mall P<strong>la</strong>za Volkswagen <strong>de</strong> México<br />
Wal-Mart Sodimac Coca - Co<strong>la</strong> Femsa<br />
Norberto O<strong>de</strong>brecht Chilectra Bo<strong>de</strong>ga Aurrerá<br />
Coca-Co<strong>la</strong> Los Pe<strong>la</strong>mbres Telmex Internacional<br />
Vivo Entel Organización Soriana<br />
BRF Foods Ripley Grupo Mo<strong>de</strong>lo<br />
Cargill Anglo American Sur Hewlett - Packard México<br />
Telesp Agrosuper Wal-Mart Supercenter<br />
Grupo Camargo Corrêa Jumbo Ford Motor Company
ESTADO DE LA <strong>RSE</strong> 2011 | 70<br />
Brasil Chile México<br />
Nestlé Aes Gener Sam’s Club<br />
Braskem Fasa Grupo Carso<br />
General Motors Santa Isabel Grupo México<br />
Tim Celu<strong>la</strong>r CCU Cemex México<br />
Grupo Arcelormittal Movistar Grupo Salinas<br />
Andra<strong>de</strong> Gutierrez Participações Embotel<strong>la</strong>dora Andina<br />
Contro<strong>la</strong>dora Mabe<br />
Ipiranga Produtos <strong>de</strong> Petroleo Shell Chile Comercial Mexicana<br />
Cosan Sigdo Koppers Oxxo (Femsa Comercio)<br />
C<strong>la</strong>ro Telecom SQM Grupo Televisa<br />
Cemig CAP Alpek<br />
Unilever Telefónica Chile Grupo Maseca<br />
Correios E Telégrafos Petrobras Pemex Petroquímica<br />
CSN Entel Pcs Grupo Pepsico<br />
Usiminas Enami Grupo Industrial La<strong>la</strong><br />
Brasil Telecom Empresas Banmédica <strong>El</strong> Puerto <strong>de</strong> Liverpool<br />
Embraer CGE Distribución Cervecería Cuauhtémoc<br />
Moctezuma<br />
Embratel Quiñenco Industrias Peñoles<br />
CPFL Energía Minera Valparaíso Sanmina - Sci Systems <strong>de</strong> México<br />
Extra Anglo American Norte Nestlé <strong>de</strong> México<br />
Casas Bahia Colbún Grupo <strong>El</strong>ektra<br />
TAM Salfacorp Almacenes Coppel<br />
Marfrig CMPC Tissue Delphi Automotive Systems<br />
Ford Can<strong>de</strong><strong>la</strong>ria Industrias Peñoles - Metals<br />
Refap - Alberto Pasqualini Xstrata Copper Chile S.A. Minera México<br />
E<strong>de</strong>lnor<br />
Flextronics Manufacturing
ESTADO DE LA <strong>RSE</strong> 2011 | 71<br />
Argentina Colombia Perú<br />
Techint Ecopetrol Refinería La Pampil<strong>la</strong><br />
YPF Almacenes Éxito Telefónica <strong>de</strong>l Perú<br />
Tenaris Organización Terpel Petroperú<br />
Cargill Comcel Southern Perú Copper Corp.<br />
Ternium Exxonmobil Minera Yanacocha<br />
Bunge Grupo Nac. <strong>de</strong> Choco<strong>la</strong>tes Minera Antamina<br />
Carrefour<br />
Empresas Públicas <strong>de</strong> Me<strong>de</strong>llín Minera Cerro Ver<strong>de</strong><br />
Cencosud Refinería <strong>de</strong> Cartagena IFH Perú - Grupo Interbank<br />
Telecom Bavaria Holding Alimentario <strong>de</strong>l Perú<br />
Petrobras Energía Telefónica Colombia Aje Group<br />
Pan American Energy Carrefour Alicorp<br />
Aceitera General Deheza Grupo Bavaria Barrick Misquichilca<br />
Volkswagen Avianca Consorcio Minero Cormin<br />
Movistar Grupo Argos Movistar<br />
C<strong>la</strong>ro Drummond Fa<strong>la</strong>bel<strong>la</strong> Perú<br />
Arcor<br />
Molinos Río <strong>de</strong> La P<strong>la</strong>ta<br />
Shell Capsa<br />
Ford<br />
Peugeot - Citroën<br />
Grupo ISA<br />
Carbones Del Cerrejón<br />
Co<strong>de</strong>nsa<br />
Olímpica<br />
Chevron Petroleum Company<br />
Venezue<strong>la</strong> Ecuador Costa Rica Panamá<br />
PDVSA Petroecuador Recope Autoridad Del Canal De Panamá<br />
Pequiven Supermercados La Favorita Intel Copa Airlines<br />
Cantv Conecel Grupo Ice<br />
Movistar<br />
Sivensa
ESTADO DE LA <strong>RSE</strong> 2011 | 72<br />
Anexo II: Listado <strong>de</strong> Entida<strong>de</strong>s Promotoras <strong>de</strong> <strong>RSE</strong> en América Latina<br />
A continuación presentamos una lista con <strong>la</strong>s entida<strong>de</strong>s <strong>de</strong> promoción<br />
<strong>de</strong> <strong>la</strong> <strong>RSE</strong> en los países que participaron en el estudio 2011.<br />
Las entida<strong>de</strong>s incluidas en los países Argentina, Chile, Colombia y<br />
México se tomaron <strong>de</strong>l “Mapeo <strong>de</strong> Promotores <strong>de</strong> <strong>RSE</strong>” disponible en<br />
http://www.mapeo-rse.info/ 4 .<br />
ARGENTINA<br />
AMARTYA<br />
ACDE (Asociación Cristiana <strong>de</strong> Dirigentes <strong>de</strong> Empresas)<br />
AFRAS (Asociación Franquicia Sustentable)<br />
ALTERNATIVA 3<br />
AmCham (American Chamber)<br />
AMIA (Asociación Mutual Israelita Argentina)<br />
BAIREXPORT<br />
BID (Banco Interamericano <strong>de</strong> Desarrollo)<br />
CAF (Corporación Andina <strong>de</strong> Fomento)<br />
Cámara <strong>de</strong> Industria y Comercio Argentino-Alemana<br />
CCI (Cámara <strong>de</strong> Comercio Internacional)<br />
CCIFA (Cámara <strong>de</strong> Comercio e Industria Franco Argentina)<br />
CEADS (Consejo Empresario Argentino para el<br />
Desarrollo Sostenible)<br />
CEER (Consejo Empresario <strong>de</strong> Entre Ríos)<br />
CENA<strong>RSE</strong>CS (Centro Nacional <strong>de</strong> <strong>Responsabilidad</strong><br />
<strong>Social</strong> Empresarial y Capital <strong>Social</strong>)<br />
Comunica<strong>RSE</strong><br />
Foro Ecuménico <strong>Social</strong><br />
Foro Empresarial <strong>de</strong> <strong>la</strong> Patagonia<br />
Gobierno <strong>de</strong> <strong>la</strong> Ciudad Autónoma <strong>de</strong> Buenos Aires<br />
Empresas por <strong>la</strong> Infancia<br />
EticAgro<br />
FARN (Fundación Ambiente y Recursos Naturales)<br />
FCA (Fundación Carolina Argentina)<br />
FOC (Fundación Organización Comunitaria)<br />
FORETICA ARGENTINA<br />
Fundación Avina Argentina<br />
Fundación <strong>Compromiso</strong><br />
Fundación <strong>de</strong>l Tucumán<br />
Fundación <strong>El</strong> Otro<br />
Fundación Export.Ar<br />
http://www.amartya.org.ar/<br />
http://www.ac<strong>de</strong>.org.ar<br />
http://www.franquiasolidaria.com.br/portal/in<strong>de</strong>x.php?AFRAS-Argentina<br />
http://www.alternativa3.org/<br />
http://www.amchamar.com.ar<br />
http://www.amia.org.ar/<br />
http://www.bairexport.com<br />
http://www.iadb.org/es/paises/argentina/argentina-y-el-bid,1011.html<br />
http://www.caf.com<br />
http://www.ahkargentina.com/argentina/<br />
http://www.iccwbo.org/id15216/<br />
http://www.ccifa.com.ar/<br />
http://www.ceads.org.ar/<br />
http://www.ceer.org/<br />
http://www.econ.uba.ar/<br />
http://www.comunicarseweb.com.ar<br />
http://www.foroecumenico.com.ar/<br />
http://www.foropatagonia.com/<br />
http://buenosaires.gov.ar/<br />
http://www.empresasx<strong>la</strong>infancia.org/<br />
http://www.eticagro.com.ar/<br />
http://www.farn.org.ar/<br />
http://www.fundacioncarolina.org.ar<br />
http://www.fundacionfoc.org.ar/<br />
http://www.foretica.com.ar/<br />
http://www.avina.net/esp/<br />
http://www.compromiso.org/<br />
http://www.fundacion<strong>de</strong>ltucuman.org.ar/<br />
http://www.elotro.org.ar/<br />
http://exportar.org.ar/<br />
4. En <strong>la</strong> e<strong>la</strong>boración <strong>de</strong> este listado participaron Angélique Turboust, estudiante <strong>de</strong>l Instituto<br />
<strong>de</strong> Estudios Politicos <strong>de</strong> Lille, Francia y Lauren Terrazas, estudiante <strong>de</strong> <strong>la</strong> Universidad <strong>de</strong><br />
California, Santa Barbara, USA.
ESTADO DE LA <strong>RSE</strong> 2011 | 73<br />
ARGENTINA<br />
Fundación Premio Nacional a <strong>la</strong> Calidad<br />
FUNDES (Fundación para el Desarrollo Sostenible<br />
Argentina)<br />
FVSA (Fundación Vida Silvestre Argentina)<br />
GDFE (Grupo <strong>de</strong> Fundaciones y Empresas)<br />
IA<strong>RSE</strong><br />
IESC (Instituto <strong>de</strong> Estudios para <strong>la</strong> Sustentabilidad<br />
Corporativa)<br />
INADI (Instituto Nacional contra <strong>la</strong> Discriminación, <strong>la</strong><br />
Xenofobia y el Racismo)<br />
INTI (Instituto Nacional <strong>de</strong> Tecnología Industrial)<br />
IRAM (Instituto Argentino <strong>de</strong> Normalización)<br />
Revista Futuro Sustentable<br />
La Usina<br />
Move<strong>RSE</strong> (Movimiento hacia <strong>la</strong> <strong>Responsabilidad</strong> <strong>Social</strong><br />
Empresaria)<br />
MTEySS (Ministerio <strong>de</strong> Trabajo, Empleo y Seguridad<br />
<strong>Social</strong> <strong>de</strong> <strong>la</strong> Nación)<br />
Nuevos Aires<br />
Periodismo <strong>Social</strong><br />
Po<strong>de</strong>r Ciudadano<br />
Proconsumer (Protección Consumidores <strong>de</strong>l Mercado<br />
Común <strong>de</strong>l Sur)<br />
Red Argentina <strong>de</strong>l Pacto Global<br />
Red Puentes Argentina<br />
SES (Fundación Sustentabilidad, Educación,<br />
Solidaridad)<br />
Sinergia<br />
Tercer Sector<br />
UADE (Universidad Argentina <strong>de</strong> <strong>la</strong> Empresa)<br />
UCES (Universidad <strong>de</strong> Ciencias Empresariales y<br />
<strong>Social</strong>es)<br />
UDESA (Universidad <strong>de</strong> San Andrés)<br />
UTN (Universidad Tecnológica Nacional)<br />
Va <strong>de</strong> Vuelta<br />
Valos<br />
Visión Sustentable<br />
BOLIVIA<br />
AHKBOL<br />
Avina Bolivia<br />
CANEB<br />
http://www.premiocalidad.org.ar/<br />
http://www.fun<strong>de</strong>s.org/<br />
http://www.vidasilvestre.org.ar/<br />
http://www.gdfe.org.ar/<br />
http://www.iarse.org<br />
http://www.sustentabilidad.org.ar/<br />
http://inadi.gob.ar/<br />
http://www.inti.gov.ar/<br />
http://www.iram.org.ar/<br />
http://www.futurosustentable.com.ar/<br />
http://www.<strong>la</strong>usina.org/<br />
http://www.moverse.org/<br />
http://www.trabajo.gob.ar/<br />
http://nuevosairesac.wordpress.com/<br />
http://www.periodismosocial.org.ar/<br />
http://po<strong>de</strong>rciudadano.org/<br />
http://www.proconsumer.org.ar/<br />
http://www.pactoglobal.org.ar/<br />
http://www.redpuentes.org/<br />
http://www.fundses.org.ar/<br />
http://revista-sinergia.com/<br />
http://www.tercersector.org.ar/<br />
http://www.ua<strong>de</strong>.edu.ar/<br />
http://www.uces.edu.ar/<br />
http://www.u<strong>de</strong>sa.edu.ar/<br />
http://www.utn.edu.ar<br />
http://va<strong>de</strong>vuelta.wordpress.com/<br />
http://www.valos.org.ar/<br />
http://www.visionsustentable.com.ar<br />
http://www.ahkbol.com/<br />
http://www.avina.net/esp/Bolivia.aspx<br />
http://www.caneb.org.bo/
ESTADO DE LA <strong>RSE</strong> 2011 | 74<br />
BOLIVIA<br />
CNDA (Cámara Nacional <strong>de</strong> Despachantes <strong>de</strong> Aduanas)<br />
CNI (Cámara Nacional <strong>de</strong> Industrias)<br />
COBO<strong>RSE</strong> (Fundación Corporación Boliviana <strong>de</strong><br />
<strong>Responsabilidad</strong> <strong>Social</strong> Empresarial)<br />
Gobierno Autónomo Departamental <strong>de</strong> Santa Cruz<br />
IBCE (Instituto Boliviano <strong>de</strong> Comercio Exterior)<br />
IDB Bolivia (Banco Interamericano <strong>de</strong> Desarrollo)<br />
INE (Instituto Nacional <strong>de</strong> Estadística <strong>de</strong> Bolivia)<br />
Red Bolivia Empren<strong>de</strong>dora<br />
<strong>RSE</strong> Bolivia<br />
SNV Bolivia<br />
UAGRM (Facultad <strong>de</strong> Ciencias Económicas y<br />
Financieras)<br />
UAGRM (Universidad Autónoma Gabriel René Moreno)<br />
Universidad Nur<br />
http://www.cnda.net.bo/cnda/<br />
http://www.bolivia-industry.com/<br />
http://www.coborse.org/<br />
http://www.santacruz.gob.bo/<br />
http://www.ibce.org.bo/<br />
http://www.iadb.org/en/countries/bolivia/bolivia-and-the-idb,1086.html<br />
http://www.ine.gob.bo/<br />
http://www.boliviaempren<strong>de</strong>dora.org.bo/<br />
http://www.rsebolivia.org/<br />
http://www.postgradoeconomia-uagrm.edu.bo/<br />
http://www.uagrm.edu.bo/<br />
http://www.nur.edu/<br />
BRASIL<br />
Avina Brasil<br />
BNDES (Banco Brasileño <strong>de</strong> Desarrollo)<br />
CEBDS (Consejo Empresarial Brasileño para el Desarrollo<br />
Sostenible)<br />
Empresa Pro-ética<br />
FDC (Fundaçao Dom Cabral)<br />
FGV (Fundación Getúlio Vargas)<br />
Forum Clima<br />
GIFE (Grupo <strong>de</strong> Institutos, Foundações e Empresas)<br />
IADB Brasil (Inter-American Development Bank)<br />
Ibase (Instituto Brasilerio <strong>de</strong> Analises Sociais e Economicas)<br />
Instituto Ethos<br />
Jogos Limpos<br />
MEB (Movimiento empresarial pe<strong>la</strong> biodiversida<strong>de</strong>)<br />
Pacto Global Re<strong>de</strong> Brasileira<br />
Red Nossa Sao Paulo<br />
CHILE<br />
Acción <strong>RSE</strong><br />
AmCham (Cámara Chileno-Norteamericana <strong>de</strong> Comercio)<br />
ASCH (Asociación Chilena <strong>de</strong> Seguridad)<br />
BID (Banco Interamericano <strong>de</strong> Desarrollo)<br />
http://www.avina.net/esp/Brasil.aspx<br />
http://www.bn<strong>de</strong>s.gov.br/SiteBNDES/bn<strong>de</strong>s/bn<strong>de</strong>s_es/<br />
http://www.cebds.org.br/cebds/<br />
http://www.cgu.gov.br/empresaproetica/<br />
http://www.fdc.org.br/es<br />
http://portal.fgv.br/<br />
http://www.forumempresarialpeloclima.org.br/<strong>de</strong>fault.php<br />
http://www.gife.org.br/<br />
http://www.iadb.org/en/countries/brazil/brazil-and-theidb,1002.html<br />
http://www.ibase.br/pt/<br />
http://www1.ethos.org.br<br />
http://www.jogoslimpos.org.br/<br />
http://www.mebbrasil.org.br/<strong>de</strong>fault.aspx<br />
http://www.pactoglobal.org.br/<br />
http://www.nossasaopaulo.org.br/portal/<br />
http://www.accionrse.cl/<br />
http://www.amchamchile.cl/<br />
http://ww3.achs.cl<br />
http://www.iadb.org/es/paises/chile/chile-y-el-bid,1090.html
ESTADO DE LA <strong>RSE</strong> 2011 | 75<br />
CHILE<br />
CCHC (Cámara Chilena <strong>de</strong> <strong>la</strong> Construcción)<br />
CCI (Cámara <strong>de</strong> Comercio Internacional Chile)<br />
CEDEM (Centro <strong>de</strong> Estudios para el Desarrollo <strong>de</strong> <strong>la</strong> Mujer)<br />
CENDA (Centro <strong>de</strong> Estudios Nacionales <strong>de</strong> Desarrollo<br />
Alternativo)<br />
Chile Transparente<br />
CORFO (Corporación <strong>de</strong> Fomento a <strong>la</strong> Producción)<br />
Corporación Domos<br />
Corporación Pro O´Higgins<br />
CPC (Confe<strong>de</strong>ración <strong>de</strong> <strong>la</strong> Producción y <strong>de</strong>l Comercio)<br />
CUT (Central Unitaria <strong>de</strong> Trabajadores)<br />
FSC (Forest Stewardship Council)<br />
Fundación Avina Chile<br />
Fundación Casa <strong>de</strong> <strong>la</strong> Paz<br />
Fundación Chile<br />
Fundación PROhumana<br />
FUNDES (Fundación para el Desarrollo Sostenible Chile)<br />
INN (Instituto Nacional <strong>de</strong> Normalización)<br />
ODECU (Organización <strong>de</strong> Consumidores y Usarios <strong>de</strong> Chile)<br />
Pontificia Universidad Católica <strong>de</strong> Chile<br />
Red Pacto Global Chile<br />
Red Puentes Chile<br />
SENCE (Servicio Nacional <strong>de</strong> Capacitación y Empleo)<br />
SERNAGEOMIN (Servicio Nacional <strong>de</strong> Geología y Minería)<br />
SERNAM (Servicio Nacional <strong>de</strong> <strong>la</strong> Mujer)<br />
SOFOFA (Sociedad <strong>de</strong> Fomento Fabril)<br />
UNAB (Universidad Andrés Bello)<br />
Universidad Adolfo Ibáñez<br />
Universidad Alberto Hurtado<br />
USEC (Unión <strong>Social</strong> <strong>de</strong> Empresarios Cristianos)<br />
Vincu<strong>la</strong>r<br />
WWF (World Wildlife Fund)<br />
http://www.cchc.cl/<br />
http://www.iccwbo.org/id15230/in<strong>de</strong>x.html<br />
http://www.ce<strong>de</strong>m.cl/ce<strong>de</strong>m.htm<br />
http://www.cendachile.cl/<br />
http://www.chiletransparente.cl/<br />
http://www.corfo.cl/<br />
http://www.domoschile.cl/<br />
http://www.pro-ohiggins.cl/<br />
http://www.cpc.cl/<br />
http://www.cutchile.cl/<br />
http://www.fsc-chile.org/<br />
http://www.avina.net/esp/<br />
http://www.casa<strong>de</strong><strong>la</strong>paz.cl/<br />
http://www.fundacionchile.com/<br />
http://www.prohumana.cl/<br />
http://www.fun<strong>de</strong>s.org/<br />
http://www3.inn.cl/portada/in<strong>de</strong>x.php<br />
http://www.o<strong>de</strong>cu.cl/<br />
http://www.uc.cl/<br />
http://www.pactoglobal.cl/<br />
http://www.redpuentes.org/<br />
http://www.sence.cl/sence/<br />
http://www.sernageomin.cl/<br />
http://portal.sernam.cl/<br />
http://web.sofofa.cl/<br />
http://www.unab.cl/<br />
http://www.uai.cl/<br />
http://www.uahurtado.cl/<br />
http://www.usec.cl/<br />
http://www.vincu<strong>la</strong>r.cl/<br />
http://chile.panda.org/<br />
COLOMBIA<br />
Alcaldía Mayor <strong>de</strong> Bogotá<br />
http://www.bogota.gov.co<br />
ACOPI (Asociación Colombiana <strong>de</strong> Medianas y Pequeñas http://www.acopi.org.co/<br />
Industrias)<br />
AmCham Colombia (Cámara <strong>de</strong> Comercio Colombo-americana) http://www.amchamcolombia.com.co/<br />
ANDESCO (Asociación Nacional <strong>de</strong> Empresas <strong>de</strong> Servicios http://www.an<strong>de</strong>sco.com<br />
Públicos Domiciliarios y Actividad)<br />
Andi (Asociación Nacional <strong>de</strong> Empresarios <strong>de</strong> Colombia) http://www.andi.com.co/<br />
Asolcolflores (Asociación Colombiana <strong>de</strong> Exportadores <strong>de</strong> Flores) http://www.asocolflores.org/
ESTADO DE LA <strong>RSE</strong> 2011 | 76<br />
COLOMBIA<br />
BID (Banco Interamericano <strong>de</strong>l Desarrollo en Colombia) http://www.iadb.org/es/paises/colombia/colombia-y-elbid,1026.html<br />
CAF (Corporación Andina <strong>de</strong> Fomento en Colombia)<br />
http://www.caf.com/view/in<strong>de</strong>x.asp?ms=0<br />
CAMACOL (Cámara Colombiana <strong>de</strong> <strong>la</strong> Construcción <strong>de</strong> http://www.camaco<strong>la</strong>ntioquia.org.co/<br />
Antioquia)<br />
CCB (Cámara <strong>de</strong> Comercio <strong>de</strong> Bogotá)<br />
http://www.ccb.org.co<br />
CCI (Cámara <strong>de</strong> Comercio Internacional Colombia)<br />
http://www.iccwbo.org/id15236/<br />
CCRE (Centro Colombiano <strong>de</strong> <strong>Responsabilidad</strong> Empresarial) http://www.ccre.org.co/<br />
CECODES (Consejo Empresarial Colombiano para el Desarrollo http://www.ceco<strong>de</strong>s.org.co/<br />
Sostenible)<br />
CECORP (Centro Colombiano <strong>de</strong> Re<strong>la</strong>ciones Públicas y http://www.cecorp.org<br />
Comunicación Organizacional)<br />
CNP (Centro Nacional <strong>de</strong> Productividad)<br />
http://www.cnp.org.co/<br />
Colombia Incluyente<br />
http://www.colombiaincluyente.org<br />
Comfamiliar Hui<strong>la</strong> (Caja <strong>de</strong> Compensación Familiar <strong>de</strong>l Hui<strong>la</strong>) http://comfamiliarhui<strong>la</strong>.com/<br />
Comfandi (Caja <strong>de</strong> Compensación Familiar <strong>de</strong>l Valle <strong>de</strong>l Cauca) http://www.comfandi.com.co/<br />
Confecámaras (Confe<strong>de</strong>ración Colombiana <strong>de</strong> Cámaras <strong>de</strong> Comercio) http://www.confecamaras.org.co/<br />
CONFECOOP (Confe<strong>de</strong>ración <strong>de</strong> Cooperativas <strong>de</strong> Colombia) http://www.confecoop.coop/<br />
Cornare<br />
http://www.cornare.gov.co/<br />
Corporación Fenalco Solidario<br />
http://www.fenalcosolidario.com<br />
Corporación Transparencia por Colombia<br />
http://www.transparenciacolombia.org.co/<br />
EIA (Escue<strong>la</strong> <strong>de</strong> Ingenieria <strong>de</strong> Antioquia)<br />
http://www.eia.edu.co/site/<br />
ExE (Fundación Empresarios por <strong>la</strong> Educacion)<br />
http://www.fundacionexe.org.co/wps/<br />
FCC (Fundación Carolina Colombia)<br />
http://www.fundacioncarolina.org.co<br />
Fe<strong>de</strong>ración Nacional <strong>de</strong> Comerciantes (FENALCO)<br />
http://www.fenalco.com.co<br />
FIP (Fundación I<strong>de</strong>as para <strong>la</strong> Paz)<br />
http://www.i<strong>de</strong>aspaz.org/portal/<br />
FNC (Fe<strong>de</strong>racion Nacional <strong>de</strong> Cafeteros <strong>de</strong> Colombia) http://www.fe<strong>de</strong>racion<strong>de</strong>cafeteros.org/<br />
Fundación Avina Colombia<br />
http://www.avina.net/esp/<br />
Fundación Berta Martínez<br />
http://www.bertamartinez.org/<br />
Fundación <strong>El</strong> Cinco<br />
http://www.elcinco.org/<br />
FUNDES (Fundación para el Desarrollo Sostenible Colombia) http://www.fun<strong>de</strong>s.org/?cnty=1005&<strong>la</strong>ng=<br />
ICONTEC (Instituto Colombiano <strong>de</strong> Normas Técnicas y http://www.icontec.org.co/<br />
Certificación)<br />
La República<br />
http://www.<strong>la</strong>republica.co/<br />
MAVDT (Ministerio <strong>de</strong> Ambiente, Vivienda y Desarollo Territorial) http://www.minambiente.gov.co/portal/<strong>de</strong>fault.aspx<br />
Ministerio <strong>de</strong> Comercio, Industria y Turismo <strong>de</strong> Colombia https://www.mincomercio.gov.co/<br />
Pontificia Universidad Javeriana<br />
http://puj-portal.javeriana.edu.co/<br />
Proantioquia (Fundación para el Progreso <strong>de</strong> Antiquia) http://www.proantioquia.org.co/<br />
Promotora <strong>de</strong> Comercio <strong>Social</strong><br />
http://www.promotora<strong>de</strong>comerciosocial.com.co<br />
Red Colombiana <strong>de</strong>l Pacto Mundial<br />
http://www.unglobalcompact.org/NetworksAroundTheWorld/<br />
local_network_sheet/CO.html<br />
Revista RS (<strong>Responsabilidad</strong> Sostenibilidad)<br />
http://rsrevista.com/revistars/<br />
RI Colombia (<strong>Responsabilidad</strong> Integral)<br />
http://www.responsabilidadintegral.org/
ESTADO DE LA <strong>RSE</strong> 2011 | 77<br />
COLOMBIA<br />
Superinten<strong>de</strong>ncia <strong>de</strong> Socieda<strong>de</strong>s<br />
UEC (Universidad Externado <strong>de</strong> Colombia)<br />
UN (Universidad Nacional <strong>de</strong> Colombia)<br />
Unian<strong>de</strong>s (Universidad <strong>de</strong> los An<strong>de</strong>s)<br />
Universidad <strong>de</strong>l Norte<br />
Universidad <strong>de</strong>l Rosario Colombia<br />
COSTA RICA<br />
AED (Asociación Empresarial para el Desarrollo)<br />
Aliarse para el Desarrollo<br />
Avina Costa Rica<br />
CCNRS (Consejo Consultivo Nacional <strong>de</strong> <strong>Responsabilidad</strong> <strong>Social</strong><br />
Costa Rica)<br />
CEGESTI (Desarrollo Integral Sostenible Costa Rica)<br />
CICR (Cámara <strong>de</strong> Industrias <strong>de</strong> Costa Rica)<br />
CIDH (International Center for Sustainable Human Development)<br />
COOPEMEX<br />
IDB Costa Rica (Banco Interamericano <strong>de</strong> Desarrollo)<br />
IFAM<br />
INCAE<br />
Ministerio <strong>de</strong> Economía Industria y Comercio<br />
Ministerio <strong>de</strong> P<strong>la</strong>nificación Nacional y Política Económica<br />
http://www.supersocieda<strong>de</strong>s.gov.co/ss/drvisapi.<br />
dll?MIval=ppal&dir=90<br />
http://portal.uexternado.edu.co<br />
http://www.unal.edu.co/<br />
http://www.unian<strong>de</strong>s.edu.co/<br />
http://www.uninorte.edu.co/<br />
http://www.urosario.edu.co/<br />
http://www.aedcr.com/cmsma<strong>de</strong>simple/<br />
http://www.aliarse.org/<br />
http://www.avina.net/esp/Costa-Rica.aspx<br />
http://www.ccnrs.com/<br />
http://www.aedcr.com/cmsma<strong>de</strong>simple/<br />
http://www.aliarse.org/<br />
http://www.avina.net/esp/Costa-Rica.aspx<br />
http://www.ccnrs.com/<br />
http://www.cegesti.org/<br />
http://www.cicr.com/<br />
http://www.cidh.ac.cr/<br />
http://www.coopemex.fi.cr/nosotros/empresas/GECR/<br />
cooperativas/in<strong>de</strong>x.php<br />
http://www.iadb.org/en/countries/costa-rica/costa-rica-andthe-idb,1068.html<br />
http://www.ifam.go.cr/<br />
http://www.incae.edu/<br />
http://www.meic.go.cr/<br />
http://www.mi<strong>de</strong>p<strong>la</strong>n.go.cr/
ESTADO DE LA <strong>RSE</strong> 2011 | 78<br />
COSTA RICA<br />
Red Pacto Global Costa Rica<br />
Universidad Nacional Costa Rica, Escue<strong>la</strong> <strong>de</strong> Re<strong>la</strong>ciones<br />
Internacionales<br />
ECUADOR<br />
CERES (Consorcio Ecuatoriano para <strong>la</strong> <strong>Responsabilidad</strong> <strong>Social</strong>)<br />
Acorvol<br />
Agencia Municipal <strong>de</strong> Desarrollo Económico<br />
AIESEC<br />
Andra<strong>de</strong> & Asociados<br />
Avina Ecuador<br />
Cámara <strong>de</strong> Comercio <strong>de</strong> Quito<br />
Cámara <strong>de</strong> Comercio <strong>de</strong> Quito<br />
Cámara <strong>de</strong> Industrias <strong>de</strong> Guayaquil<br />
Cámara <strong>de</strong> Industrias y Comercio Ecuatoriano-Alemana<br />
Care Ecuador<br />
CEDA (Centro Ecuatoriano <strong>de</strong> Derecho Ambiental)<br />
CEMDES (Consejo Empresarial para el Desarrollo Sostenible)<br />
CERES (Consorcio Ecuatoriano para <strong>la</strong> <strong>Responsabilidad</strong> <strong>Social</strong>)<br />
CORPEI<br />
ESPOL (Escue<strong>la</strong> Superior Politécnica <strong>de</strong>l Litoral)<br />
Fem<strong>de</strong>s (Fundación <strong>de</strong> Empresarios para el Desarrollo <strong>Social</strong>)<br />
FLACSO (Facultad Latinoamericana <strong>de</strong> Ciencias <strong>Social</strong>es Se<strong>de</strong><br />
Ecuador)<br />
Fondo Ambiental Nacional<br />
Fundación Charles Darwin<br />
Fundación Esquel<br />
Fundación Huancavilca<br />
Fundación Leonidas Ortega Moreira<br />
Fundación Mariana <strong>de</strong> Jesús<br />
Fundación Natura<br />
IDB Ecuador (Banco Interamericano <strong>de</strong> Desarrollo)<br />
Inclusys<br />
INNFA (Instituto Nacional <strong>de</strong>l Niño y <strong>la</strong> Familia)<br />
I<strong>RSE</strong> (Instituto <strong>de</strong> <strong>Responsabilidad</strong> <strong>Social</strong> Empresarial)<br />
Patronato Municipal San José Quito<br />
P<strong>la</strong>taforma <strong>de</strong> <strong>Responsabilidad</strong> <strong>Social</strong> Ecuador<br />
Red <strong>de</strong>l Pacto Global en Ecuador<br />
SENDAS<br />
SESO (Sociedad Ecuatoriana <strong>de</strong> Seguridad, Salud Ocupacional y<br />
Gestión Ambiental)<br />
http://www.pnud.or.cr/in<strong>de</strong>x.php?option=com_content&view=<br />
section&<strong>la</strong>yout=blog&id=19&Itemid=103<br />
http://www.ri.una.ac.cr/<br />
http://www.redceres.org/<br />
http://acorvol.org/<br />
http://www.conquito.org.ec/<br />
http://www.aiesec.org/ecuador/<br />
http://www.andra<strong>de</strong>asociados.org/<br />
http://www.avina.net/esp/Ecuador.aspx<br />
http://www.<strong>la</strong>camara<strong>de</strong>quito.com/<br />
http://www.ccq.org.ec/<br />
http://www.cig.org.ec/inicio.ks<br />
http://ecuador.ahk.<strong>de</strong>/es/<br />
http://www.care.org.ec/webcare/<br />
http://www.ceda.org.ec/<br />
http://www.cem<strong>de</strong>s.org/<br />
http://www.redceres.org/<br />
http://www.corpei.org<br />
http://www.espol.edu.ec/<br />
http://www.f<strong>la</strong>cso.org.ec/portal/<br />
http://www.fan.org.ec/<br />
http://www.darwinfoundation.org/english/pages/in<strong>de</strong>x.php<br />
http://www.esquel.org.ec/<br />
http://huancavilca.org.ec/page/inicio.htm<br />
http://www.flom.org.ec/<br />
http://www.fmdj.org/<br />
http://www.fnatura.org/<br />
http://www.iadb.org/en/countries/ecuador/ecuador-and-theidb,1065.html<br />
http://www.inclusys.com.ec/<br />
http://www.oei.es/linea3/inicial/ecuadorne.htm#2<br />
http://www.irse-ec.org/<br />
http://www.quito.gov.ec/el-municipio/fundaciones/<br />
fundacionpatronato.html<br />
http://www.p<strong>la</strong>taformaresponsabilidadsocial.org/<br />
http://www.pactoglobal.ec/<br />
http://www.sendas.org.ec/sendas/<br />
http://www.seso.org.ec/<strong>de</strong>fault.htm
ESTADO DE LA <strong>RSE</strong> 2011 | 79<br />
ECUADOR<br />
Universidad Casa Gran<strong>de</strong><br />
Universidad <strong>de</strong>l Pacífico<br />
Universidad Espíritu Santo<br />
UTPL (Universidad Técnica Particu<strong>la</strong>r <strong>de</strong> Loja)<br />
EL SALVADOR<br />
FUNDEMAS (Fundación Empresarial para <strong>la</strong> Acción <strong>Social</strong>)<br />
FUSADES (Fundación Salvadoreña para el Desarrollo Económico<br />
y <strong>Social</strong>)<br />
IADB <strong>El</strong> Salvador (Banco Interamericano <strong>de</strong> Desarrollo)<br />
HONDURAS<br />
Asociación Nacional <strong>de</strong> Industriales<br />
Cámara <strong>de</strong> Comercio e Industrias <strong>de</strong> Choloma, CCICH<br />
Cámara <strong>de</strong> Comercio e Industrias <strong>de</strong> Cortés, CCIC<br />
Cámara <strong>de</strong> Comercio e Industrias <strong>de</strong> Tegucigalpa, CCIT<br />
Cámara <strong>de</strong> Comercio Hondureño-Americana<br />
Care Honduras<br />
CEHDES (Consejo Empresarial Hondureño para el Desarrollo<br />
Sostenible)<br />
Centro Nacional <strong>de</strong> Producción Más Limpia <strong>de</strong> Honduras<br />
Consejo Empresarial <strong>de</strong> América Latina, Capítulo Honduras<br />
Consejo Hondureño <strong>de</strong> <strong>la</strong> Empresa Privada, COHEP<br />
FUNDAH<strong>RSE</strong><br />
IADB Honduras (Banco Interamericano <strong>de</strong> Desarrollo)<br />
Ministerio <strong>de</strong> Desarrollo <strong>Social</strong><br />
Organismo Hondureño <strong>de</strong> Normalización<br />
Un Techo para Mi País<br />
United Way Honduras<br />
Voces Vitales Honduras<br />
MÉXICO<br />
Acciona<strong>RSE</strong><br />
Alia<strong>RSE</strong> (Alianza por <strong>la</strong> <strong>Responsabilidad</strong> <strong>Social</strong> Empresarial en<br />
México)<br />
ANIQ (Asociación Nacional <strong>de</strong> Industria Química)<br />
http://www.casagran<strong>de</strong>.edu.ec/<br />
http://www.upacifico.edu.ec<br />
http://www.uees.edu.ec<br />
http://www.utpl.edu.ec/<br />
http://www.fun<strong>de</strong>mas.org/<br />
http://www.fusa<strong>de</strong>s.org/<br />
http://www.iadb.org/en/countries/el-salvador/el-salvadorand-the-idb,1062.html<br />
http://www.ceh<strong>de</strong>s.org/principal.html<br />
http://www.cnpml-honduras.org<br />
http://www.iadb.org/en/countries/honduras/honduras-andthe-idb,1053.html<br />
http://www.ccit.hn/<br />
http://www.amchamhonduras.org/<br />
http://www.care.org<br />
http://www.ceh<strong>de</strong>s.org/<br />
http://www.cnpml-honduras.org/<br />
http://www.ceal-int.org/ESP/capitulos/honduras.html<br />
http://www.cohep.com/<br />
http://www.fundahrse.org/<br />
http://www.iadb.org/en/countries/honduras/honduras-andthe-idb,1053.html<br />
http://<strong>de</strong>sarrollosocial.gob.hn/<br />
http://www.hondurascalidad.org/normalizacion.htm<br />
http://www.untechoparamipais.org/<br />
http://www.unitedwayhonduras.org/<br />
http://www.vitalvoices.org/<br />
http://accionarse.blogspot.com/<br />
http://www.aliarse.org.mx/<br />
http://www.aniq.org.mx/
ESTADO DE LA <strong>RSE</strong> 2011 | 80<br />
MÉXICO<br />
BID en México (Banco Interamericano <strong>de</strong> Desarrollo)<br />
CANACEM (Cámara Nacional <strong>de</strong>l Cemento)<br />
CCI México (Cámara <strong>de</strong> Comercio Internacional)<br />
CEMEFI (Centro Mexicano para <strong>la</strong> Fi<strong>la</strong>ntropía)<br />
Centro IDEA<strong>RSE</strong> para <strong>la</strong> <strong>Responsabilidad</strong> y Sustentabilidad <strong>de</strong><br />
<strong>la</strong> Empresa<br />
CERTIFOR (Sociedad para <strong>la</strong> Promoción <strong>de</strong>l Manejo Forestal<br />
Sostenible)<br />
CESPEDES (Centro <strong>de</strong> Estudios <strong>de</strong>l Sector Privado para el<br />
Desarrollo Sustentable)<br />
CETIFARMA (Consejo <strong>de</strong> Ética y Transparencia <strong>de</strong> <strong>la</strong> Industria<br />
Farmacéutica)<br />
CJM (Comercio Justo México)<br />
COMPITE (Comité Nacional <strong>de</strong> Productividad e Innovación<br />
Tecnológica)<br />
CONAES (Consejo Nacional Empresarial sobre el Sida)<br />
CONAPRED (Consejo Nacional para <strong>la</strong> Prevención <strong>de</strong> <strong>la</strong><br />
Discriminación)<br />
CONCAMIN (Confe<strong>de</strong>ración <strong>de</strong> Cámaras Industriales <strong>de</strong> los<br />
<strong>Estado</strong>s Unidos Mexicanos)<br />
COPARMEX (Confe<strong>de</strong>ración Patronal <strong>de</strong> <strong>la</strong> República Mexicana)<br />
DGN (Dirección General <strong>de</strong> Normas)<br />
FECHAC (Fundación <strong>de</strong>l Empresariado Chihuahuense)<br />
Fundación Carolina México<br />
Fundación Comunitaria Querétaro<br />
FUNDEMEX (Fundación <strong>de</strong>l Empresariado en México A.C.)<br />
FUNTEC (Fundación Mexicana para <strong>la</strong> Innovación y<br />
Transferencia <strong>de</strong> Tecnología en <strong>la</strong> Pequeña y Mediana Empresa)<br />
Ganar-Ganar<br />
IMNC (Instituto Mexicano <strong>de</strong> Normalización y Certificación)<br />
Inmujeres (Instituto <strong>de</strong> <strong>la</strong>s Mujeres <strong>de</strong> <strong>la</strong> Ciudad <strong>de</strong> México)<br />
ITESM (Instituto Tecnológico <strong>de</strong> Estudios Superiores <strong>de</strong> Monterrey)<br />
PROFECO (Procuraduría Fe<strong>de</strong>ral <strong>de</strong> Protección al Consumidor)<br />
PROFEPA (Procuraduría Fe<strong>de</strong>ral <strong>de</strong> Protección al Ambiente)<br />
Red <strong>de</strong>l Pacto Mundial en México<br />
Red Puentes México<br />
SEMARNAT (Secretaría <strong>de</strong> Medio Ambiente y Recursos Naturales )<br />
STPS (Secretaría <strong>de</strong>l Trabajo y Previsión <strong>Social</strong>)<br />
TM (Transparencia Mexicana)<br />
UIA (Universidad Iberoamericana)<br />
USEM (Unión <strong>Social</strong> <strong>de</strong> Empresarios <strong>de</strong> México)<br />
WWF México (World Wildlife Fund)<br />
http://www.iadb.org/en/countries/mexico/mexico-and-theidb,1048.html<br />
http://www.canacem.org.mx/<br />
http://www.iccmex.mx/<br />
http://www.cemefi.org/spanish/in<strong>de</strong>x.php<br />
http://www.anahuac.mx/i<strong>de</strong>arse/<br />
http://www.mx.fsc.org/<br />
http://www.cce.org.mx/cespe<strong>de</strong>s/<br />
http://www.canifarma.org.mx/<br />
http://www.comerciojusto.com.mx/<br />
http://www.compite.org.mx/<br />
http://twitter.com/#!/CONAESMX<br />
http://www.conapred.org.mx/<br />
http://www.concamin.org.mx/<br />
http://www.coparmex.org.mx/<br />
http://www.economia.gob.mx/swb/swb/<br />
http://www.fechac.org/web/in<strong>de</strong>x.php<br />
http://www.fundacioncarolina.es/es-ES/Paginas/in<strong>de</strong>x.aspx<br />
http://www.fundacionqueretaro.org/<br />
http://www.fun<strong>de</strong>mex.org.mx/<br />
http://www.funtec.org/<br />
http://www.ganar-ganar.com.mx/<br />
http://www.imnc.org.mx/<br />
http://www.inmujeres.gob.mx/<br />
http://www.itesm.edu<br />
http://www.profeco.gob.mx/<br />
http://www.profepa.gob.mx/<br />
http://www.pactomundial.org.mx/home/<br />
http://www.redpuentes.org/in<strong>de</strong>x.php?option=com_content&t<br />
ask=view&id=23&Itemid=22<br />
http://www.semarnat.gob.mx<br />
http://www.stps.gob.mx<br />
http://www.transparenciamexicana.org.mx/<br />
http://www.uia.mx/<br />
http://www.usem.org.mx/<br />
http://www.wwf.org.mx/wwfmex/
ESTADO DE LA <strong>RSE</strong> 2011 | 81<br />
NICARAGUA<br />
Uni<strong>RSE</strong><br />
ANIFODA (Asociación Nicaragüense <strong>de</strong> Formu<strong>la</strong>dores y<br />
Distribuidores <strong>de</strong> Agroquímicos)<br />
APEN (Asociación <strong>de</strong> Productores y Exportadores <strong>de</strong> Nicaragua)<br />
Avina Nicaragua<br />
CONIMIPYME<br />
COSEP (Consejo Superior <strong>de</strong> <strong>la</strong> Empresa Privada en Nicaragua)<br />
CPML Nicaragua (Centro <strong>de</strong> producción más limpia)<br />
IADB Nicaragua (Banco Interamericano <strong>de</strong> Desarrollo)<br />
ProPemce<br />
PANAMÁ<br />
Suma<strong>RSE</strong><br />
CEDIS (Centro Empresarial <strong>de</strong> Inversión <strong>Social</strong>)<br />
IADB Panama (Banco Interamericano <strong>de</strong> Desarrollo)<br />
Integrarse<br />
PARAGUAY<br />
ADEC (Asociación <strong>de</strong> Empresarios Cristianos)<br />
Avina Paraguay<br />
IADB Paraguay (Banco Interamericano <strong>de</strong> Desarrollo)<br />
Red Pacto Global Paraguay<br />
<strong>Responsabilidad</strong> <strong>Social</strong> Empresarial Paraguay<br />
PERÚ<br />
Perú 2021<br />
AmCham (Cámara <strong>de</strong> Comercio Americana <strong>de</strong>l Perú)<br />
Cámara <strong>de</strong> Comercio <strong>de</strong> Lima<br />
Cámara <strong>de</strong> Comercio Peruano Nórdica<br />
Cámara <strong>de</strong> Comercio y Producción <strong>de</strong> Piura<br />
Cámara <strong>de</strong> Comercio y Producción La Libertad<br />
Centro <strong>de</strong> Investigación <strong>de</strong> <strong>la</strong> Universidad <strong>de</strong>l Pacífico<br />
Comunidad CODERE<br />
CONFIEP (Confe<strong>de</strong>ración Nacional <strong>de</strong> Instituciones<br />
Empresariales Privadas)<br />
DGEE (Dirección General <strong>de</strong> Eficiencia Energética)<br />
Grupo GEA Desarrollo Sustentable<br />
http://www.unirse.org/<br />
http://anifoda.org/<br />
http://www.apen.org.ni/<br />
http://www.avina.net/esp/Nicaragua.aspx<br />
http://www.conimipyme.org.ni/<br />
http://www.cosep.org.ni/<br />
http://www.pml.org.ni/<br />
http://www.iadb.org/en/countries/nicaragua/nicaragua-andthe-idb,1045.html<br />
http://www.propemce.org.ni/<br />
http://www.sumarse.org.pa/<br />
www.cedis.org.pa<br />
http://www.iadb.org/en/countries/panama/panama-and-theidb,1042.html<br />
http://www.integrarse.org.pa/<br />
http://www.a<strong>de</strong>c.org.py/<br />
http://www.avina.net/esp/Paraguay.aspx<br />
http://www.iadb.org/en/countries/paraguay/paraguay-andthe-idb,1039.html<br />
http://www.pactoglobal.org.py/<br />
http://www.rse.org.py/<br />
http://www.peru2021.org/<br />
http://www.amcham.org.pe/<br />
http://www.camaralima.org.pe/<br />
http://www.camaranordica.org.pe<br />
http://www.camcopiura.org.pe/<br />
http://www.camaratru.org.pe/<br />
http://www.up.edu.pe/ciup/<strong>de</strong>fault.aspx<br />
http://www.comunidadco<strong>de</strong>re.com.ar/rsc.php<br />
http://confiep.org.pe/<br />
http://www.minem.gob.pe/<strong>de</strong>scripcion.php?idSector=12&idTit<br />
u<strong>la</strong>r=3011&idMenu=sub3001&idCateg=716#<br />
http://www.grupogea.org.pe/
ESTADO DE LA <strong>RSE</strong> 2011 | 82<br />
PERÚ<br />
IADB Perú (Banco Interamericano <strong>de</strong> Desarrollo)<br />
INGEMMET (Instituto Geológico Minero y Metalúrgico)<br />
IPAE (Instituto Peruano <strong>de</strong> Administración <strong>de</strong> Empresas)<br />
Pontificia Universidad Católica <strong>de</strong>l Perú<br />
Red <strong>de</strong> <strong>Responsabilidad</strong> <strong>Social</strong><br />
Red Pacto Mundial Perú<br />
Revista RSA (<strong>Responsabilidad</strong> <strong>Social</strong> & Ambiental)<br />
SASE Consultores (Seguimiento <strong>de</strong> Análisis y Evaluación para el<br />
Desarrollo)<br />
Tecsup<br />
Universidad Católica San Pablo<br />
Universidad <strong>de</strong> Piura<br />
Universidad <strong>de</strong>l Pacífico<br />
UPAO Trujillo Perú (Universidad Privada Antenor Orrego)<br />
URUGUAY<br />
DERES (Desarrollo <strong>de</strong> <strong>la</strong> <strong>Responsabilidad</strong> <strong>Social</strong>)<br />
ACDE (Asociación Cristiana <strong>de</strong> Dirigentes <strong>de</strong> Empresa)<br />
ADM (Asociación <strong>de</strong> Dirigentes <strong>de</strong> Marketing <strong>de</strong>l Uruguay)<br />
ADPUGH (Asociación <strong>de</strong> Profesionales Uruguayos <strong>de</strong> Gestión<br />
Humana)<br />
APPCU (Asociación <strong>de</strong> Promotores Privados <strong>de</strong> <strong>la</strong> Construcción<br />
<strong>de</strong>l Uruguay)<br />
Avina Uruguay<br />
Cámara <strong>de</strong> Industrias <strong>de</strong>l Uruguay<br />
Cámara Nacional <strong>de</strong> Comercio y Servicios<br />
CCEAU (Colegio <strong>de</strong> Contadores, Economistas y Administradores<br />
<strong>de</strong>l Uruguay)<br />
CEMPRE (<strong>Compromiso</strong> Empresarial Para el Recic<strong>la</strong>je)<br />
IADB Uruguay (Inter-American Development Bank)<br />
Red Pacto Global Uruguay<br />
UNIT (Instituto Uruguayo <strong>de</strong> Normas Técnicas)<br />
Universidad Católica <strong>de</strong>l Uruguay<br />
VENEZUELA<br />
CEDICE (<strong>El</strong> Centro <strong>de</strong> Divulgación <strong>de</strong>l Conocimiento Económico)<br />
CEVEDES (Consejo empresarial Venezo<strong>la</strong>no para el Desarrollo<br />
Sostenible)<br />
IADB Venezue<strong>la</strong> (Inter-American Development Bank)<br />
<strong>RSE</strong> Venezue<strong>la</strong><br />
Venamcham<br />
http://www.tecsup.edu.pe/webuds/web/principal<br />
http://www.ucsp.edu.pe/<br />
http://u<strong>de</strong>p.edu.pe/<br />
http://www.up.edu.pe<br />
http://www.upao.edu.pe/<br />
http://www.iadb.org/en/countries/peru/peru-and-theidb,1037.html<br />
http://www.ingemmet.gob.pe/<br />
http://escue<strong>la</strong>.ipae.pe/<br />
http://www.pucp.edu.pe/content/in<strong>de</strong>x.php<br />
http://www.responsabilidadsocialperu.org/<br />
http://www.pactomundial.confiep.org.pe/<br />
http://rsarevista.pe/<br />
http://www.sase.com.pe/<br />
http://www.<strong>de</strong>res.org.uy/home/home.php<br />
http://www.ac<strong>de</strong>.org.uy/<br />
http://www.adm.com.uy/home/<br />
http://www.adpu.org/<br />
http://www.appcu.org/<br />
http://www.avina.net/esp/Uruguay.aspx<br />
http://www.ciu.com.uy/innovaportal/v/31344/1/innova.front/<br />
http://www.cncs.com.uy/<br />
http://www2.ccea.com.uy/colegio/<br />
http://www.cempre.org.uy/<br />
http://www.iadb.org/en/countries/uruguay/uruguay-and-theidb,1028.html<br />
http://centroregionalpmal.org/in<strong>de</strong>x-0311.html<br />
http://www.unit.org.uy/<br />
http://www.ucu.edu.uy/<br />
http://www.cedice.org.ve/<br />
http://www.cenda.usb.ve<br />
http://www.iadb.org/en/countries/venezue<strong>la</strong>/venezue<strong>la</strong>-andthe-idb,1027.html<br />
http://rsevenezue<strong>la</strong>.com/<br />
http://www.venamcham.org/
ESTADO DE LA <strong>RSE</strong> 2011 | 83<br />
PATROCINADORES DEL ESTUDIO:<br />
PATROCINADORES DE LA RED FORUM EMPRESA:<br />
ENTIDADES ADHERENTES AL ESTUDIO:<br />
MEDIOS ALIADOS:<br />
Descarga el estudio en: www.empresa.org<br />
Download the study: www.empresa.org