- Page 2 and 3:
Las Mujeres en el Distrito Federal.
- Page 4 and 5:
ÍndiceIntroducción1.2.3.4.5.6.7.8
- Page 6:
diversos motivos se analiza la entr
- Page 10:
Tasa de crecimiento promedio anual
- Page 14 and 15:
POBLACIÓN E ÍNDICE DE MASCULINIDA
- Page 16 and 17:
Población total por grupo quinquen
- Page 18 and 19:
Tasa de crecimiento promedio anual
- Page 20 and 21:
Índice de masculinidad por grupo d
- Page 22 and 23:
Índice de masculinidad en las enti
- Page 24 and 25:
POBLACIÓN FEMENINA POR DELEGACIÓN
- Page 26 and 27:
ÍNDICE DE MASCULINIDAD POR DELEGAC
- Page 28 and 29:
Volumen y porcentaje de participaci
- Page 30 and 31:
Promedio de hijos nacidos vivos de
- Page 32 and 33:
Promedio de hijos nacidos vivos de
- Page 34 and 35:
POBLACIÓN FEMENINA DE 12 Y MÁS A
- Page 36 and 37:
PROMEDIO DE HIJOS NACIDOS VIVOS DE
- Page 38 and 39:
4.MigraciónLa migración es una fo
- Page 40 and 41:
Población nacida en otra entidad,
- Page 42 and 43:
Población emigrante cinco años an
- Page 44 and 45:
Población de 15 y más años por n
- Page 46 and 47:
Población nacida en otro país, po
- Page 48 and 49:
Al comparar con los hombres surgen
- Page 50 and 51:
POBLACIÓN TOTAL POR ENTIDAD DE RES
- Page 52 and 53:
POBLACIÓN DE 5 Y MÁS AÑOS RESIDE
- Page 54 and 55:
POBLACIÓN FEMENINA DE 5 Y MÁS AÑ
- Page 56 and 57:
5. Estado conyugalLos roles familia
- Page 58 and 59:
Población de 12 y más años, por
- Page 60 and 61:
La información por grupo de edad p
- Page 62 and 63:
Población de 12 y más años casad
- Page 64 and 65:
La ruptura del vínculo conyugal de
- Page 66 and 67:
Si bien se observa que la proporci
- Page 68 and 69:
POBLACIÓN DE 12 Y MÁS AÑOS, POR
- Page 70 and 71:
POBLACIÓN FEMENINA DE 12 Y MÁS A
- Page 72 and 73:
POBLACIÓN DE 12 Y MÁS AÑOS CASAD
- Page 74 and 75:
POBLACIÓN DE 12 Y MÁS AÑOS OCUPA
- Page 76 and 77:
6. Características educativasLa ed
- Page 78 and 79:
INEGI. Las Mujeres en el Distrito F
- Page 80 and 81:
Población de 8 a 14 años que no s
- Page 82 and 83:
Población analfabeta para cada gru
- Page 84 and 85:
INEGI. Las Mujeres en el Distrito F
- Page 86 and 87:
INEGI. Las Mujeres en el Distrito F
- Page 88 and 89:
Población de 18 y más años con e
- Page 90 and 91:
INEGI. Las Mujeres en el Distrito F
- Page 92 and 93:
POBLACIÓN DE 6 A 14 AÑOS QUE ASIS
- Page 94 and 95:
POBLACIÓN DE 5 A 24 AÑOS QUE ASIS
- Page 96 and 97:
POBLACIÓN MASCULINA DE 6 A 14 AÑO
- Page 98 and 99:
POBLACIÓN DE 15 Y MÁS AÑOS TOTAL
- Page 100 and 101:
POBLACIÓN FEMENINA DE 15 Y MÁS A
- Page 102 and 103:
POBLACIÓN DE 18 Y MÁS AÑOS CON I
- Page 104 and 105:
POBLACIÓN DE 15 Y MÁS AÑOS, POR
- Page 106 and 107:
Población de 5 y más años hablan
- Page 108 and 109:
Población de 5 y más años hablan
- Page 110 and 111:
Población de 5 y más años que ha
- Page 112 and 113:
Entre ambos sexos se observan difer
- Page 114 and 115:
POBLACIÓN DE 5 Y MÁS AÑOS POR GR
- Page 116 and 117:
POBLACIÓN DE 5 Y MÁS AÑOS QUE HA
- Page 120 and 121:
Población de 5 y más años con re
- Page 122 and 123:
Población de 5 y más años con re
- Page 124 and 125:
POBLACIÓN DE 5 Y MÁS AÑOS POR SE
- Page 126 and 127: POBLACIÓN DE 5 Y MÁS AÑOS POR DE
- Page 128 and 129: DISTRIBUCIÓN PORCENTUAL DE LA POBL
- Page 130 and 131: 9. Características económicasEste
- Page 132 and 133: Tasa de participación económicapo
- Page 134 and 135: Tasa de participación económica e
- Page 136 and 137: Población ocupada por sexo1990 y 2
- Page 138 and 139: Población ocupada masculinapor ocu
- Page 140 and 141: Población ocupada por sexo según
- Page 142 and 143: Población femenina ocupada por ram
- Page 144 and 145: Población ocupada por horas trabaj
- Page 146 and 147: Población asalariada por tipo de p
- Page 148 and 149: TASA DE PARTICIPACIÓN ECONÓMICA Y
- Page 150 and 151: POBLACIÓN DE 12 Y MÁS AÑOS, POR
- Page 152 and 153: TASA DE PARTICIPACIÓN ECONÓMICA,
- Page 154 and 155: TASA DE PARTICIPACIÓN ECONÓMICA,
- Page 156 and 157: POBLACIÓN NO ECONÓMICAMENTE ACTIV
- Page 158 and 159: POBLACIÓN OCUPADA POR OCUPACIÓN P
- Page 160 and 161: POBLACIÓN OCUPADA POR SITUACIÓN E
- Page 162 and 163: POBLACIÓN FEMENINA OCUPADA POR DEL
- Page 164 and 165: POBLACIÓN MASCULINA OCUPADA POR DE
- Page 166 and 167: POBLACIÓN OCUPADA POR RAMA DE ACTI
- Page 168 and 169: POBLACIÓN OCUPADA POR HORAS TRABAJ
- Page 170 and 171: POBLACIÓN OCUPADA POR GRUPOS DE IN
- Page 172 and 173: 10. DerechohabienciaLa atención de
- Page 174 and 175: Población derechohabiente por grup
- Page 178 and 179: POBLACIÓN TOTAL POR SEXO Y GRUPOS
- Page 180 and 181: POBLACIÓN MASCULINA POR DELEGACIÓ
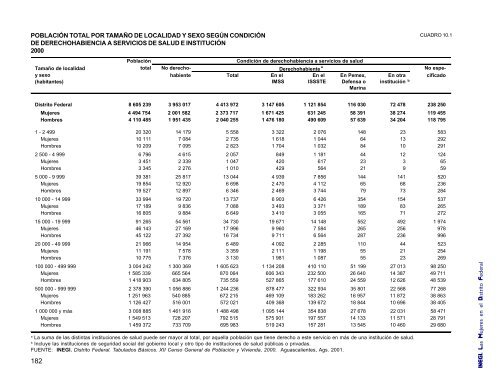
- Page 182 and 183: 11. Servicios de saludUna de las va
- Page 184 and 185: Tasa de mortalidad infantil por del
- Page 186 and 187: Defunciones generales de la poblaci
- Page 188 and 189: Nacimientos según persona que aten
- Page 190 and 191: Consultas a puérperas por tipode d
- Page 192 and 193: Mortalidad por enfermedad alcohóli
- Page 194 and 195: MORBILIDAD HOSPITALARIA a SEGÚN GR
- Page 196 and 197: TASA DE MORTALIDAD INFANTIL POR DEL
- Page 198 and 199: PRINCIPALES CAUSAS DE MORTALIDAD DE
- Page 200 and 201: INDICADORES SELECCIONADOS DE SALUD
- Page 202 and 203: CASOS ACUMULADOS DE SIDA POR CATEGO
- Page 204 and 205: 12. Población con discapacidadLa d
- Page 206 and 207: Población con discapacidad según
- Page 208 and 209: Población con discapacidadpor sexo
- Page 210 and 211: Población de 15 y más años con d
- Page 212 and 213: Población con discapacidadpor sexo
- Page 214 and 215: Población con discapacidad a causa
- Page 216 and 217: POBLACIÓN TOTAL POR SEXO Y GRUPOS
- Page 218 and 219: POBLACIÓN TOTAL POR DELEGACIÓN Y
- Page 220 and 221: INDICADORES SOCIODEMOGRÁFICOS SELE
- Page 222 and 223: Hogares por sexo del jefeDe 1960 a
- Page 224 and 225: Hogares familiares por clasesegún
- Page 226 and 227:
Población en hogares por sexo del
- Page 228 and 229:
Hogares por grupos de ingreso por t
- Page 230 and 231:
DISTRIBUCIÓN PORCENTUAL DE LOS HOG
- Page 232 and 233:
POBLACIÓN EN HOGARES POR SEXO DEL
- Page 234 and 235:
JEFE DEL HOGAR POR GRUPOS DE EDAD S
- Page 236 and 237:
HOGARES Y SU POBLACIÓN POR SEXO DE
- Page 238 and 239:
Población en lista nominal de la e
- Page 240 and 241:
Candidatos a jefe de gobierno de la
- Page 242 and 243:
Trabajadores en la administración
- Page 244 and 245:
CIUDADANOS INSCRITOS EN EL PADRÓN
- Page 246 and 247:
INDICADORES SELECCIONADOS POR SEXO2
- Page 248 and 249:
Tanto para los presuntos delincuent
- Page 250 and 251:
Al considerar las entidades más po
- Page 252 and 253:
Presuntos delincuentes del fuero co
- Page 254 and 255:
Tasa de delincuentes sentenciados p
- Page 256 and 257:
Delincuentes sentenciados del fuero
- Page 258 and 259:
PRESUNTOS DELINCUENTES REGISTRADOS
- Page 260 and 261:
PRESUNTOS DELINCUENTES REGISTRADOS
- Page 262 and 263:
PRESUNTOS DELINCUENTES REGISTRADOS
- Page 264 and 265:
PRESUNTOS DELINCUENTES REGISTRADOS
- Page 266 and 267:
DELINCUENTES SENTENCIADOS REGISTRAD
- Page 268 and 269:
DELINCUENTES SENTENCIADOS REGISTRAD
- Page 270 and 271:
DELINCUENTES SENTENCIADOS REGISTRAD
- Page 272 and 273:
DELINCUENTES SENTENCIADOS REGISTRAD
- Page 274 and 275:
16. ViviendasViviendas particulares
- Page 276 and 277:
Viviendas particulares habitadas po
- Page 278 and 279:
Viviendas particulares habitadas qu
- Page 280 and 281:
Viviendas particulares habitadas po
- Page 282 and 283:
VIVIENDAS PARTICULARES HABITADAS PO
- Page 284 and 285:
VIVIENDAS PARTICULARES HABITADAS CO
- Page 286 and 287:
VIVIENDAS PARTICULARES HABITADAS CO
- Page 288 and 289:
VIVIENDAS PARTICULARES HABITADAS CO
- Page 290 and 291:
TENENCIA Y BIENES DE LA VIVIENDA SE
- Page 292 and 293:
• Incluye la pensión por divorci
- Page 294 and 295:
Defunción materna. La muerte que o
- Page 296 and 297:
Enfermera general. Persona capacita
- Page 298 and 299:
• Pemex, Defensa o Marina.• Otr
- Page 300 and 301:
Organización no gubernamental (ONG
- Page 302 and 303:
a las personas en edades económica
- Page 304 and 305:
Tasa global de fecundidad. Número
- Page 306:
Esta publicación consta de 239 eje