Create successful ePaper yourself
Turn your PDF publications into a flip-book with our unique Google optimized e-Paper software.
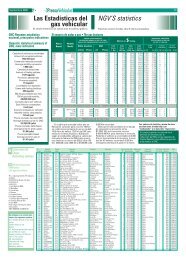
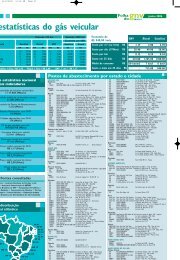
5A3 Resumen general de estaciones de GNC en el paísGeneral summary of CNG stations in the countryTotal PaísCountry totalCapital FederalGran Buenos AiresPcia. de Bs. As. - InteriorTotalEstacionesStations1664981.0311.695ManguerasHoses9642.5654.8908.419Capacidadm3/h161.702502.4341.012.4151.676.551A4 Evolución por añoYearly evolution5Año Cant.Estac. Cant.ManguerasYear Stations Hosesm3/h1984 2 8 6001985 2 10 1.700198619871988516232070883.60011.60014.8701989 21 88 16.3141990 22 100 17.7501991 69 367 66.2401992 169 976 167.7871993 82 400 70.3671994 37 158 31.1761995 22 100 17.7801996 45 210 42.72619971998557624835547.17470.8281999 124567 121.7322000 101 482 111.8602001 111526 119.275200220036710331853774.357114.7432004 178876 194.97420052006200716414259846755314162.955140.67555.468Totales1.695 8.419 1.676.551A5 Cantidad de estaciones por bandera (a agosto 2007)Amount per trademark ( August 2007)BanderaTrade Mark Estaciones % Mangueras % Capac. Nm3/hora %REPSOL YPF 382 22,54 1.925 22,86 384.238 22,92BLANCA 593 34,99 2.965 35,22 591.324 35,27PETROBRAS 206 12,15 1.041 12,36 196.359 11,71SHELL 181 10,68 832 9,88 166.878 9,95ESSO 149 8,79 688 8,17 150.288 8,96ASPRO 57 3,36 300 3,56 58.760 3,50SOL 36 2,12 203 2,41 37.705 2,25RHASA 21 1,24 96 1,14 22.984 1,37SAN LORENZO 8 0,47 37 0,44 5.700 0,34OYRSA 8 0,47 38 0,45 5.665 0,34REFINOR 19 1,12 94 1,12 19.600 1,17AGIRA 13 0,77 90 1,07 15.200 0,91PECOM 4 0,24 18 0,21 4.200 0,25NGV 3 0,18 20 0,24 3.700 0,22TRANSGAS 4 0,24 8 0,10 2.400 0,14COPEC 5 0,29 28 0,33 5.450 0,33GNC PLUS 6 0,35 36 0,43 6.100 0,36Total 1.695 100 8.419 100 1.676.551 100