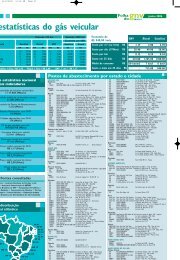
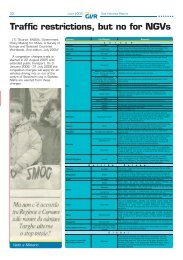
B5- Ventas totales de combustibles en m3 anualizadas.Var. Año Var. Año Var. Año Var. Año Var. Año Var. Año Var. Año Var. Año Var. AñoProducto 1999 ant. % 2000 ant. % 2001 ant. % 2002 ant. % 2003 ant. % 2004 ant. % 2005 ant. % 2006 ant. % 2007 ant. %Var. last Var. last Var. last Var. last Var. last Var. last Var. last Var. last Var. lastyear year year year year year year year yearNafta normal 1.677.600 -11,20 1.229.300 -26,72 1.004.100 -18,32 1.034.579 3,04 818.357 -20,90 652.702 -20,24 542.408 -16,90 456.098 -15,91 175.947 -61,42Nafta super/ultra 3.543.400 -3,90 3.489.900 -1,51 3.235.200 -7,30 2.695.679 -16,68 2.562.477 -4,94 2.785.897 8,72 3.135.177 12,54 3.803.948 21,33 2.198.957 -42,19Gasoil 11.708.100 -1,40 11.484.500 -1,91 10.797.600 -5,98 10.030.984 -7,10 10.574.957 5,42 11.381.011 7,62 12.052.685 5,90 12.936.982 7,34 6.700.635 -48,21GNC 1.508.327 6,83 1.681.059 11,45 1.850.565 10,08 2.038.616 9,36 2.649.400 29,96 3.062.295 15,58 3.186.475 4,06 3.061.902 -3,91 1.438.789 -53,01Total 18.437.427 -2,21 17.884.759 -3,00 16.887.465 -5,58 15.799.858 -6,44 16.605.191 5,10 17.881.905 8,52 18.916.745 5,79 20.258.930 7,10 10.514.328 -48,10B7-B6-¿Cuánto representa el volumen vendido de GNC con respectode los otros combustibles?How much is the volume of CNG sold when compared to other fuels?Combustible 1994 1995 1996 1997 1998 1999 2000 2001 200220032003 2004 2005 2006 2007Fuel % % % % % % % % % % % % % %Nafta normal 43,24 43,14 45.50 57,73 74,84 90,34 136,74 184,48 197,05 323,75 469,17 587,47 671,32 817,74Nafta especial 21,94 24,46 28.10 33,61 38,37 42,58 48,17 57,12 75,63 103,39 109,92 101,63 80,49 65,43Naftas grales. 14,55 15,61 17.40 21,24 25,37 28,94 35,62 43,62 54,65 78,37 89,06 86,64 71,87 60,58Gasoil 10,77 10,20 10.20 12,52 11,90 12,91 14,64 17,25 20,32 25,05 26,90 26,44 23,67 21,47Líquidos gral. 6,19 6,17 6.40 7,88 8,10 8,93 10,37 12,36 14,81 18,98 20,66 20,25 17,80 15,85Participación en la canasta de los combustibles.Participation of gas in the basket of fuels.Mayo‘07 Junio‘07 Junio‘06Tipo en miles de .m 3 en miles de m 3 en miles de m 3%%%in thous. m 3 in thous. m 3 in thous. m 3Nafta normal 28.912 1,58 29.158 1,60 37.119 2,22Nafta súper/ultra 365.862 20,04 368.675 20,28 284.883 17,08Gasoil 1.181.994 64,74 1.183.849 65,11 1.098.494 65,84GNC 248.857 13,63 236.563 13,01 247.875 14,86Total 1.825.625 100,00 1.818.245 100,00 1.668.371 100,00
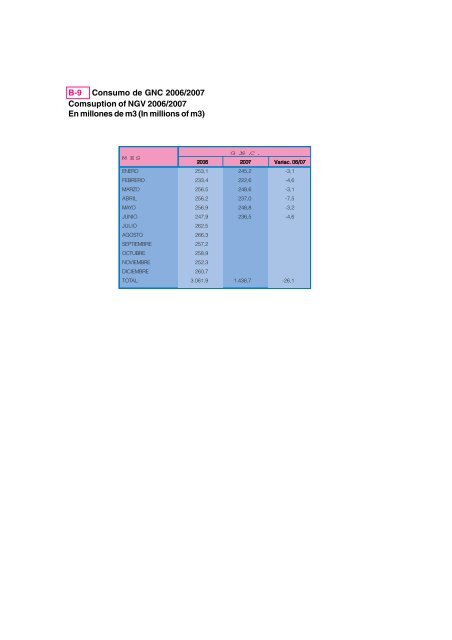
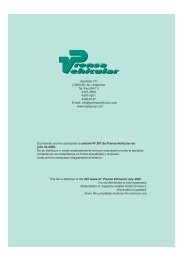
B-9 Consumo de GNC 2006/2007Comsuption of NGV 2006/2007En millones de m3 (In millions of m3)G.N.C.MES2006 2007 Variac. 06/07ENERO 253,1 245,2 -3,1FEBRERO 233,4 222,6 -4,6MARZO 256,5 248,6 -3,1ABRIL 256,2 237,0 -7,5MAYO 256,9 248,8 -3,2JUNIO 247,9 236,5 -4,6JULIO 262,5AGOSTO 266,3SEPTIEMBRE 257,2OCTUBRE 258,9NOVIEMBRE 252,3DICIEMBRE 260,7TOTAL: 3.061,9 1.438,7 -26,1