- Page 1 and 2: Architectural20132014
- Page 3: ESPAÑOLENGLISHFRANÇAISPORTUGÛESI
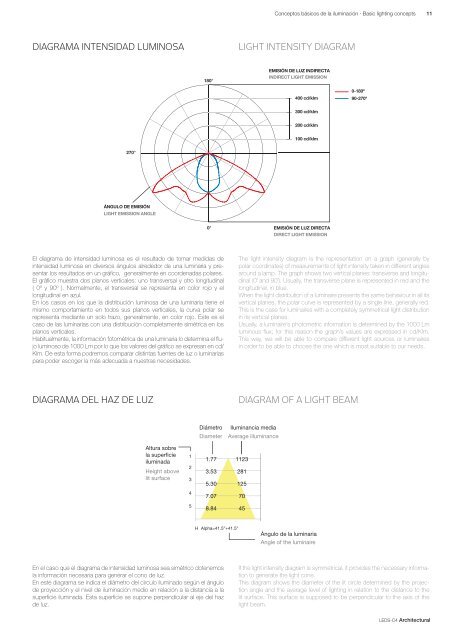
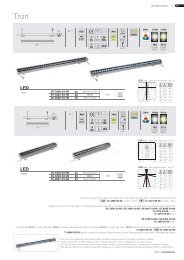
- Page 10 and 11: 8 Conceptos básicos de la iluminac
- Page 14 and 15: 12 Conceptos básicos de la ilumina
- Page 16 and 17: 14 Conceptos básicos de la ilumina
- Page 18 and 19: 16Conceptos básicos de la iluminac
- Page 20 and 21: 18 Spotlights and TracksVIAXACTIONP
- Page 22 and 23: 20 Spotlights and Tracks / ViaxAÏT
- Page 25 and 26: Spotlights and Tracks / Viax231QR-1
- Page 27 and 28: ViaxSpotlights and Tracks / Viax251
- Page 29 and 30: Spotlights and Tracks / Viax27Viax
- Page 31 and 32: Spotlights and Tracks / Action29Act
- Page 33 and 34: Spotlights and Tracks / Action 311Q
- Page 35 and 36: Spotlights and Tracks / Action33Act
- Page 37 and 38: Spotlights and Tracks / Bubo35Bubod
- Page 39 and 40: Spotlights and tracks / Bubo 37•
- Page 41 and 42: Spotlights and Tracks / Bubo39Bubo1
- Page 43 and 44: KeyNewSpotlights and Tracks / Key
- Page 45 and 46: Spotlights and Tracks / Mach143Mach
- Page 49 and 50: Spotlights and Tracks / Carriles -
- Page 51 and 52: LED Wall washers49LED WALL WASHERSB
- Page 53 and 54: LED Wall washers / Tron51Tron2• B
- Page 55 and 56: LED Wall washers / Tron53Tron241 72
- Page 57 and 58: LED Wall washers / Ray55Ray2• Ba
- Page 59 and 60: LED Wall washers / Ray57Ray21553783
- Page 62 and 63:
60 DownlightsTRIMIUM MINIPATTOPCAMA
- Page 64 and 65:
62 DownlightsMINI EVOLUTIONMINIMULT
- Page 66 and 67:
64 Downlights / BondLEDS-C4 Archite
- Page 68 and 69:
66 Downlights / Bond355°LEDS-C4 Ar
- Page 70 and 71:
ESTRU68 Downlights / BondBondESTRUC
- Page 72 and 73:
70 Downlights / Ges• Downlights p
- Page 74 and 75:
72 Downlights / VisionLEDS-C4 Archi
- Page 76 and 77:
74 Downlights / VisionLEDS-C4 Archi
- Page 78 and 79:
76 Downlights / DomeLEDS-C4 Archite
- Page 80 and 81:
78 Downlights / DomeLEDS-C4 Archite
- Page 82 and 83:
80 Downlights / Mini EvolutionLEDS-
- Page 84 and 85:
82 Downlights / Mini EvolutionLEDS-
- Page 86 and 87:
84 Downlights / MiniLEDS-C4 Archite
- Page 88 and 89:
86 Downlights / MiniMini100140Ø 90
- Page 90 and 91:
88 Downlights / PatLEDS-C4 Architec
- Page 92 and 93:
90 Downlights / PatPat2 portalámpa
- Page 94 and 95:
92 Downlights / TopLEDS-C4 Architec
- Page 96:
94 Downlights / Trimium MiniLEDS-C4
- Page 99 and 100:
Downlights / Trimium Mini97Trimium
- Page 101 and 102:
Downlights / Trimium S100 -Trimium
- Page 103 and 104:
Trimium S130Downlights / Trimium S1
- Page 105 and 106:
Camaleondesign by Estudi RibaudíDo
- Page 107 and 108:
Downlights / Camaleon105Camaleon3Ø
- Page 109 and 110:
Downlights / Eye107Eye3• Downligh
- Page 111 and 112:
Downlights / Delta109Delta 3 Delta
- Page 113 and 114:
3327 / 90-33283331 / 90-3332Downlig
- Page 115 and 116:
Downlights / Delta113Delta 949 150
- Page 117 and 118:
Downlights / Cardex115Cardex E• D
- Page 119 and 120:
Downlights / Cardex117Placas de mon
- Page 121 and 122:
Downlights / Multidir 1193LEDS-C4 A
- Page 123 and 124:
Downlights / Multidir121• Downlig
- Page 125 and 126:
Downlights / Multidir123MultidirGU5
- Page 127 and 128:
Downlights / Multidir Trimless125
- Page 129 and 130:
Downlights / Multidir Trimless127Mu
- Page 131 and 132:
Bacodesign by Benedito DesignDownli
- Page 133 and 134:
Downlights / Baco131Baco46831801460
- Page 135 and 136:
Downlights / Round Fit133Round Fit
- Page 137 and 138:
Downlights / Equal135Equalequivalen
- Page 139 and 140:
Equal LDownlights / Equal 137250139
- Page 141 and 142:
Downlights / Equal 139Equal LNewØ2
- Page 143 and 144:
Roldesign by Josep PatsíDownlights
- Page 145 and 146:
Downlights / Rol1433μ10• Reflect
- Page 147 and 148:
Downlights / Rol1453Ø 225+ =Acceso
- Page 149 and 150:
Downlights / Eco-Ecoled147EcoBASICS
- Page 151 and 152:
Downlights / Ecoled149EcoledBASICSO
- Page 153 and 154:
Downlights / Down151DownBASICSOLUTI
- Page 155 and 156:
Downlights / Fit153Fit3• Plafón
- Page 157 and 158:
Fit / Kit FitDownlights / Fit 15555
- Page 159 and 160:
Downlights / Fit1573• Sistema que
- Page 161 and 162:
Downlights / Frame - Mini Frame159F
- Page 163 and 164:
Downlights / Frame-Mini Frame161>70
- Page 165 and 166:
Downlights / Frame1633200 x 200+ =2
- Page 167 and 168:
Downlights / Mini Frame16597 9733 3
- Page 169 and 170:
Downlights / Vitro167Vitro• Lumin
- Page 171 and 172:
Downlights / Cuadro wall washer169C
- Page 173 and 174:
Fluorescent lineal lighting systems
- Page 175 and 176:
Fluorescent lineal lighting systems
- Page 177 and 178:
Fluorescent lineal lighting systems
- Page 179 and 180:
Fluorescent lineal lighting systems
- Page 181 and 182:
Fluorescent lineal lighting systems
- Page 183 and 184:
Fluorescent lineal lighting systems
- Page 185 and 186:
Suspended183SUSPENDEDSUSPENDIDOS5MU
- Page 187 and 188:
Suspended / Multidir185Multidir•
- Page 189 and 190:
Suspended / Leo187Leo• Luminaria
- Page 191 and 192:
Signal189SIGNALSEÑALIZACIÓNDISKLE
- Page 193 and 194:
DiskNewSignal / Disk 191• Aplique
- Page 195 and 196:
Signal / Oxy193Oxy• Luminaria led
- Page 197 and 198:
Signal / Bit 195Bit• Luminaria le
- Page 199 and 200:
Signal / Leo197Leo• Luminaria led
- Page 201 and 202:
Signal / Leo199Leo• Luminaria led
- Page 203 and 204:
Signal / Leo201Leo• Luminaria led
- Page 205 and 206:
Signal / Thin203ThinTHIN55-33578Ø4
- Page 207 and 208:
Signal / Dot205Dot• Luminaria led
- Page 209 and 210:
LED StripsLED STRIPSTIRAS LED207COR
- Page 211 and 212:
LED Strips / Lem 209Lem• Tira led
- Page 213 and 214:
LED strips / Ion211Ion• Tira led
- Page 215 and 216:
LED strips / Zenit213Zenit5000410IP
- Page 217 and 218:
10,2 16,548LED Strips / Sigma215Sig
- Page 219 and 220:
LED strips / Rand high power217Rand
- Page 221 and 222:
LED strips / Rand IP219Rand IP• T
- Page 223 and 224:
LED Strips / On221On• Tira led fl
- Page 225 and 226:
LED Strips / On Eco223On EcoBASICSO
- Page 227 and 228:
LED Strips / On High Power225On Hig
- Page 229 and 230:
LED Strips / On IP Eco227On IP EcoB
- Page 231 and 232:
LED strips / Facade229Facade1500011
- Page 233 and 234:
LED strips / Lineal231Lineal• Per
- Page 235 and 236:
Wall Fixtures233WALL FIXTURESAPLIQU
- Page 237 and 238:
StepNewWall Fixtures / Step235• A
- Page 239 and 240:
Wall Fixtures / Secret237SecretNew
- Page 241 and 242:
SignQR-CBC51 / MR16GU5.3New9077 x 7
- Page 243 and 244:
Wall fi xtures / Smart241Smart• A
- Page 245 and 246:
Wall fi xtures / Wall243Wall• Emp
- Page 247 and 248:
Wall fi xtures / Wall245Wall215 x 3
- Page 249 and 250:
Wall fi xtures / Pir247Pir7540 5606
- Page 251 and 252:
LED Lamps 249MR16 / QPAR16New• L
- Page 253 and 254:
LED tubesNewLED tubes251• Tubos l
- Page 255 and 256:
Lamps253TC-DTC-DELTC-TELPL-RFluores
- Page 257 and 258:
Lamps2554HIT-THIT-TCCDM-TmQ PAR-16E
- Page 259 and 260:
Electrical Units25771-2472-00-0090
- Page 261 and 262:
Drivers259ON/OFF + DIMMABLE101-10VP
- Page 263 and 264:
Drivers261ON/OFF + DIMMABLE1-10VPUS
- Page 265 and 266:
Power supply / Controllers263CONTrO
- Page 267 and 268:
Power supply / Controllers265Contro
- Page 269 and 270:
Electrical Units267350ma / 500ma /
- Page 271 and 272:
Electrical Unitsunidades eLéctrica
- Page 273 and 274:
Electrical Units271rGBcontroladores
- Page 275 and 276:
General Information273PasoStepÉtap
- Page 277 and 278:
General Information 275InformacIón
- Page 279 and 280:
Índice · Index 277Reference Range
- Page 281 and 282:
Leds-C4 279otros catálogos de LEDS
- Page 283 and 284:
SIMBOLOGÍA / SYMBOLS / SYMBOLES /