Grupo de Climatologia - Mancomunidad de Carabuco y Vallegrande
Grupo de Climatologia - Mancomunidad de Carabuco y Vallegrande
Grupo de Climatologia - Mancomunidad de Carabuco y Vallegrande

You also want an ePaper? Increase the reach of your titles
YUMPU automatically turns print PDFs into web optimized ePapers that Google loves.
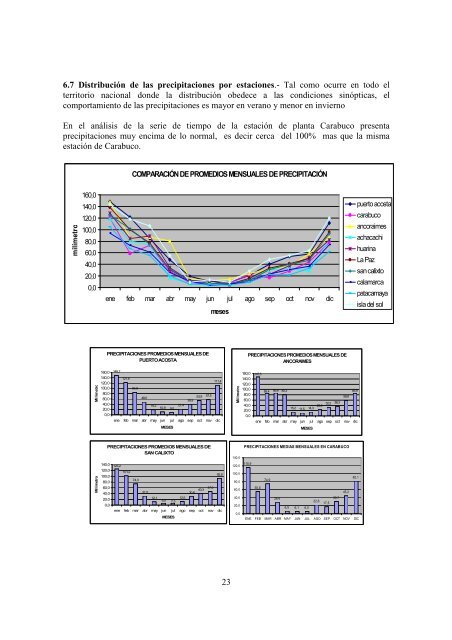
6.7 Distribución <strong>de</strong> las precipitaciones por estaciones.- Tal como ocurre en todo elterritorio nacional don<strong>de</strong> la distribución obe<strong>de</strong>ce a las condiciones sinópticas, elcomportamiento <strong>de</strong> las precipitaciones es mayor en verano y menor en inviernoEn el análisis <strong>de</strong> la serie <strong>de</strong> tiempo <strong>de</strong> la estación <strong>de</strong> planta <strong>Carabuco</strong> presentaprecipitaciones muy encima <strong>de</strong> lo normal, es <strong>de</strong>cir cerca <strong>de</strong>l 100% mas que la mismaestación <strong>de</strong> <strong>Carabuco</strong>.COMPARACIÓN DE PROMEDIOS MENSUALES DE PRECIPITACIÓNmilímetros160,0140,0120,0100,080,060,040,020,00,0ene feb mar abr may jun jul ago sep oct nov dicmesespuerto acostacarabucoancoraimesachacachihuarinaLa Pazsan calixtocalamarcapatacamayaisla <strong>de</strong>l solMilímetros160,0140,0120,0100,080,060,040,020,00,0PRECIPITACIONES PROMEDIOS MENSUALES DEPUERTO ACOSTA148,7121,684,848,053,939,9111,457,519,2 21,410,9 9,0ene feb mar abr may jun jul ago sep oct nov dicMESESMilímetros160,0140,0120,0100,080,060,040,020,00,0PRECIPITACIONES PROMEDIOS MENSUALES DEANCORAIMES147,585,4 86,8 80,315,2 11,5 14,3 23,9 32,2 36,3 58,885,9ene feb mar abr may jun jul ago sep oct nov dicMESESMilímetrosPRECIPITACIONES PROMEDIOS MENSUALES DESAN CALIXTO140,0 125,2120,0 101,2100,074,380,060,040,020,00,031,512,1 12,56,5 7,330,8 40,3 47,0 92,8ene feb mar abr may jun jul ago sep oct nov dicMESES140,0120,0100,080,060,040,020,00,0PRECIPITACIONES MEDIAS MENSUALES EN CARABUCO115,982,174,955,645,228,630,722,617,56,5 6,1 6,0ENE FEB MAR ABR MAY JUN JUL AGO SEP OCT NOV DIC23