2008 - Ministerio de Fomento
2008 - Ministerio de Fomento
2008 - Ministerio de Fomento

You also want an ePaper? Increase the reach of your titles
YUMPU automatically turns print PDFs into web optimized ePapers that Google loves.
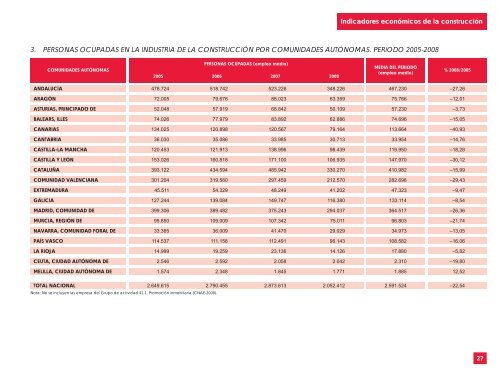
Indicadores económicos <strong>de</strong> la construcción3. PERSONAS OCUPADAS EN LA INDUSTRIA DE LA CONSTRUCCIÓN POR COMUNIDADES AUTÓNOMAS. PERIODO 2005-<strong>2008</strong>COMUNIDADES AUTÓNOMASPERSONAS OCUPADAS (empleo medio)2005 2006 2007 <strong>2008</strong>MEDIA DEL PERIODO(empleo medio)% <strong>2008</strong>/2005ANDALUCÍA 478.724 518.742 523.226 348.226 467.230 –27,26ARAGÓN 72.005 79.676 88.023 63.359 75.766 –12,01ASTURIAS, PRINCIPADO DE 52.048 57.919 68.842 50.109 57.230 –3,73BALEARS, ILLES 74.026 77.979 83.892 62.886 74.696 –15,05CANARIAS 134.025 120.898 120.567 79.164 113.664 –40,93CANTABRIA 36.030 35.086 33.985 30.713 33.954 –14,76CASTILLA-LA MANCHA 120.453 121.913 138.996 98.439 119.950 –18,28CASTILLA Y LEÓN 153.026 160.818 171.100 106.935 147.970 –30,12CATALUÑA 393.122 434.594 485.942 330.270 410.982 –15,99COMUNIDAD VALENCIANA 301.204 319.560 297.459 212.570 282.698 –29,43EXTREMADURA 45.511 54.329 48.249 41.202 47.323 –9,47GALICIA 127.244 139.084 149.747 116.380 133.114 –8,54MADRID, COMUNIDAD DE 399.306 389.482 375.243 294.037 364.517 –26,36MURCIA, REGIÓN DE 95.850 109.009 107.342 75.011 96.803 –21,74NAVARRA, COMUNIDAD FORAL DE 33.385 36.009 41.470 29.029 34.973 –13,05PAÍS VASCO 114.537 111.158 112.491 96.143 108.582 –16,06LA RIOJA 14.999 19.259 23.136 14.126 17.880 –5,82CEUTA, CIUDAD AUTÓNOMA DE 2.546 2.592 2.058 2.042 2.310 –19,80MELILLA, CIUDAD AUTÓNOMA DE 1.574 2.348 1.845 1.771 1.885 12,52TOTAL NACIONAL 2.649.615 2.790.455 2.873.613 2.052.412 2.591.524 –22,54Nota: No se incluyen las empresa <strong>de</strong>l Grupo <strong>de</strong> actividad 41.1. Promoción inmobiliaria (CNAE-2009).27