Resultados Vacuno de Leche 2006 - ITG Ganadero
Resultados Vacuno de Leche 2006 - ITG Ganadero
Resultados Vacuno de Leche 2006 - ITG Ganadero

You also want an ePaper? Increase the reach of your titles
YUMPU automatically turns print PDFs into web optimized ePapers that Google loves.
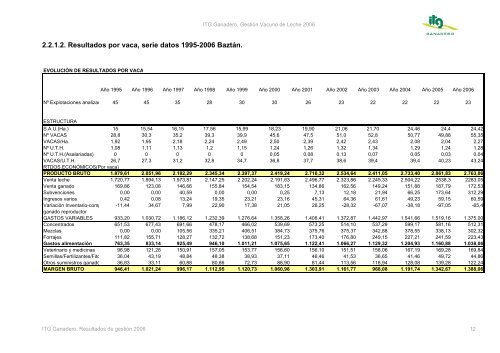
<strong>ITG</strong> Gana<strong>de</strong>ro, Gestión <strong>Vacuno</strong> <strong>de</strong> <strong>Leche</strong> <strong>2006</strong>2.2.1.2. <strong>Resultados</strong> por vaca, serie datos 1995-<strong>2006</strong> Baztán.EVOLUCIÓN DE RESULTADOS POR VACAAño 1995 Año 1996 Año 1997 Año 1998 Año 1999 Año 2000 Año 2001 Año 2002 Año 2003 Año 2004 Año 2005 Año <strong>2006</strong>Nº Explotaciones analizad 45 45 35 28 30 30 26 23 22 22 22 23ESTRUCTURAS.A.U.(Ha.) 15 15,54 16,15 17,56 15,99 18,23 19,90 21,06 21,70 24,46 24,4 24,42Nº VACAS 28,8 30,3 35,2 39,3 39,9 45,6 47,5 51,0 52,8 50,77 49,88 55,35VACAS/Ha. 1,92 1,95 2,18 2,24 2,49 2,50 2,39 2,42 2,43 2,08 2,04 2,27Nº U.T.H. 1,08 1,11 1,13 1,2 1,15 1,24 1,26 1,32 1,34 1,29 1,24 1,28Nº U.T.H.(Asalariadas) 0 0 0 0 0 0,05 0,08 0,13 0,07 0,05 0,03 0,04VACAS/U.T.H. 26,7 27,3 31,2 32,8 34,7 36,8 37,7 38,6 39,4 39,4 40,23 43,24RTDOS.ECONÓMICOS(Por vaca)PRODUCTO BRUTO 1.879,61 2.051,96 2.182,29 2.345,34 2.397,37 2.419,24 2.710,32 2.534,64 2.411,05 2.733,40 2.861,83 2.763,06Venta leche 1.720,77 1.894,13 1.973,81 2.147,25 2.202,24 2.191,63 2.496,77 2.323,86 2.245,33 2.504,22 2538,3 2283,05Venta ganado 169,86 123,08 146,66 155,84 154,54 183,15 134,86 162,56 149,24 151,88 187,79 172,53Subvenciones 0,00 0,00 40,59 0,00 0,00 0,25 7,13 12,18 21,94 66,25 173,64 312,29Ingresos varios 0,42 0,08 13,24 19,35 23,21 23,16 45,31 64,36 61,61 49,23 59,15 60,59Variación Inventario-comp -11,44 34,67 7,99 22,90 17,38 21,05 26,25 -28,32 -67,07 -38,18 -97,05 -65,4ganado reproductorGASTOS VARIABLES 933,20 1.030,72 1.186,12 1.232,39 1.276,64 1.358,26 1.406,41 1.372,87 1.442,97 1.541,66 1.519,16 1.375,00Concentrados 651,53 677,43 691,66 478,17 466,02 539,69 573,25 514,10 537,29 599,17 581,16 512,31Mezclas 0,00 0,00 105,56 335,21 406,51 384,73 375,76 375,37 342,88 378,55 338,13 302,32Forrajes 111,82 155,71 128,27 132,72 138,68 151,23 173,40 176,80 249,15 227,21 241,59 223,43Gastos alimentación 763,35 833,14 925,49 946,10 1.011,21 1.075,65 1.122,41 1.066,27 1.129,32 1.204,93 1.160,88 1.038,06Veterinario y medicinas 96,98 121,28 150,91 157,05 153,77 156,60 156,10 151,51 158,06 167,19 169,28 169,84Semillas/Fertilizantes/Fito 36,04 43,19 48,84 48,38 38,93 37,11 46,46 41,53 36,65 41,46 49,72 44,86Otros suministros ganado 36,83 33,11 60,88 80,86 72,73 88,90 81,44 113,56 118,94 128,08 139,28 122,24MARGEN BRUTO 946,41 1.021,24 996,17 1.112,95 1.120,73 1.060,98 1.303,91 1.161,77 968,08 1.191,74 1.342,67 1.388,06<strong>ITG</strong> Gana<strong>de</strong>ro. <strong>Resultados</strong> <strong>de</strong> gestión <strong>2006</strong> 12