Exportaciones por rubro y principales productos. Años 2003
Exportaciones por rubro y principales productos. Años 2003
Exportaciones por rubro y principales productos. Años 2003

You also want an ePaper? Increase the reach of your titles
YUMPU automatically turns print PDFs into web optimized ePapers that Google loves.
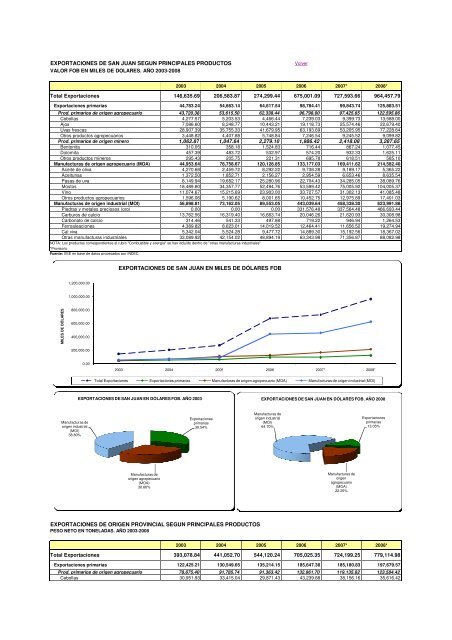
EXPORTACIONES DE SAN JUAN SEGUN PRINCIPALES PRODUCTOSVALOR FOB EN MILES DE DOLARES. AÑO <strong>2003</strong>-2008Volver<strong>2003</strong> 2004 2005 2006 2007* 2008*Total <strong>Ex<strong>por</strong>taciones</strong> 146,635.69 206,583.87 274,299.44 675,001.09 727,593.66 964,457.79<strong>Ex<strong>por</strong>taciones</strong> primarias 44,783.24 54,663.14 64,617.54 98,784.41 99,843.74 125,883.51Prod. primarios de origen agropecuario 43,720.38 53,615.50 62,338.44 96,798.00 97,425.65 122,595.86Cebollas 4,277.57 5,203.53 4,466.44 7,239.03 9,399.73 13,588.00Ajos 7,086.60 8,248.77 10,443.21 19,118.73 25,574.46 22,679.40Uvas frescas 28,907.39 35,755.33 41,679.95 63,193.69 53,205.95 77,228.64Otros <strong>productos</strong> agropecuarios 3,448.82 4,407.88 5,748.84 7,246.54 9,245.52 9,099.82Prod. primarios de origen minero 1,062.87 1,047.64 2,279.10 1,986.42 2,418.08 3,287.65Bentonita 310.05 358.18 1,524.83 716.44 867.24 1,077.45Dolomita 457.39 483.72 532.97 574.20 932.33 1,625.11Otros <strong>productos</strong> mineros 295.43 205.75 221.31 695.78 618.51 585.10Manufacturas de origen agropecuario (MOA) 44,953.64 78,758.67 120,128.85 133,177.03 169,411.62 214,582.40Aceite de oliva 4,270.68 2,459.72 8,292.22 9,738.28 9,189.17 5,365.22Aceitunas 1,372.50 1,852.71 2,156.27 2,954.59 6,653.46 8,635.54Pasas de uva 8,149.94 19,682.17 25,280.96 22,704.43 34,285.05 38,089.76Mostos 18,489.80 34,357.77 52,494.76 53,599.42 75,005.92 104,005.37Vino 11,074.67 15,215.69 23,903.00 33,727.57 31,302.13 41,085.48Otros <strong>productos</strong> agropecuarios 1,596.06 5,190.62 8,001.65 10,452.75 12,975.89 17,401.03Manufacturas de origen industrial (MOI) 56,898.81 73,162.05 89,553.05 443,039.64 458,338.30 623,991.88Piedras y metales preciosos (oro) 0.00 0.00 0.00 331,576.48 337,564.48 466,693.44Carburos de calcio 13,762.56 16,319.40 16,663.74 20,046.26 21,620.93 30,308.98Carbonato de calcio 314.46 541.33 497.88 719.22 946.94 1,264.53Ferroaleaciones 4,389.82 8,623.01 14,019.52 12,464.41 11,656.52 19,274.94Cal viva 5,342.04 5,524.28 9,477.72 14,889.30 15,192.56 18,367.02Otras manufacturas industriales 33,089.92 42,154.02 48,894.19 63,343.98 71,356.87 88,082.98NOTA: Los <strong>productos</strong> correspondientes al <strong>rubro</strong> "Combustible y energía" se han incluído dentro de "otras manufacturas industriales"*ProvisorioFuente: IIEE en base de datos procesados <strong>por</strong> INDEC.EXPORTACIONES DE SAN JUAN EN MILES DE DÓLARES FOB1,200,000.001,000,000.00MILES DE DÓLARES800,000.00600,000.00400,000.00200,000.000.00<strong>2003</strong> 2004 2005 2006 2007* 2008*Total <strong>Ex<strong>por</strong>taciones</strong> <strong>Ex<strong>por</strong>taciones</strong> primarias Manufacturas de origen agropecuario (MOA) Manufacturas de origen industrial (MOI)EXPORTACIONES DE SAN JUAN EN DÓLARES FOB. AÑO <strong>2003</strong>EXPORTACIONES DE SAN JUAN EN DÓLARES FOB. AÑO 2008Manufacturas deorigen industrial(MOI)38.80%<strong>Ex<strong>por</strong>taciones</strong>primarias30.54%Manufacturas deorigen industrial(MOI)64.70%<strong>Ex<strong>por</strong>taciones</strong>primarias13.05%Manufacturas deorigen agropecuario(MOA)30.66%Manufacturas deorigenagropecuario(MOA)22.25%EXPORTACIONES DE ORIGEN PROVINCIAL SEGUN PRINCIPALES PRODUCTOSPESO NETO EN TONELADAS. AÑO <strong>2003</strong>-2008<strong>2003</strong> 2004 2005 2006 2007* 2008*Total <strong>Ex<strong>por</strong>taciones</strong> 393,078.84 441,052.70 544,120.24 705,025.35 724,199.25 779,114.98<strong>Ex<strong>por</strong>taciones</strong> primarias 122,425.21 130,549.65 135,214.15 185,647.38 185,180.83 197,679.57Prod. primarios de origen agropecuario 78,675.40 91,785.74 91,363.42 132,961.70 119,135.82 123,584.42Cebollas 30,951.93 33,415.04 29,871.43 43,239.88 38,156.16 35,616.42
Ajos 10,717.21 12,455.44 11,983.77 20,418.24 24,567.83 20,046.82Uvas frescas 33,498.43 41,433.79 44,531.10 62,592.91 50,419.93 60,688.74Otros <strong>productos</strong> agropecuarios 3,507.82 4,481.46 4,977.12 6,710.68 5,991.89 7,232.45Prod. primarios de origen minero 43,749.81 38,763.91 43,850.73 52,685.68 66,045.01 74,095.15Bentonita 4,009.23 4,286.21 9,629.53 6,953.81 6,805.57 8,633.03Dolomita 20,424.10 20,811.03 23,485.50 22,218.05 29,767.91 35,814.04Otros <strong>productos</strong> mineros 19,316.48 13,666.68 10,735.70 23,513.82 29,471.53 29,648.08Manufacturas de origen agropecuario (MOA) 57,299.56 78,079.61 115,626.26 133,389.94 193,689.54 204,218.23Aceite de oliva 1,802.49 833.70 2,388.88 2,548.29 2,850.97 1,651.96Aceitunas 2,311.85 1,843.88 2,036.29 2,931.24 5,459.22 5,512.35Pasas de uva 8,965.93 17,092.67 20,547.58 17,834.27 27,280.86 22,409.15Mostos 31,122.77 39,639.00 56,850.03 63,743.56 83,954.70 88,354.64Vino 10,400.40 10,156.09 20,075.19 30,512.19 55,292.14 66,897.98Otros <strong>productos</strong> agropecuarios 2,696.12 8,514.27 13,728.31 15,820.38 18,851.65 19,392.16Manufacturas de origen industrial (MOI) 213,354.07 232,423.44 293,279.83 385,988.03 345,328.88 377,217.18Piedras y metales preciosos (oro) 0.00 0.00 0.00 35.30 29.79 32.63Carburos de calcio 44,795.86 46,833.46 39,199.33 41,937.78 40,075.56 43,239.67Carbonato de calcio 1,806.75 2,705.58 2,276.81 2,972.40 3,761.26 4,050.30Ferroaleaciones 7,742.20 11,297.83 15,047.80 13,279.60 9,771.60 7,172.75Cal viva 118,045.63 125,242.57 192,756.78 268,641.93 236,488.13 260,379.75Otras manufacturas industriales 40,963.64 46,344.01 43,999.11 59,121.03 55,202.55 62,342.08NOTA: Los <strong>productos</strong> correspondientes al <strong>rubro</strong> "Combustible y energía" se han incluído dentro de "otras manufacturas industriales"*ProvisorioFuente: IIEE en base de datos procesados <strong>por</strong> INDEC.EXPORTACIONES DE SAN JUAN. PESO NETO EN TONELADAS900,000.00800,000.00700,000.00600,000.00TONELADAS500,000.00400,000.00300,000.00200,000.00100,000.000.00<strong>2003</strong> 2004 2005 2006 2007* 2008*Total <strong>Ex<strong>por</strong>taciones</strong> <strong>Ex<strong>por</strong>taciones</strong> primarias Manufacturas de origen agropecuario (MOA) Manufacturas de origen industrial (MOI)