M U N I C I P A L I D A D PROVINCIAL DE SAN ... - Mpsm.gob.pe
M U N I C I P A L I D A D PROVINCIAL DE SAN ... - Mpsm.gob.pe
M U N I C I P A L I D A D PROVINCIAL DE SAN ... - Mpsm.gob.pe
- No tags were found...

You also want an ePaper? Increase the reach of your titles
YUMPU automatically turns print PDFs into web optimized ePapers that Google loves.
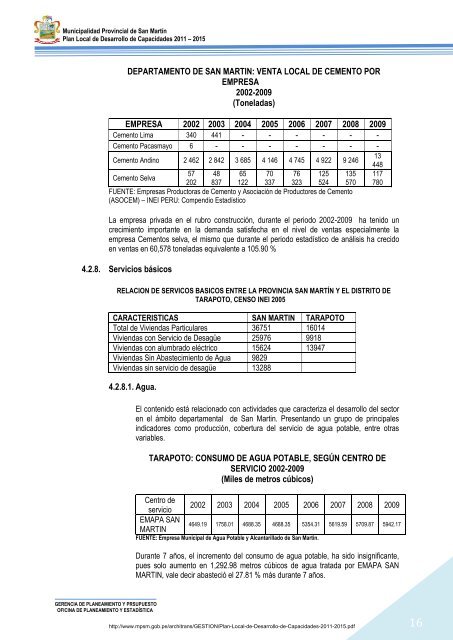
Municipalidad Provincial de San MartínPlan Local de Desarrollo de Capacidades 2011 – 2015<strong>DE</strong>PARTAMENTO <strong>DE</strong> <strong>SAN</strong> MARTIN: VENTA LOCAL <strong>DE</strong> CEMENTO POREMPRESA2002-2009(Toneladas)EMPRESA 2002 2003 2004 2005 2006 2007 2008 2009Cemento Lima 340 441 - - - - - -Cemento Pacasmayo 6 - - - - - - -Cemento Andino 2 462 2 842 3 685 4 146 4 745 4 922 9 24657 48 65 70 76 125 135Cemento Selva202 837 122 337 323 524 570FUENTE: Empresas Productoras de Cemento y Asociación de Productores de Cemento(ASOCEM) – INEI PERU: Com<strong>pe</strong>ndio Estadístico13448117780La empresa privada en el rubro construcción, durante el <strong>pe</strong>riodo 2002-2009 ha tenido uncrecimiento importante en la demanda satisfecha en el nivel de ventas es<strong>pe</strong>cialmente laempresa Cementos selva, el mismo que durante el <strong>pe</strong>riodo estadístico de análisis ha crecidoen ventas en 60,578 toneladas equivalente a 105.90 %4.2.8. Servicios básicosRELACION <strong>DE</strong> SERVICOS BASICOS ENTRE LA PROVINCIA <strong>SAN</strong> MARTÍN Y EL DISTRITO <strong>DE</strong>TARAPOTO, CENSO INEI 2005CARACTERISTICAS <strong>SAN</strong> MARTIN TARAPOTOTotal de Viviendas Particulares 36751 16014Viviendas con Servicio de Desagüe 25976 9918Viviendas con alumbrado eléctrico 15624 13947Viviendas Sin Abastecimiento de Agua 9829Viviendas sin servicio de desagüe 132884.2.8.1. Agua.El contenido está relacionado con actividades que caracteriza el desarrollo del sectoren el ámbito departamental de San Martin. Presentando un grupo de principalesindicadores como producción, cobertura del servicio de agua potable, entre otrasvariables.TARAPOTO: CONSUMO <strong>DE</strong> AGUA POTABLE, SEGÚN CENTRO <strong>DE</strong>SERVICIO 2002-2009(Miles de metros cúbicos)Centro deservicioEMAPA <strong>SAN</strong>MARTIN2002 2003 2004 2005 2006 2007 2008 20094649.19 1758.01 4688.35 4688.35 5354.31 5619.59 5709.87 5942.17FUENTE: Empresa Municipal de Agua Potable y Alcantarillado de San Martin.Durante 7 años, el incremento del consumo de agua potable, ha sido insignificante,pues solo aumento en 1,292.98 metros cúbicos de agua tratada por EMAPA <strong>SAN</strong>MARTIN, vale decir abasteció el 27.81 % más durante 7 años.GERENCIA <strong>DE</strong> PLANEAMIENTO Y PRSUPUESTOOFICINA <strong>DE</strong> PLANEAMIENTO Y ESTADÍSTICAhttp://www.mpsm.<strong>gob</strong>.<strong>pe</strong>/architrans/GESTION/Plan-Local-de-Desarrollo-de-Capacidades-2011-2015.pdf16