ENCUESTA INDUSTRIAL MENSUAL - Buenos Aires Ciudad
ENCUESTA INDUSTRIAL MENSUAL - Buenos Aires Ciudad
ENCUESTA INDUSTRIAL MENSUAL - Buenos Aires Ciudad

You also want an ePaper? Increase the reach of your titles
YUMPU automatically turns print PDFs into web optimized ePapers that Google loves.
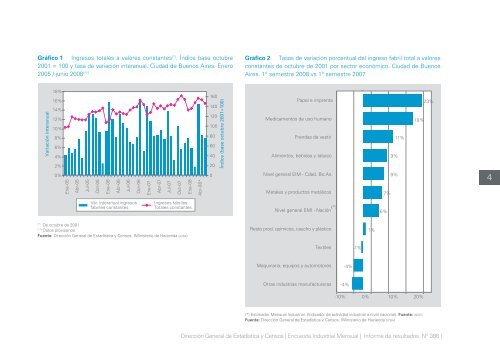
Gráfico 1 Ingresos totales a valores constantes (*) . Índice base octubre2001 = 100 y tasa de variación interanual. <strong>Ciudad</strong> de <strong>Buenos</strong> <strong>Aires</strong>. Enero2005 / junio 2008 (**)Gráfico 2 Tasas de variación porcentual del ingreso fabril total a valoresconstantes de octubre de 2001 por sector económico. <strong>Ciudad</strong> de <strong>Buenos</strong><strong>Aires</strong>. 1° semestre 2008 vs 1° semestre 2007Variación interanual18%16%14%12%10%8%6%4%2%0%Ene-05Abr-05Jul-05Oct-05Ene-06Abr-06Jul-06Oct-06Ene-07Abr-07Jul-07Oct-07Ene-08Abr-08*160140120100806040200Índice (base octubre 2001=100)Papel e imprentaMedicamentos de uso humanoPrendas de vestirAlimentos, bebidas y tabacoNivel general EIM - Cdad. Bs.As.Metales y productos metálicos11%9%8%7%19%23%4Var. interanual ingresosfabriles constantesIngresos fabrilesTotales constantesNivel general EMI - Nación (*)6%(*)De octubre de 2001(**)Datos provisoriosFuente: Dirección General de Estadística y Censos. (Ministerio de Hacienda GCBA)Resto prod. químicos, caucho y plástico1%Textiles-1%Maquinaria, equipos y automotores-4%Otras industrias manufactureras-4%-10% 0% 10% 20%(*) Estimador Mensual Industrial. (Indicador de actividad industrial a nivel nacional). Fuente: INDECFuente: Dirección General de Estadística y Censos. (Ministerio de Hacienda GCBA)Dirección General de Estadística y Censos | Encuesta Industrial Mensual | Informe de resultados N° 386 |