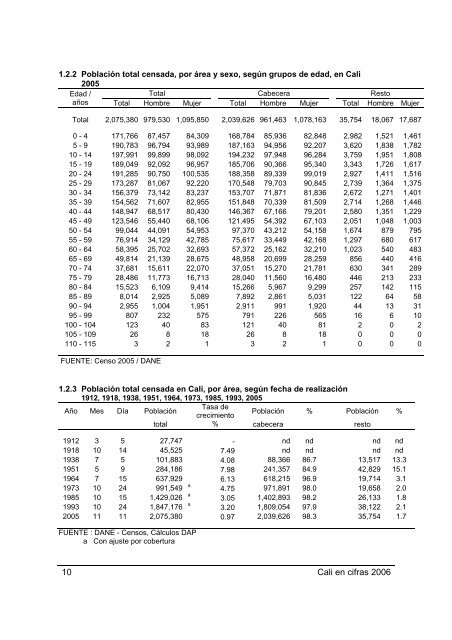
1.2.2 Población total c<strong>en</strong>sada, por área y sexo, según grupos <strong>de</strong> edad, <strong>en</strong> Cali2005Edad /Total Cabecera Restoaños Total Hombre Mujer Total Hombre Mujer Total Hombre MujerTotal 2,075,380 979,530 1,095,850 2,039,626 961,463 1,078,163 35,754 18,067 17,6870 - 4 171,766 87,457 84,309 168,784 85,936 82,848 2,982 1,521 1,4615 - 9 190,783 96,794 93,989 187,163 94,956 92,207 3,620 1,838 1,78210 - 14 197,991 99,899 98,092 194,232 97,948 96,284 3,759 1,951 1,80815 - 19 189,049 92,092 96,957 185,706 90,366 95,340 3,343 1,726 1,61720 - 24 191,285 90,750 100,535 188,358 89,339 99,019 2,927 1,411 1,51625 - 29 173,287 81,067 92,220 170,548 79,703 90,845 2,739 1,364 1,37530 - 34 156,379 73,142 83,237 153,707 71,871 81,836 2,672 1,271 1,40135 - 39 154,562 71,607 82,955 151,848 70,339 81,509 2,714 1,268 1,44640 - 44 148,947 68,517 80,430 146,367 67,166 79,201 2,580 1,351 1,22945 - 49 123,546 55,440 68,106 121,495 54,392 67,103 2,051 1,048 1,00350 - 54 99,044 44,091 54,953 97,370 43,212 54,158 1,674 879 79555 - 59 76,914 34,129 42,785 75,617 33,449 42,168 1,297 680 61760 - 64 58,395 25,702 32,693 57,372 25,162 32,210 1,023 540 48365 - 69 49,814 21,139 28,675 48,958 20,699 28,259 856 440 41670 - 74 37,681 15,611 22,070 37,051 15,270 21,781 630 341 28975 - 79 28,486 11,773 16,713 28,040 11,560 16,480 446 213 23380 - 84 15,523 6,109 9,414 15,266 5,967 9,299 257 142 11585 - 89 8,014 2,925 5,089 7,892 2,861 5,031 122 64 5890 - 94 2,955 1,004 1,951 2,911 991 1,920 44 13 3195 - 99 807 232 575 791 226 565 16 6 10100 - 104 123 40 83 121 40 81 2 0 2105 - 109 26 8 18 26 8 18 0 0 0110 - 115 3 2 1 3 2 1 0 0 0FUENTE: C<strong>en</strong>so 2005 / DANE1.2.3 Población total c<strong>en</strong>sada <strong>en</strong> Cali, por área, según fecha <strong>de</strong> realización1912, 1918, 1938, 1951, 1964, 1973, 1985, 1993, 2005Año Mes Día PoblaciónTasa <strong>de</strong>crecimi<strong>en</strong>toPoblación % Población %total % cabecera resto1912 3 5 27,747 - nd nd nd nd1918 10 14 45,525 7.49 nd nd nd nd1938 7 5 101,883 4.08 88,366 86.7 13,517 13.31951 5 9 284,186 7.98 241,357 84.9 42,829 15.11964 7 15 637,929 6.13 618,215 96.9 19,714 3.11973 10 24 991,549 a 4.75 971,891 98.0 19,658 2.01985 10 15 1,429,026 a 3.05 1,402,893 98.2 26,133 1.81993 10 24 1,847,176 a 3.20 1,809,054 97.9 38,122 2.12005 11 11 2,075,380 0.97 2,039,626 98.3 35,754 1.7FUENTE : DANE - C<strong>en</strong>sos, Cálculos DAPa Con ajuste por cobertura10 Cali <strong>en</strong> <strong>cifras</strong> <strong>2006</strong>
1.3 VIVIENDAS, BARRIOS Y URBANIZACIONES1.3.1 Vivi<strong>en</strong>das, por condición <strong>de</strong> ocupación, según áreas y tipos <strong>de</strong> vivi<strong>en</strong>da <strong>en</strong> Cali2005DescripciónTotalCondición <strong>de</strong> ocupaciónOcupada con Ocupada con todaspersonas pres<strong>en</strong>tes personas aus<strong>en</strong>tesDesocupadasTotal Cali 513,844 501,626 72 12,146Casa 286,375 280,701 30 5,644Casa indíg<strong>en</strong>a 2 2 0 0Apartam<strong>en</strong>to 199,489 193,423 40 6,026Tipo cuarto 25,070 24,592 2 476Otro tipo <strong>de</strong> vivi<strong>en</strong>da 1 2,908 2,908 0 0Cabecera 503,557 492,107 70 11,380Casa 277,356 272,397 28 4,931Casa indíg<strong>en</strong>a 0 0 0 0Apartam<strong>en</strong>to 198,745 192,713 40 5,992Tipo cuarto 24,677 24,218 2 457Otro tipo <strong>de</strong> vivi<strong>en</strong>da 1 2,779 2,779 0 0Resto 10,287 9,519 2 766Casa 9,019 8,304 2 713Casa indíg<strong>en</strong>a 2 2 0 0Apartam<strong>en</strong>to 744 710 0 34Tipo cuarto 393 374 0 19Otro tipo <strong>de</strong> vivi<strong>en</strong>da 1 129 129 0 0FUENTE : C<strong>en</strong>so 2005 / DANE1 Incluye carpa, barco, refugio natural, pu<strong>en</strong>te1.3.2 Vivi<strong>en</strong>das ocupadas con personas pres<strong>en</strong>tes, por número <strong>de</strong> hogares <strong>en</strong> lavivi<strong>en</strong>da, según áreas, <strong>en</strong> el Valle <strong>de</strong>l Cauca y Cali2005Total <strong>de</strong> hogaresDescripción Vivi<strong>en</strong>das1 2 3 4 5 6 y másValle 976,268 904,205 55,094 12,007 3,198 1,074 690Cabecera 845,022 780,722 49,065 10,751 2,913 971 600Resto 131,246 123,483 6,029 1,256 285 103 90Cali 501,626 462,503 29,064 7,316 1,900 560 283Cabecera 492,107 453,480 28,654 7,249 1,885 557 282Resto 9,519 9,023 410 67 15 3 1FUENTE: C<strong>en</strong>so 2005 / DANECali <strong>en</strong> <strong>cifras</strong> <strong>2006</strong> 11
- Page 3 and 4: Compilador: Guido Escobar MoralesIm
- Page 5 and 6: A todas las entidades públicas del
- Page 7 and 8: PRESENTACIONPara el Departamento Ad
- Page 9 and 10: Pág.1.4 EMPLEO 141.4.1 Fuerza de t
- Page 11 and 12: Pág.4.2.1 Suscriptores y extensió
- Page 13 and 14: Pág.8.2.2 Reformas de capital por
- Page 15 and 16: Pág.13. CUENTAS MUNICIPALES 12913.
- Page 17 and 18: Pág.Figura 4.4 Consumo anual de ag
- Page 19: SIGLAS FUENTES DE INFORMACIONASOCOM
- Page 22 and 23: 1.1.3.1 Código único de identific
- Page 24 and 25: 1.1.3.1 Código único de identific
- Page 26 and 27: 1.1.3.2 Código único de identific
- Page 28 and 29: 1.1.3.3 Centros de Administración
- Page 32 and 33: 1.3.3 Viviendas ocupadas con person
- Page 34 and 35: 1.4 EMPLEO1.4.1 Fuerza de trabajo y
- Page 36 and 37: 2.1.2.1 Quince primeras causas de m
- Page 38 and 39: 2.1.3 Distribución de servicios de
- Page 40 and 41: 2.1.3.1 Distribución de servicios
- Page 42 and 43: 2.1.4 Instituciones de salud por re
- Page 44 and 45: 2.1.5 Instituciones de salud área
- Page 46 and 47: 2.1.6 Distribución de servicios de
- Page 48 and 49: 2.1.7 Centros de Atención IPS Comf
- Page 50 and 51: 2.2 EDUCACIÓN2.2.1 Establecimiento
- Page 52 and 53: 2.2.2 Desempeño de las institucion
- Page 54 and 55: 34 Cali en cifras 2006
- Page 56 and 57: 3.1.1 Rama Jurisdiccional Círculo
- Page 58 and 59: 3.2.1.2 Distritos, estaciones y sub
- Page 60 and 61: 3.2.2 Delitos registrados1999 - 200
- Page 62 and 63: 3.2.3.3 Homicidios comunes según e
- Page 64 and 65: 3.2.4.3 Homicidios en accidentes de
- Page 66 and 67: 3.2.5 Suicidios3.2.5.1 Suicidios se
- Page 68 and 69: 3.2.6 Muertes accidentales3.2.6.1 M
- Page 70 and 71: 3.2.7 Emergencias atendidas1999 - 2
- Page 72 and 73: 160,000Municipio de Santiago de Cal
- Page 74 and 75: 4.3.3 Consumo anual de gas natural
- Page 76 and 77: 4.4 TELECOMUNICACIONES4.4.1 Líneas
- Page 78 and 79: 4.6.1.2 Mercados móviles20062 de 2
- Page 80 and 81:
5.1.1.1 Salas de cine20062 de 2Nomb
- Page 82 and 83:
5.1.1.4 Teatrinos2006Nombre Código
- Page 84 and 85:
5.1.1.7 Bibliotecas, centros de doc
- Page 86 and 87:
5.1.1.8 Salas de exposición y Gale
- Page 88 and 89:
5.1.1.9 Auditorios, salas para conf
- Page 90 and 91:
5.1.2.1 Radiodifusión sonora en am
- Page 92 and 93:
5.2 TURISMO5.2.1 Capacidad hotelera
- Page 94 and 95:
5.2.2 Hoteles, apartahoteles y host
- Page 96 and 97:
76 Cali en cifras 2006
- Page 98 and 99:
Municipio de Santiago de CaliÁrea
- Page 100 and 101:
7.2. SISTEMA DE CONTROL DE TRÁNSIT
- Page 102 and 103:
7.3.1 Empresas según tipo, rutas y
- Page 104 and 105:
Municipio de Santiago de CaliAccide
- Page 106 and 107:
8.2 SOCIEDADES8.2.1 Constitución d
- Page 108 and 109:
8.2.3 Disolución de sociedades por
- Page 110 and 111:
Municipio de Santiago de CaliInvers
- Page 112 and 113:
8.3.1 Oficinas bancarias20062 de 6N
- Page 114 and 115:
8.3.1 Oficinas bancarias20064 de 6N
- Page 116 and 117:
8.3.1 Oficinas bancarias20066 de 6N
- Page 118 and 119:
9.1.2 Ejecución de ingresos y gast
- Page 120 and 121:
9.2 IMPUESTOS RECAUDADOS EN CALI9.2
- Page 122 and 123:
9.3.2 Personal con contrato a térm
- Page 124 and 125:
10.2.2 Variación índice de precio
- Page 126 and 127:
10.2.8 Indice de precios al consumi
- Page 128 and 129:
10.2.11 Tasa de inflación Cali y C
- Page 130 and 131:
11.1 Cali en cifras por comunas2005
- Page 132 and 133:
11.1 Cali en cifras por comunas2005
- Page 134 and 135:
11.1 Cali en cifras por comunas2005
- Page 136 and 137:
116 Cali en cifras 2006
- Page 138 and 139:
12.1.2 Distribución de lados de ma
- Page 140 and 141:
12.1.3 Distribución de lados de ma
- Page 142 and 143:
12.1.3 Distribución de lados de ma
- Page 144 and 145:
12.1.3 Distribución de lados de ma
- Page 146 and 147:
12.1.3 Distribución de lados de ma
- Page 148 and 149:
12.2.1 Distribución de viviendas s
- Page 150 and 151:
13.2 Cali, valor agregado según ac
- Page 152 and 153:
13.3 Cali, producto interno bruto t
- Page 154 and 155:
13.3 Cali, producto interno bruto t
- Page 156 and 157:
14.1.2 Población nuevo Sisben, por
- Page 158 and 159:
14.1.6 Población entre 7 y 34 año