Anuario Comercio Exterior

You also want an ePaper? Increase the reach of your titles
YUMPU automatically turns print PDFs into web optimized ePapers that Google loves.
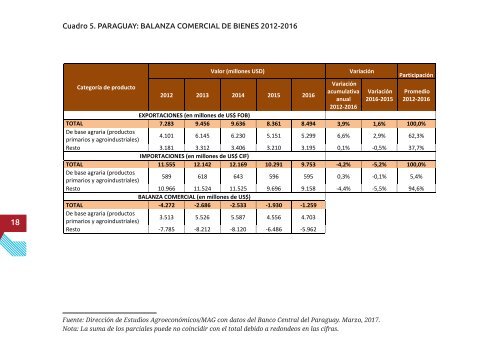
Cuadro 5. PARAGUAY: BALANZA COMERCIAL DE BIENES 2012-2016<br />
18<br />
Categoría de producto<br />
Valor (millones USD)<br />
2012 2013 2014 2015 2016<br />
Variación<br />
acumulativa<br />
anual<br />
2012-2016<br />
Variación<br />
Variación<br />
2016-2015<br />
Participación<br />
Promedio<br />
2012-2016<br />
EXPORTACIONES (en millones de US$ FOB)<br />
TOTAL 7.283 9.456 9.636 8.361 8.494 3,9% 1,6% 100,0%<br />
De base agraria (productos<br />
primarios y agroindustriales)<br />
4.101 6.145 6.230 5.151 5.299 6,6% 2,9% 62,3%<br />
Resto 3.181 3.312 3.406 3.210 3.195 0,1% -0,5% 37,7%<br />
IMPORTACIONES (en millones de US$ CIF)<br />
TOTAL 11.555 12.142 12.169 10.291 9.753 -4,2% -5,2% 100,0%<br />
De base agraria (productos<br />
primarios y agroindustriales)<br />
589 618 643 596 595 0,3% -0,1% 5,4%<br />
Resto 10.966 11.524 11.525 9.696 9.158 -4,4% -5,5% 94,6%<br />
BALANZA COMERCIAL (en millones de US$)<br />
TOTAL -4.272 -2.686 -2.533 -1.930 -1.259<br />
De base agraria (productos<br />
primarios y agroindustriales)<br />
3.513 5.526 5.587 4.556 4.703<br />
Resto -7.785 -8.212 -8.120 -6.486 -5.962<br />
Fuente: Dirección de Estudios Agroeconómicos/MAG con datos del Banco Central del Paraguay. Marzo, 2017.<br />
Fuente: Dirección de Estudios Agroeconómicos/MAG con datos del Banco Central del Paraguay. Marzo, 2017.<br />
Nota: La suma de los parciales puede no coincidir con el total debido a redondeos en las cifras.