Anuario Comercio Exterior

Create successful ePaper yourself
Turn your PDF publications into a flip-book with our unique Google optimized e-Paper software.
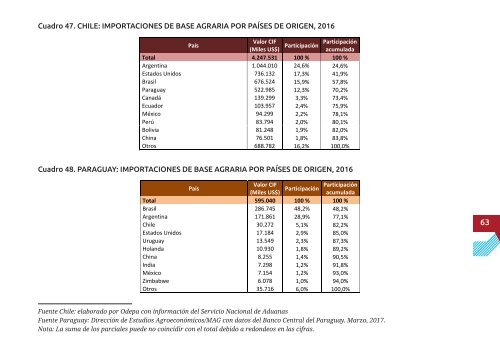
Cuadro 47. CHILE: IMPORTACIONES DE BASE AGRARIA POR PAÍSES DE ORIGEN, 2016<br />
Valor CIF<br />
Participación<br />
País<br />
Participación<br />
(Miles US$)<br />
acumulada<br />
Total 4.247.531 Valor CIF 100 % Participación<br />
País<br />
Participación 100 %<br />
Argentina (Miles 1.044.010 US$) 24,6% acumulada 24,6%<br />
Estados Total Unidos 4.247.531 736.132 17,3% 100 % 41,9% 100 %<br />
Brasil Argentina 1.044.010 676.524 15,9% 24,6% 57,8% 24,6%<br />
Paraguay Estados Unidos 522.985 736.132 12,3% 17,3% 70,2% 41,9%<br />
Canadá Brasil 139.299 676.524 15,9% 3,3% 73,4% 57,8%<br />
Ecuador Paraguay 103.957 522.985 12,3% 2,4% 75,9% 70,2%<br />
México Canadá 139.299 94.299 2,2% 3,3% 78,1% 73,4%<br />
Perú Ecuador 103.957 83.794 2,0% 2,4% 80,1% 75,9%<br />
Bolivia México 81.248 94.299 1,9% 2,2% 82,0% 78,1%<br />
China Perú 76.501 83.794 1,8% 2,0% 83,8% 80,1%<br />
Otros Bolivia 688.782 81.248 16,2% 1,9% 100,0% 82,0%<br />
China 76.501 1,8% 83,8%<br />
Otros 688.782 16,2% 100,0%<br />
Cuadro 48. PARAGUAY: IMPORTACIONES DE BASE AGRARIA POR PAÍSES DE ORIGEN, 2016<br />
Valor CIF<br />
Participación<br />
País<br />
Participación<br />
(Miles US$)<br />
acumulada<br />
Total Valor 595.040 CIF 100 % Participación<br />
País<br />
Participación 100 %<br />
Brasil (Miles 286.745 US$) 48,2% acumulada 48,2%<br />
Argentina Total 171.861 595.040 28,9% 100 % 77,1% 100 %<br />
Chile Brasil 286.745 30.272 48,2% 5,1% 82,2% 48,2%<br />
Estados Argentina Unidos 171.861 17.184 28,9% 2,9% 85,0% 77,1%<br />
Uruguay Chile 13.549 30.272 2,3% 5,1% 87,3% 82,2%<br />
Holanda Estados Unidos 10.930 17.184 1,8% 2,9% 89,2% 85,0%<br />
China Uruguay 13.549 8.255 1,4% 2,3% 90,5% 87,3%<br />
India Holanda 10.930 7.298 1,2% 1,8% 91,8% 89,2%<br />
México China 7.154 8.255 1,2% 1,4% 93,0% 90,5%<br />
Zimbabwe India 6.078 7.298 1,0% 1,2% 94,0% 91,8%<br />
Otros México 35.716 7.154 6,0% 1,2% 100,0% 93,0%<br />
Zimbabwe 6.078 1,0% 94,0%<br />
Otros 35.716 6,0% 100,0%<br />
63<br />
Fuente Chile: elaborado por Odepa con información del Servicio Nacional de Aduanas<br />
Fuente Paraguay: Dirección de Estudios Agroeconómicos/MAG con datos del Banco Central del Paraguay. Marzo, 2017.<br />
Nota: La suma de los parciales puede no coincidir con el total debido a redondeos en las cifras.