Anuario Comercio Exterior

Create successful ePaper yourself
Turn your PDF publications into a flip-book with our unique Google optimized e-Paper software.
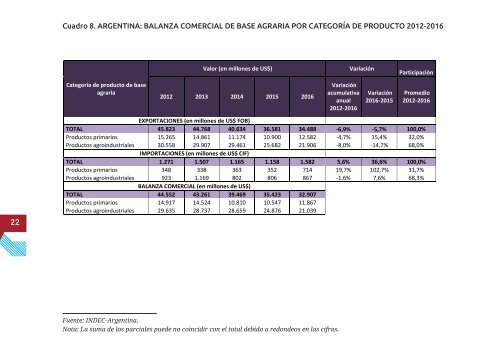
Cuadro 8. ARGENTINA: BALANZA COMERCIAL DE BASE AGRARIA POR CATEGORÍA DE PRODUCTO 2012-2016<br />
Valor (en millones de US$)<br />
Variación<br />
Participación<br />
Categoría de producto de base<br />
agraria<br />
2012 2013 2014 2015 2016<br />
Variación<br />
acumulativa<br />
anual<br />
2012-2016<br />
Variación<br />
2016-2015<br />
Promedio<br />
2012-2016<br />
22<br />
EXPORTACIONES (en millones de US$ FOB)<br />
TOTAL 45.823 44.768 40.634 36.581 34.488 -6,9% -5,7% 100,0%<br />
Productos primarios 15.265 14.861 11.174 10.900 12.582 -4,7% 15,4% 32,0%<br />
Productos agroindustriales 30.558 29.907 29.461 25.682 21.906 -8,0% -14,7% 68,0%<br />
IMPORTACIONES (en millones de US$ CIF)<br />
TOTAL 1.271 1.507 1.165 1.158 1.582 5,6% 36,6% 100,0%<br />
Productos primarios 348 338 363 352 714 19,7% 102,7% 31,7%<br />
Productos agroindustriales 923 1.169 802 806 867 -1,6% 7,6% 68,3%<br />
BALANZA COMERCIAL (en millones de US$)<br />
TOTAL 44.552 43.261 39.469 35.423 32.907<br />
Productos primarios 14.917 14.524 10.810 10.547 11.867<br />
Productos agroindustriales 29.635 28.737 28.659 24.876 21.039<br />
Fuente: INDEC-Argentina<br />
Fuente: INDEC-Argentina.<br />
Nota: La suma de los parciales puede no coincidir con el total debido a redondeos en las cifras.