FIM Aamukatsaus
aamukatsaus_26052016
aamukatsaus_26052016

You also want an ePaper? Increase the reach of your titles
YUMPU automatically turns print PDFs into web optimized ePapers that Google loves.
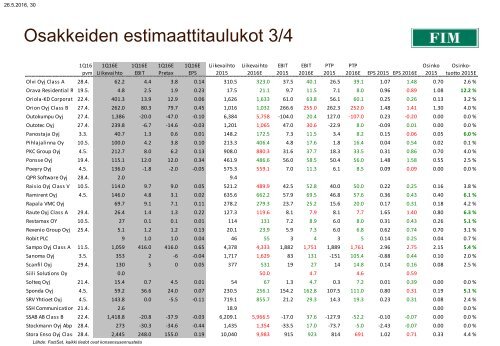
26.5.2016, 30<br />
Osakkeiden estimaattitaulukot 3/4<br />
1Q16<br />
pvm<br />
1Q16E<br />
Liikevaihto<br />
1Q16E<br />
EBIT<br />
1Q16E<br />
Pretax<br />
1Q16E<br />
EPS<br />
Liikevaihto<br />
2015<br />
Liikevaihto<br />
2016E<br />
EBIT<br />
2015<br />
EBIT<br />
2016E<br />
PTP<br />
2015<br />
PTP<br />
2016E<br />
EPS 2015 EPS 2016E<br />
Osinko<br />
2015<br />
Osinkotuotto<br />
2015E<br />
Olvi Oyj Class A 28.4. 62.2 4.4 3.8 0.14 310.5 323.0 37.5 40.1 26.5 39.1 1.07 1.48 0.70 2.6 %<br />
Orava Residential REIT 19.5. Plc<br />
4.8 2.5 1.9 0.23 17.5 21.1 9.7 11.5 7.1 8.0 0.96 0.89 1.08 12.2 %<br />
Oriola-KD Corporation 22.4. Class B 401.3 13.9 12.9 0.06 1,626 1,633 61.0 63.8 56.1 60.1 0.25 0.26 0.13 3.2 %<br />
Orion Oyj Class B 27.4. 262.0 80.3 79.7 0.45 1,016 1,032 266.6 255.0 262.3 252.0 1.48 1.41 1.30 4.0 %<br />
Outokumpu Oyj 27.4. 1,386 -20.0 -47.0 -0.10 6,384 5,758 -104.0 20.4 127.0 -107.0 0.23 -0.20 0.00 0.0 %<br />
Outotec Oyj 27.4. 239.8 -6.7 -14.6 -0.03 1,201 1,065 47.0 30.6 -22.9 8.0 -0.09 0.01 0.00 0.0 %<br />
Panostaja Oyj 3.3. 40.7 1.3 0.6 0.01 148.2 172.5 7.3 11.5 3.4 8.2 0.15 0.06 0.05 6.0 %<br />
Pihlajalinna Oy 10.5. 100.0 4.2 3.8 0.10 213.3 406.4 4.8 17.6 1.8 16.4 0.04 0.54 0.02 0.1 %<br />
PKC Group Oyj 4.5. 212.7 8.0 6.2 0.13 908.0 880.3 31.6 37.7 18.3 33.5 0.31 0.86 0.70 4.0 %<br />
Ponsse Oyj 19.4. 115.1 12.0 12.0 0.34 461.9 486.6 56.0 58.5 50.4 56.0 1.48 1.58 0.55 2.5 %<br />
Poeyry Oyj 4.5. 136.0 -1.8 -2.0 -0.05 575.3 559.1 7.0 11.3 6.1 8.5 0.09 0.09 0.00 0.0 %<br />
QPR Software Oyj 28.4. 2.0 9.4<br />
Raisio Oyj Class V 10.5. 114.0 9.7 9.0 0.05 521.2 489.9 42.5 52.8 40.0 50.0 0.22 0.25 0.16 3.8 %<br />
Ramirent Oyj 4.5. 146.0 4.8 3.1 0.02 635.6 662.2 57.9 69.5 46.8 57.6 0.36 0.43 0.40 6.1 %<br />
Rapala VMC Oyj 69.7 9.1 7.1 0.11 278.2 279.3 23.7 25.2 15.6 20.0 0.17 0.31 0.18 4.2 %<br />
Raute Oyj Class A 29.4. 26.4 1.4 1.3 0.22 127.3 119.6 8.1 7.9 8.1 7.7 1.65 1.40 0.80 6.3 %<br />
Restamax OY 10.5. 27 0.1 0.1 0.01 114 131 7.2 8.9 6.0 8.0 0.31 0.43 0.26 5.1 %<br />
Revenio Group Oyj 25.4. 5.1 1.2 1.2 0.13 20.1 23.9 5.9 7.3 6.0 6.8 0.62 0.74 0.70 3.1 %<br />
Robit PLC 9 1.0 1.0 0.04 46 55 3 4 3 5 0.14 0.25 0.04 0.7 %<br />
Sampo Oyj Class A 11.5. 1,059 416.0 416.0 0.65 4,378 4,333 1,882 1,751 1,889 1,761 2.96 2.75 2.15 5.4 %<br />
Sanoma Oyj 3.5. 353 2 -6 -0.04 1,717 1,629 83 131 -151 105.4 -0.88 0.44 0.10 2.0 %<br />
Scanfil Oyj 29.4. 130 5 0 0.05 377 531 19 27 14 14.8 0.14 0.16 0.08 2.5 %<br />
Siili Solutions Oy 0.0 50.0 4.7 4.6 0.59<br />
Solteq Oyj 21.4. 15.4 0.7 4.5 0.01 54 67 1.3 4.7 0.3 7.2 0.01 0.39 0.00 0.0 %<br />
Sponda Oyj 4.5. 59.2 36.6 24.0 0.07 230.5 256.1 154.2 162.8 107.5 111.0 0.80 0.31 0.19 5.1 %<br />
SRV Yhtioet Oyj 4.5. 143.8 0.0 -5.5 -0.11 719.1 855.7 21.2 29.3 14.3 19.3 0.23 0.31 0.08 2.4 %<br />
SSH Communications 21.4. Security Oyj 2.6 18.9 0.00 0.0 %<br />
SSAB AB Class B 22.4. 1,418.8 -20.8 -37.9 -0.03 6,209.1 5,966.5 -17.0 37.6 -127.9 -52.2 -0.10 -0.07 0.00 0.0 %<br />
Stockmann Oyj Abp Class 28.4. B 273 -30.3 -34.6 -0.44 1,435 1,354 -33.5 17.0 -73.7 -5.0 -2.43 -0.07 0.00 0.0 %<br />
Stora Enso Oyj Class R28.4. 2,445 248.0 155.0 0.19 10,040 9,983 915 923 814 691 1.02 0.71 0.33 4.4 %<br />
Lähde: FactSet, kaikki tiedot ovat konsensusennusteita