Contrôle de la migration des smolts de saumon atlantique en ...
Contrôle de la migration des smolts de saumon atlantique en ...
Contrôle de la migration des smolts de saumon atlantique en ...

You also want an ePaper? Increase the reach of your titles
YUMPU automatically turns print PDFs into web optimized ePapers that Google loves.
MIGADO.- Déva<strong>la</strong>ison Pointis-Camon 09<br />
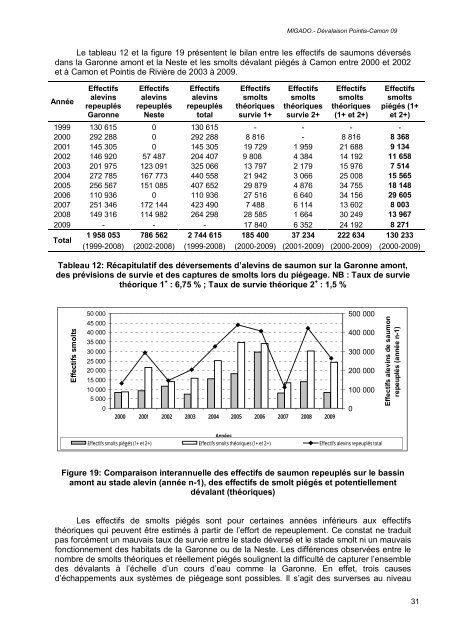
Le tableau 12 et <strong>la</strong> figure 19 prés<strong>en</strong>t<strong>en</strong>t le bi<strong>la</strong>n <strong>en</strong>tre les effectifs <strong>de</strong> <strong>saumon</strong>s déversés<br />
dans <strong>la</strong> Garonne amont et <strong>la</strong> Neste et les <strong>smolts</strong> déva<strong>la</strong>nt piégés à Camon <strong>en</strong>tre 2000 et 2002<br />
et à Camon et Pointis <strong>de</strong> Rivière <strong>de</strong> 2003 à 2009.<br />
Année<br />
Effectifs<br />
alevins<br />
repeuplés<br />
Garonne<br />
Effectifs<br />
alevins<br />
repeuplés<br />
Neste<br />
Effectifs<br />
alevins<br />
repeuplés<br />
total<br />
Effectifs<br />
<strong>smolts</strong><br />
théoriques<br />
survie 1+<br />
Effectifs<br />
<strong>smolts</strong><br />
théoriques<br />
survie 2+<br />
Effectifs<br />
<strong>smolts</strong><br />
théoriques<br />
(1+ et 2+)<br />
Effectifs<br />
<strong>smolts</strong><br />
piégés (1+<br />
et 2+)<br />
1999 130 615 0 130 615 - - - -<br />
2000 292 288 0 292 288 8 816 - 8 816 8 368<br />
2001 145 305 0 145 305 19 729 1 959 21 688 9 134<br />
2002 146 920 57 487 204 407 9 808 4 384 14 192 11 658<br />
2003 201 975 123 091 325 066 13 797 2 179 15 976 7 514<br />
2004 272 785 167 773 440 558 21 942 3 066 25 008 15 565<br />
2005 256 567 151 085 407 652 29 879 4 876 34 755 18 148<br />
2006 110 936 0 110 936 27 516 6 640 34 156 29 605<br />
2007 251 346 172 144 423 490 7 488 6 114 13 602 8 003<br />
2008 149 316 114 982 264 298 28 585 1 664 30 249 13 967<br />
2009 - - - 17 840 6 352 24 192 8 271<br />
Total<br />
1 958 053<br />
(1999-2008)<br />
786 562<br />
(2002-2008)<br />
2 744 615<br />
(1999-2008)<br />
185 400 37 234 222 634 130 233<br />
(2000-2009) (2001-2009) (2000-2009) (2000-2009)<br />
Tableau 12: Récapitu<strong>la</strong>tif <strong>de</strong>s déversem<strong>en</strong>ts d’alevins <strong>de</strong> <strong>saumon</strong> sur <strong>la</strong> Garonne amont,<br />
<strong>de</strong>s prévisions <strong>de</strong> survie et <strong>de</strong>s captures <strong>de</strong> <strong>smolts</strong> lors du piégeage. NB : Taux <strong>de</strong> survie<br />
théorique 1 + : 6,75 % ; Taux <strong>de</strong> survie théorique 2 + : 1,5 %<br />
Effectifs <strong>smolts</strong><br />
50 000<br />
45 000<br />
40 000<br />
35 000<br />
30 000<br />
25 000<br />
20 000<br />
15 000<br />
10 000<br />
5 000<br />
0<br />
2000 2001 2002 2003 2004 2005 2006 2007 2008 2009<br />
500 000<br />
400 000<br />
300 000<br />
200 000<br />
100 000<br />
Effectifs <strong>smolts</strong> piégés (1+ et 2+)<br />
Années<br />
Effectifs <strong>smolts</strong> théoriques (1+ et 2+) Effectifs alevins repeuplés total<br />
0<br />
Effectifs alevins <strong>de</strong> <strong>saumon</strong><br />
repeuplés (année n-1)<br />
Figure 19: Comparaison interannuelle <strong>de</strong>s effectifs <strong>de</strong> <strong>saumon</strong> repeuplés sur le bassin<br />
amont au sta<strong>de</strong> alevin (année n-1), <strong>de</strong>s effectifs <strong>de</strong> smolt piégés et pot<strong>en</strong>tiellem<strong>en</strong>t<br />
déva<strong>la</strong>nt (théoriques)<br />
Les effectifs <strong>de</strong> <strong>smolts</strong> piégés sont pour certaines années inférieurs aux effectifs<br />
théoriques qui peuv<strong>en</strong>t être estimés à partir <strong>de</strong> l’effort <strong>de</strong> repeuplem<strong>en</strong>t. Ce constat ne traduit<br />
pas forcém<strong>en</strong>t un mauvais taux <strong>de</strong> survie <strong>en</strong>tre le sta<strong>de</strong> déversé et le sta<strong>de</strong> smolt ni un mauvais<br />
fonctionnem<strong>en</strong>t <strong>de</strong>s habitats <strong>de</strong> <strong>la</strong> Garonne ou <strong>de</strong> <strong>la</strong> Neste. Les différ<strong>en</strong>ces observées <strong>en</strong>tre le<br />
nombre <strong>de</strong> <strong>smolts</strong> théoriques et réellem<strong>en</strong>t piégés soulign<strong>en</strong>t <strong>la</strong> difficulté <strong>de</strong> capturer l’<strong>en</strong>semble<br />
<strong>de</strong>s déva<strong>la</strong>nts à l’échelle d’un cours d’eau comme <strong>la</strong> Garonne. En effet, trois causes<br />
d’échappem<strong>en</strong>ts aux systèmes <strong>de</strong> piégeage sont possibles. Il s’agit <strong>de</strong>s surverses au niveau<br />
31