Fascicule entier - Tropicultura
Fascicule entier - Tropicultura
Fascicule entier - Tropicultura

Create successful ePaper yourself
Turn your PDF publications into a flip-book with our unique Google optimized e-Paper software.
TROPICULTURA<br />
Concerning the organochlorines pesticides Lindan,<br />
Dieldrin, Heptachlor, Endrin, it appears distinctly that<br />
high concentrations are found in Lahou (20 ng/g) and<br />
in the bay station of Marcory (8.0 ng/g). The lowest<br />
concentrations are detected in Bietry (1.8 ng/g) and<br />
Banco (1.7 ng/g). We notice that the concentrations<br />
of DDT metabolites are relatively higher than those of<br />
the four other compounds. The means reach 53 ng/g in<br />
Bietry and 130 ng/g in Cocody.<br />
Concerning the polychlorobiphenyls (PCB), highest<br />
concentrations are observed in the lagoon zone of<br />
Abidjan, in Banco (290 ng/g), Marcory (260 ng/g), Cocody<br />
(240 ng/g) and Bietry (200 ng/g). The relative values<br />
of the gaps observed put in evidence the fluctuating<br />
character of the measures during a same period and in<br />
a same station. Considering the important fluctuation<br />
margins, the indicated concentrations must be taken<br />
with a lot of precautions. The results don’t allow us to<br />
80<br />
Table 2<br />
Comparison of measured concentration in oysters<br />
(December 1992 to October 2004) and the value of<br />
Maximum Limits Residues FAO/WHO<br />
LMR *(5, 11)<br />
(mg/kg)<br />
melt<br />
Level**<br />
(mg/kg)<br />
Oysters lagoon<br />
(December 1992<br />
to<br />
October 2004)<br />
Scatter Plot<br />
Level<br />
(µg/l)<br />
Waters<br />
lagoon (14)<br />
Lindan 0.2 0.02 0.023<br />
Dieldrin 0.2 0.01 0.011<br />
Endrin 0.1 0.01 0.011<br />
Heptachlor 0.2 0.01 0.034<br />
DDT+DDD+DDE 5 0.12 0.101<br />
PCB 3 (FDA) 0.22 0.011<br />
(0.436)<br />
*LMR: Limits of Maximal Residues (WHO/FAO)<br />
**(ng/g) dry weight with 75% water in oysters flesh.<br />
4<br />
Factors Scatter 2 (23.4% Plot )<br />
Scatter Plot<br />
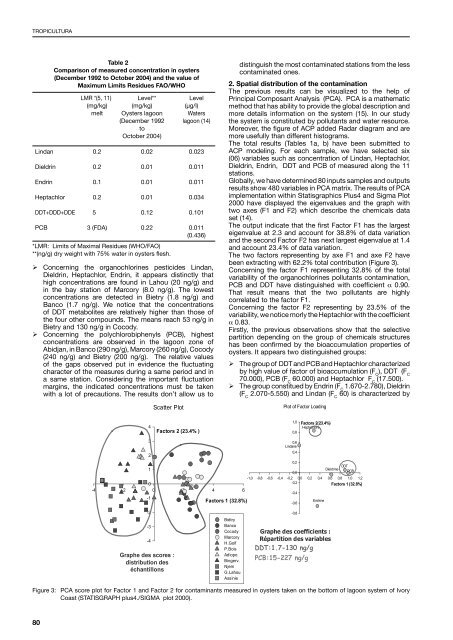
distinguish the most contaminated stations from the less<br />
contaminated ones.<br />
2. Spatial distribution of the contamination<br />
The previous results can be visualized to the help of<br />
Principal Composant Analysis (PCA). PCA is a mathematic<br />
method that has ability to provide the global description and<br />
more details information on the system (15). In our study<br />
the system is constituted by pollutants and water resource.<br />
Moreover, the figure of ACP added Radar diagram and are<br />
more usefully than different histograms.<br />
The total results (Tables 1a, b) have been submitted to<br />
ACP modeling. For each sample, we have selected six<br />
(06) variables such as concentration of Lindan, Heptachlor,<br />
Dieldrin, Endrin, DDT and PCB of measured along the 11<br />
stations.<br />
Globally, we have determined 80 inputs samples and outputs<br />
results show 480 variables in PCA matrix. The results of PCA<br />
implementation within Statisgraphics Plus4 and Sigma Plot<br />
2000 have displayed the eigenvalues and the graph with<br />
two axes (F1 and F2) which describe the chemicals data<br />
set (14).<br />
The output indicate that the first Factor F1 has the largest<br />
eigenvalue at 2.3 and account for 38.8% of data variation<br />
and the second Factor F2 has next largest eigenvalue at 1.4<br />
and account 23.4% of data variation.<br />
The two factors representing by axe F1 and axe F2 have<br />
been extracting with 62.2% total contribution (Figure 3).<br />
Concerning the factor F1 representing 32.8% of the total<br />
variability of the organochlorines pollutants contamination,<br />
PCB and DDT have distinguished with coefficient α 0.90.<br />
That result means that the two pollutants are highly<br />
correlated to the factor F1.<br />
Concerning the factor F2 representing by 23.5% of the<br />
variability, we notice morly the Heptachlor with the coefficient<br />
α 0.83.<br />
Firstly, the previous observations show that the selective<br />
partition depending on the group of chemicals structures<br />
has been confirmed by the bioaccumulation properties of<br />
oysters. It appears two distinguished groups:<br />
<br />
The group of DDT and PCB and Heptachlor characterized<br />
by high value of factor of bioaccumulation (F ), DDT (F C C<br />
70.000), PCB (F 60.000) and Heptachlor F (17.500).<br />
C C<br />
The group constitued by Endrin (F 1.670-2.780), Dieldrin<br />
(F 2.070-5.550) and Lindan (F 60) is characterized by<br />
C C<br />
C<br />
Plot of Factor Loading<br />
1,0 Factors 2(23.4%)<br />
Heptachlore<br />
Plot of Factor Loading<br />
Plot of Factor Loading 0,8<br />
3<br />
2<br />
0,6<br />
Lindane<br />
0,4<br />
0,2<br />
-4<br />
1<br />
Dieldrine<br />
0,0<br />
-1,0 -0,8 -0,6 -0,4 -0,2 0,0 0,2 0,4 0,6 0,8 1,0 1,2<br />
0<br />
-0,2<br />
Factors 1 (32.8%)<br />
-2 0 2 4 6<br />
-0,4<br />
-1<br />
Factors 1 (32.8%)<br />
Endrine<br />
-0,6<br />
-2<br />
-0,8<br />
-3<br />
-4<br />
DDT<br />
4<br />
Factors 2 (23.4% )<br />
3<br />
1,0 Factors 2(23.4%)<br />
Heptachlore<br />
0,8<br />
0,6<br />
Lindane<br />
0,4<br />
2<br />
PCB<br />
0,2<br />
1<br />
Dieldrine<br />
0,0<br />
-1,0 -0,8 -0,6 -0,4 -0,2 0,0 0,2 0,4 0,6 0,8 1,0 1,2<br />
0<br />
-0,2<br />
Factors 1 (32.8%)<br />
-4 -2 0 2 4 6<br />
-0,4<br />
-1<br />
Factors 1 (32.8%)<br />
Endrine<br />
-0,6<br />
-2<br />
-0,8<br />
Biétry<br />
Banco<br />
-3<br />
Cocody Graphe des coefficients :<br />
Marcory<br />
-4<br />
Répartition des variables<br />
H.Golf<br />
P.Bois DDT:1.7-130 ng/g<br />
Graphe des scores :<br />
Adiopo.<br />
Bingerv.<br />
distribution des<br />
PCB:15-227 ng/g<br />
Njem<br />
échantillons<br />
G.Lahou<br />
Assinie<br />
DDT<br />
4<br />
3<br />
Factors 2 (23.4% )<br />
1,0<br />
0,8<br />
0,6<br />
Factors 2(23.4%)<br />
Heptachlore<br />
-4<br />
Lindane<br />
0,4<br />
2<br />
0,2<br />
PCB<br />
1<br />
Dieldrine<br />
0,0<br />
-1,0 -0,8 -0,6 -0,4 -0,2 0,0 0,2 0,4 0,6 0,8 1,0 1,2<br />
0<br />
-0,2<br />
Factors 1 (32.8%)<br />
-2 0 2 4 6<br />
-0,4<br />
-1<br />
Factors 1 (32.8%)<br />
Endrine<br />
-0,6<br />
-2<br />
-0,8<br />
Biétry<br />
Banco<br />
-3<br />
Cocody Graphe des coefficients :<br />
Marcory<br />
Répartition des variables<br />
H.Golf<br />
-4<br />
P.Bois DDT:1.7-130 ng/g<br />
Graphe des scores :<br />
Adiopo.<br />
Bingerv.<br />
distribution des<br />
PCB:15-227 ng/g<br />
Njem<br />
échantillons<br />
G.Lahou<br />
Assinie<br />
DDT<br />
PCB<br />
Biétry<br />
Banco<br />
Cocody Graphe des coefficients :<br />
Marcory<br />
Répartition des variables<br />
H.Golf<br />
P.Bois DDT:1.7-130 ng/g<br />
Graphe des scores :<br />
Adiopo.<br />
Bingerv.<br />
distribution des<br />
PCB:15-227 ng/g<br />
Njem<br />
échantillons<br />
G.Lahou<br />
Assinie<br />
Figure 3: PCA score plot for Factor 1 and Factor 2 for contaminants measured in oysters taken on the bottom of lagoon system of Ivory<br />
Coast (STATISGRAPH plus4./SIGMA plot 2000).