Fascicule entier - Tropicultura
Fascicule entier - Tropicultura
Fascicule entier - Tropicultura

You also want an ePaper? Increase the reach of your titles
YUMPU automatically turns print PDFs into web optimized ePapers that Google loves.
iron toxicity, the intensity of visual symptoms and the impact<br />
on rice production in the studied zones and, secondly, to<br />
create a georeferenced database on the constraint and<br />
determine its geographical distribution in the subregion.<br />
Materials and methods<br />
The study took place during the 2000 and 2001 rice cropping<br />
seasons in three West African countries (Ivory Coast, Ghana<br />
and Guinea). These countries were selected for their high<br />
rice production, ecological diversity and accessibility.<br />
In each country, rice production region were identified by the<br />
National Agronomic Research System (NARS). Inside each<br />
region, the place head of department was selected like base<br />
site.hus, a total of 33 base sites distributed in these three<br />
countries were selected so as to cover all rice production<br />
regions. All accessible lowlands in a radius of 50 km around<br />
each base site (study zone) were investigated. In Guinea, 5<br />
base sites were in Guinée forestière, 2 in Guinée Maritime<br />
and 1 in Haute Guinée. In Ivory Coast, 13 base sites were<br />
covered, 6 in the forest zone, and 7 in the savanna zone (10).<br />
The 12 base sites selected in Ghana were all in the forest<br />
region. Interviewers were agents of the Centre National de<br />
Recherche Agronomique (CNRA) for Ivory Coast, the Institut<br />
de Recherche Agronomique de Guinée (IRAG) for Guinea<br />
and the Crops Research Institute (CRI) for Ghana. In each<br />
country, interviewers underwent training to learn how to<br />
identify and score the disease. There was also a training<br />
module on the use of global positioning system (GPS)<br />
technology.<br />
Each interviewer had to georeference, using GPS, as many<br />
lowlands and most plots in the lowlands as possible within<br />
the study zone, irrespective of iron intoxication level. With<br />
theses spatial data it was possible to draw maps at different<br />
scale: Base site scale (1/25.000), Country scale (1/1.500.000)<br />
and Sub-region scale (1/4.000.000). However the survey in<br />
Ghana was focused mainly on areas that CRI already knew<br />
were affected by iron toxicity.<br />
For this exhaustive study, interviewers had to fill in a threelevel<br />
questionnaire, including: i) the watershed level, questions<br />
related to the area, slope and land use, ii) the lowland level,<br />
including a description: area, soil type in FAO system (feeling<br />
with touched, grounds handle or grounds ribbon), its use (past<br />
and present) and characterization of the overall development<br />
patterns; iii) at the plot level, information related to areas<br />
and cropping practices (variety, preliminary cultivation,<br />
sowing type, fertilizer type and dosage), the extent of toxicity<br />
(presence and scoring of visual symptoms) and production.<br />
Surveys were conducted in two phases, the first between<br />
tillering and ripening onset (60-90 days after transplanting),<br />
which is the period when iron toxicity symptoms are more<br />
visible, and the second at harvest to estimate production.<br />
The constraint intensity, based on leaf symptoms, was<br />
defined on a visual scale ranging from 1 to 9, according to<br />
the intoxication level. A score of 1 indicated normal tillering<br />
Countries<br />
Cultivation<br />
(%)<br />
Table 1<br />
Watershed and Lowland use (%) during the years 2000-2001<br />
Watershed<br />
Settlements<br />
(%)<br />
Non-<br />
exploited<br />
Rice<br />
Lowland<br />
Dry season Rainy season<br />
TROPICULTURA<br />
and growth, while 9 indicated that most of the plants were<br />
dead or withered (11).<br />
Three intensity levels were defined on the basis of the iron<br />
toxicity level in each plot. Level 1 for scores between 1<br />
and 3 (low intensity), level 2 for scores between 3 and 6<br />
(intermediate intensity) and level 3 for scores above 6 (high<br />
intensity).<br />
The statistical analysis was conducted using the SAS<br />
software package (20). The frequency of each intensity<br />
level was determined for each lowland and site. The most<br />
frequent score was considered as the iron toxicity level for<br />
a given lowland or site. Some questionnaire fields could not<br />
be filled in for various reasons, so the number of plots or<br />
lowlands or even sites sometimes varied according to the<br />
parameter being analyzed.<br />
Results and discussion<br />
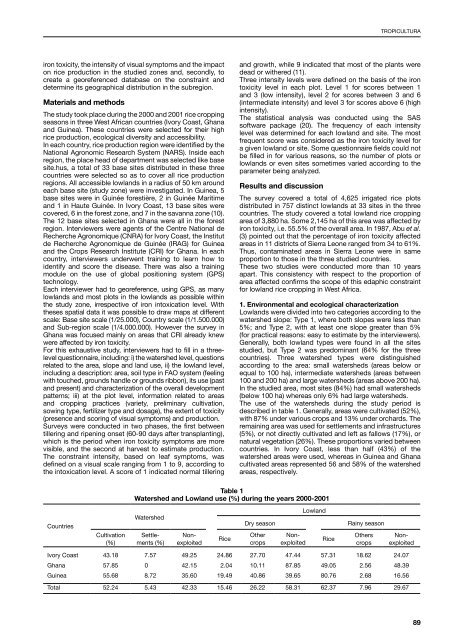
The survey covered a total of 4,625 irrigated rice plots<br />
distributed in 757 distinct lowlands at 33 sites in the three<br />
countries. The study covered a total lowland rice cropping<br />
area of 3,880 ha. Some 2,145 ha of this area was affected by<br />
iron toxicity, i.e. 55.5% of the overall area. In 1987, Abu et al.<br />
(3) pointed out that the percentage of iron toxicity affected<br />
areas in 11 districts of Sierra Leone ranged from 34 to 61%.<br />
Thus, contaminated areas in Sierra Leone were in same<br />
proportion to those in the three studied countries.<br />
These two studies were conducted more than 10 years<br />
apart. This consistency with respect to the proportion of<br />
area affected confirms the scope of this edaphic constraint<br />
for lowland rice cropping in West Africa.<br />
1. Environmental and ecological characterization<br />
Lowlands were divided into two categories according to the<br />
watershed slope: Type 1, where both slopes were less than<br />
5%; and Type 2, with at least one slope greater than 5%<br />
(for practical reasons: easy to estimate by the interviewers).<br />
Generally, both lowland types were found in all the sites<br />
studied, but Type 2 was predominant (64% for the three<br />
countries). Three watershed types were distinguished<br />
according to the area: small watersheds (areas below or<br />
equal to 100 ha), intermediate watersheds (areas between<br />
100 and 200 ha) and large watersheds (areas above 200 ha).<br />
In the studied area, most sites (84%) had small watersheds<br />
(below 100 ha) whereas only 6% had large watersheds.<br />
The use of the watersheds during the study period is<br />
described in table 1. Generally, areas were cultivated (52%),<br />
with 87% under various crops and 13% under orchards. The<br />
remaining area was used for settlements and infrastructures<br />
(5%), or not directly cultivated and left as fallows (17%), or<br />
natural vegetation (26%). These proportions varied between<br />
countries. In Ivory Coast, less than half (43%) of the<br />
watershed areas were used, whereas in Guinea and Ghana<br />
cultivated areas represented 56 and 58% of the watershed<br />
areas, respectively.<br />
Other<br />
crops<br />
Non-<br />
exploited<br />
Rice<br />
Others<br />
crops<br />
Non-<br />
exploited<br />
Ivory Coast 43.18 7.57 49.25 24.86 27.70 47.44 57.31 18.62 24.07<br />
Ghana 57.85 0 42.15 2.04 10.11 87.85 49.05 2.56 48.39<br />
Guinea 55.68 8.72 35.60 19.49 40.86 39.65 80.76 2.68 16.56<br />
Total 52.24 5.43 42.33 15.46 26.22 58.31 62.37 7.96 29.67<br />
89