Analyse exploratoire de données - Fabrice Rossi
Analyse exploratoire de données - Fabrice Rossi
Analyse exploratoire de données - Fabrice Rossi

You also want an ePaper? Increase the reach of your titles
YUMPU automatically turns print PDFs into web optimized ePapers that Google loves.
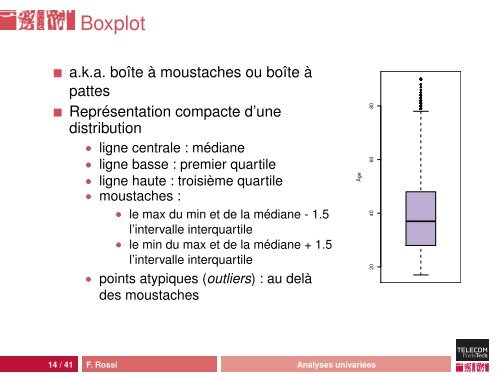
Boxplot<br />
a.k.a. boîte à moustaches ou boîte à<br />
pattes<br />
Représentation compacte d’une<br />
distribution<br />
• ligne centrale : médiane<br />
• ligne basse : premier quartile<br />
• ligne haute : troisième quartile<br />
• moustaches :<br />
• le max du min et <strong>de</strong> la médiane - 1.5<br />
l’intervalle interquartile<br />
• le min du max et <strong>de</strong> la médiane + 1.5<br />
l’intervalle interquartile<br />
• points atypiques (outliers) : au <strong>de</strong>là<br />
<strong>de</strong>s moustaches<br />
Âge<br />
20 40 60 80<br />
14 / 41 F. <strong>Rossi</strong> <strong>Analyse</strong>s univariées