BAROMÃTRE SOLAIRE THERMIQUE ET - EurObserv'ER
BAROMÃTRE SOLAIRE THERMIQUE ET - EurObserv'ER
BAROMÃTRE SOLAIRE THERMIQUE ET - EurObserv'ER

You also want an ePaper? Increase the reach of your titles
YUMPU automatically turns print PDFs into web optimized ePapers that Google loves.
66<br />
solar thermal and concentrated solar power barometer<br />
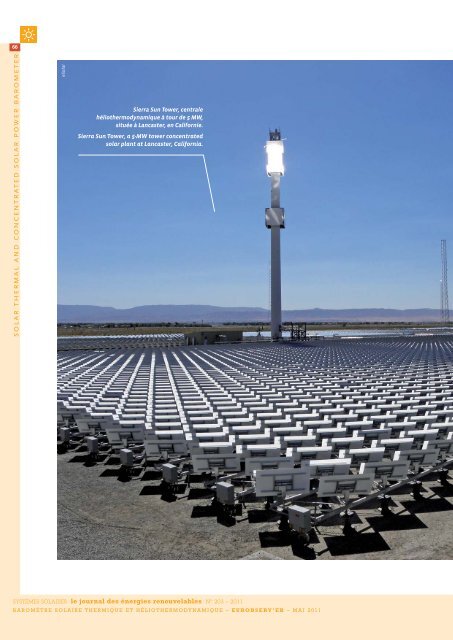
eSolar<br />
Sierra Sun Tower, centrale<br />
héliothermodynamique à tour de 5 MW,<br />
située à Lancaster, en Californie.<br />
Sierra Sun Tower, a 5-MW tower concentrated<br />
solar plant at Lancaster, California.<br />
SYSTÈMES <strong>SOLAIRE</strong>S le journal des énergies renouvelables N° 203 – 2011<br />
BAROMÈTRE <strong>SOLAIRE</strong> <strong>THERMIQUE</strong> <strong>ET</strong> HÉLIOTHERMODYNAMIQUE – EUROBSERV’ER – MAI 2011
67baromètre solaire thermique et héliothermodynamique<br />
638,4 MWe<br />
La puissance électrique des centrales<br />
héliothermodynamiques de l’UE fin 2010<br />
The CSP plant electrical generating capacity<br />
in the EU at the end of 2010<br />
BAROMÈTRE<br />
<strong>SOLAIRE</strong> <strong>THERMIQUE</strong> <strong>ET</strong><br />
HÉLIOTHERMODYNAMIQUE<br />
SOLAR THERMAL AND<br />
CONCENTRATED SOLAR<br />
POWER BAROM<strong>ET</strong>ER<br />
Une étude réalisée par EurObserv’ER. A study carried out by EurObserv’ER.<br />
Comme attendu, le marché européen du solaire<br />
thermique a continué en 2010 à souffrir de<br />
la crise économique. Pour la deuxième année<br />
consécutive, la surface des capteurs dédiée à la<br />
production d’eau chaude et de chauffage est en<br />
diminution. Selon l’enquête d’EurObserv’ER,<br />
elle a été de 3,8 millions de m 2 en 2010, contre<br />
4,2 millions en 2009 et 4,6 millions en 2008. Parallèlement<br />
aux applications de production de chaleur,<br />
se précise le développement de la filière<br />
solaire européenne haute température dédiée<br />
à la production d’électricité, avec 638,4 MW<br />
déjà installés. L’Espagne représente la quasitotalité<br />
de cette puissance, mais cinq autres<br />
pays de l’Union, pour la plupart méditerranéens,<br />
ont prévu de développer la filière.<br />
As could be expected, the recession cast long<br />
shadows over the European solar thermal<br />
market throughout 2010. For the second year<br />
running, new installations for hot water production<br />
and space heating (collectors) de crea -<br />
sed. According to the EurObserv’ER survey the<br />
newly-assigned surface area was 3.8 million m 2<br />
in 2010, down from 4.2 million m 2 in 2009 and<br />
4.6 million m 2 in 2008. At the same time, the<br />
European high-temperature solar sector rela -<br />
ted to electricity production has been taking<br />
shape alongside the heat-producing applications,<br />
with 638.4 MW already installed. Spain<br />
accounts for almost all of this capacity, and a<br />
further five EU countries, mostly Mediterranean,<br />
intend to develop the sector.<br />
3 753 644 m 2<br />
La surface de panneaux solaires<br />
thermiques installée durant<br />
l’année 2010<br />
The solar thermal panel surface area<br />
installed during 2010<br />
25 135,6 MWth<br />
La puissance du parc solaire thermique<br />
de l’UE fin 2010<br />
The EU’s solar thermal base to date<br />
at the end of 2010<br />
SYSTÈMES <strong>SOLAIRE</strong>S le journal des énergies renouvelables N° 203 – 2011<br />
SOLAR THERMAL AND CONCENTRATED SOLAR POWER BAROM<strong>ET</strong>ER – EUROBSERV’ER – MAY 2011
68<br />
600 °C<br />
La température du fluide caloporteur susceptible d’être<br />
atteinte dans les centrales à tour/Heat transfer fluid is<br />
likely to rise to this temperature in tower plants<br />
solar thermal and concentrated solar power barometer<br />
1. Le capteur solaire thermique à air est composé<br />
d’une surface vitrée ou métallique à travers laquelle<br />
circule l’air extérieur qui y est réchauffé. L’air est directement<br />
aspiré et distribué par un ventilateur dans le<br />
bâtiment via une gaine de ventilation. Ce dispositif<br />
peut également être connecté à un système de chauffage<br />
et de climatisation.<br />
2. Ces technologies ne doivent pas être confondues<br />
avec celles des centrales solaires photovoltaïques, qui<br />
utilisent les propriétés des semi-conducteurs (le plus<br />
souvent le silicium), lesquels, au contact de la lumière,<br />
génèrent un courant électrique.<br />
Jusqu’à la précédente édition, le baromètre<br />
solaire thermique ne s’intéressait<br />
qu’au développement de la filière<br />
solaire thermique européenne dédiée à la<br />
production d’eau chaude sanitaire et de<br />
chauffage. Cette filière regroupe les technologies<br />
des capteurs plans vitrés, des capteurs<br />
à tubes sous vide et des capteurs non<br />
vitrés. Ne sont pas pris en considération les<br />
capteurs solaires thermiques à air 1 , technologie<br />
très peu répandue au sein des pays<br />
de l’Union européenne.<br />
Depuis quelques années, se confirme<br />
l’émergence d’une autre filière du solaire<br />
thermique, dédiée cette fois à la production<br />
d’électricité. Elle développe les technologies<br />
des centrales solaires thermodynamiques<br />
à concentration, également appelées<br />
centrales héliothermodynamiques 2 .<br />
Contrairement aux capteurs solaires thermiques<br />
destinés à la production d’eau chaude,<br />
les centrales héliothermodynamiques<br />
sont dépendantes d’un ensoleillement quasi<br />
parfait, ce qui, dans l’Union européenne,<br />
réduit géographiquement les zones d’implantation<br />
à certains pays méditerranéens.<br />
À partir de cette année, le baromètre sera<br />
l’occasion de faire le point sur le développement<br />
de ces deux grands modes de valorisation<br />
de l’énergie solaire thermique (basse<br />
température et haute température) au<br />
sein des pays de l’Union européenne.<br />
valorisation électrique :<br />
les centrales solaires<br />
thermodynamiques<br />
à concentration<br />
une filière multitechnologie<br />
Les centrales héliothermodynamiques recouvrent<br />
l’ensemble des technologies visant à<br />
transformer l’énergie du rayonnement<br />
solaire en chaleur de haute température,<br />
puis à convertir cette chaleur en énergie<br />
électrique. Le principe général d’une centrale<br />
consiste à utiliser des miroirs pour<br />
concentrer les rayons du soleil sur un fluide<br />
qui se vaporise. La vapeur ainsi obtenue<br />
actionne une turbine qui produit de l’électricité.<br />
La technologie des centrales solaires<br />
cylindro-paraboliques, dont la capacité peut<br />
varier de 50 à 300 MW, est la plus courante<br />
sur le marché de l’héliothermodynamique à<br />
con centration. Elle utilise des miroirs de forme<br />
cylindro-parabolique qui concentrent les<br />
rayons du soleil vers un tube absorbeur où<br />
circule un fluide caloporteur. Ce dernier<br />
peut atteindre une température de l’ordre<br />
de 400 °C, permettant la production d’électricité.<br />
Certaines centrales sont équipées<br />
de systèmes de stockage. Le surplus d’énergie<br />
non utilisée durant la journée peut être<br />
stocké sous forme de chaleur en utilisant<br />
des sels fondus, ou d’autres matériaux à<br />
changement de phase. Cette chaleur emmagasinée<br />
permet à la centrale de continuer à<br />
produire de l’électricité après le coucher du<br />
soleil. La centrale d’Andasol 1, par exemple,<br />
actuellement exploitée en Espagne, bénéficie<br />
quotidiennement d’une durée de fonctionnement<br />
supplémentaire de 7 heures 30.<br />
Autre technologie actuellement exploitée, les<br />
centrales solaires à tour, dont la puissance<br />
est comprise entre 10 et 50 MW. Ce type de<br />
centrale utilise de grands miroirs presque<br />
plats de plus de 100 m 2 , appelés héliostats.<br />
Des centaines de miroirs sont disposées de<br />
façon à concentrer le rayonnement solaire<br />
vers un point situé au sommet d’une tour. Le<br />
niveau de température dépend du type de<br />
fluide et peut atteindre 600 °C. Actuellement,<br />
les centrales PS10 (11 MW) et PS20 (20 MW),<br />
Centrale solaire à tour PS 10 (11 MW),<br />
Séville (Espagne).<br />
The PS 10 (11-MW) tower solar plant,<br />
Seville (Spain).<br />
Abengoa Solar<br />
SYSTÈMES <strong>SOLAIRE</strong>S le journal des énergies renouvelables N° 203 – 2011<br />
BAROMÈTRE <strong>SOLAIRE</strong> <strong>THERMIQUE</strong> <strong>ET</strong> HÉLIOTHERMODYNAMIQUE – EUROBSERV’ER – MAI 2011
69baromètre solaire thermique et héliothermodynamique<br />
Centrale de type cylindro-parabolique<br />
Alvarado 1 (50 MW), Badajoz, Espagne.<br />
- Alvarado 1 (50-MW) cylindro-parabolic<br />
type plant at Badajoz, Spain.<br />
ACCIONA-JCampos<br />
clipsol<br />
U<br />
p to the previous edition of EurObserver Barometer series,<br />
the solar thermal barometer provided coverage of the development<br />
of the European solar thermal sector dedicated to<br />
hot water production and heating exclusively, which includes the<br />
flat glazed collector, vacuum tube collector and unglazed collector<br />
technologies, but excludes air collectors 1 – a technology seldom<br />
applied in the EU.<br />
For a number of years, another solar thermal sector related to electricity<br />
production has been emerging. It is called Concentrating<br />
Solar Power, also known as thermodynamic solar plant technologies<br />
2 . In contrast with solar thermal collectors for hot water production,<br />
Concentrated Solar Power (CSP) plants need conditions<br />
with a high share of direct sunlight (in contrast to solar PV, which<br />
may also function well in regions with more indirect sunlight due<br />
to clouds). In the European Union viable siting is geographically<br />
restricted to a few Mediterranean countries and is currently virtually<br />
limited to developments in Spain. From this year onwards,<br />
the barometer will report back on the development of these two<br />
major solar thermal energy technologies (low-temperature heat<br />
and high-temperature technologies for electricity generation) in<br />
the European Union.<br />
electricity generation<br />
concentrated solar power plants<br />
a multitechnology sector<br />
Concentrating Solar Power (CSP) plants use all the technologies<br />
applied to transform sunlight into high-temperature heat and<br />
1. The air-type solar collector comprises a glazed or metal surface. The outside<br />
air circulates and is heated there, having been sucked in directly and distributed<br />
by a ventilator in the building via a ventilation shaft. The device can also be<br />
connected to a heating and air-conditioning system.<br />
2. These technologies should not be mistaken for solar photovoltaic plants that<br />
use the properties of (usually silicon) semi-conductors that generate an electric<br />
current when in contact with light.<br />
then convert that heat into electrical energy. The general principle<br />
of a CSP plant entails using mirrors to concentrate the sun’s<br />
rays on a fluid that vaporises. The heat from this fluid is transferred<br />
in a heat exchanger to a water-steam cycle, which drives a<br />
turbine and a generator to generate electricity. The most wides -<br />
pread technology in the CSP sector is a CSP plant based on cylindro-parabolic<br />
mirror technology (also called solar trough plants)<br />
with capacities ranging from 50 to 300 MW. Cylindro-parabolic mirrors<br />
concentrate the sun’s rays on an absorber tube containing a<br />
heat-transfer fluid that can be heated to temperatures of around<br />
400°C and generate electricity based on heat transfer to a conventional<br />
water-steam cycle. Some plants are equipped with storage<br />
systems enabling unused, surplus energy to be stored in the<br />
form of heat in molten salt or some other phase-changing material.<br />
The plant can then draw on the stored heat to generate electricity<br />
after sunset. Spain’s Andasol 1 plant, for example, currently<br />
uses this system to operate for an additional 7½ hours every<br />
day.<br />
Alternatively, solar power is harnessed in 10 to 50 MW-capacity<br />
solar tower CSP plants that use heliostats – huge, almost flat mirrors<br />
over 100 m 2 in surface area. They are arranged in large numbers<br />
(up to hundreds) to concentrate the sun’s rays on a point at<br />
the top of a tower, heating the heat-transfer fluid (generally a<br />
salt) up to as much as 600°C. The only two commercially operating<br />
plants of this type are PS10 (11 MW) and PS20 (20 MW), near<br />
Seville, Spain. Another solartower CSP plant, Gemasolar (17 MW),<br />
should come on stream this year and is also sited in the Seville<br />
region. Its design storage capacity is for up to 15 hours which<br />
should support almost round-the-clock production, and enable<br />
the plant to supplement electricity generation based on fossil<br />
fuels or nuclear energy. There are other technologies in the stage<br />
of development and demonstration that are not yet used on an<br />
industrial scale. For instance, Fresnel linear collectors that are a<br />
variant on a CSP plant based on cylindro-parabolic mirror technology,<br />
which instead of using a trough-shaped mirror, have sets<br />
of small flat mirrors arranged in parallel and longitudinally on<br />
SYSTÈMES <strong>SOLAIRE</strong>S le journal des énergies renouvelables N° 203 – 2011<br />
SOLAR THERMAL AND CONCENTRATED SOLAR POWER BAROM<strong>ET</strong>ER – EUROBSERV’ER – MAY 2011
70<br />
solar thermal and concentrated solar power barometer<br />
Tabl. n°1<br />
Centrales héliothermodynamiques en service à la fin de l’année 2010<br />
Concentrated solar power plants in operation at the end of 2010<br />
Projet<br />
Project<br />
Technologie<br />
Technology<br />
Puissance (en MW)<br />
Capacity (in MW)<br />
Mise en service<br />
Commissioning date<br />
Spain<br />
Planta Solar 10 Central receiver 11 2007<br />
Andasol-1 Parabolic trough 50 2008<br />
Planta Solar 20 Central receiver 20 2009<br />
Ibersol Ciudad Real (Puertollano) Parabolic trough 50 2009<br />
Puerto Errado 1 (prototype) Linear Fresnel 1,4 2009<br />
Alvarado I La Risca Parabolic trough 50 2009<br />
Andasol-2 Parabolic trough 50 2009<br />
Extresol-1 Parabolic trough 50 2010<br />
Solnova 1 Parabolic trough 50 2010<br />
Solnova 3 Parabolic trough 50 2010<br />
Solnova 4 Parabolic trough 50 2010<br />
La Florida Parabolic trough 50 2010<br />
Majadas Parabolic trough 50 2010<br />
La Dehesa Parabolic trough 50 2010<br />
Palma del Río II Parabolic trough 50 2010<br />
Total Spain 632,4<br />
Italy<br />
Archimede (prototype) Parabolic trough 5 2010<br />
Total Italy 5<br />
France<br />
La Seyne-sur-Mer (prototype) Linear Fresnel 1 2010<br />
Total France 1<br />
Total EU 638,4<br />
Central receiver plants. Centrales solaires à tour – Parabolic trough plants. Centrales solaires cylindro-paraboliques – Linear Fresnel systems. Collecteurs<br />
linéaires de Fresnel. Les décimales sont séparées par une virgule. Decimals are written with a comma. Source : EurObserv’ER 2011.<br />
situées dans la ville de Séville en Espagne,<br />
sont les deux seules centrales commerciales<br />
de ce type en opération. Une autre centrale<br />
à tour devrait être opérationnelle cette<br />
année, il s’agit de Gemasolar (17 MW), également<br />
située dans la région de Séville. Elle<br />
bénéficiera d’une capacité de stockage<br />
allant jusqu’à 15 heures afin d’assurer une<br />
production quasi continue. Cette plage de<br />
production permettra à la centrale de suppléer<br />
directement l’énergie issue des combustibles<br />
fossiles ou de l’énergie nu cléaire.<br />
D’autres technologies se développent, mais<br />
pas encore à une échelle industrielle. C’est<br />
le cas des collecteurs linéaires de Fresnel. Il<br />
s’agit d’une variante de la technologie cylindro-parabolique,<br />
mais au lieu de se servir<br />
d’un miroir en auge, des ensembles de petits<br />
miroirs plats, positionnés parallèlement et<br />
de façon linéaire, sont utilisés. Autre différence,<br />
le tube absorbeur qui concentre le<br />
rayonnement est fixe et ce sont les miroirs<br />
qui s’inclinent afin de suivre la course du<br />
soleil. Le fluide est chauffé et se transforme<br />
en vapeur dont la température peut<br />
atteindre 450 °C. À ce jour, seuls des prototypes<br />
sont en fonctionnement, comme celui<br />
de Puerto 1 (1,4 MW), opérationnel depuis<br />
2009 dans la région espagnole de Murcie. Une<br />
deuxième centrale de 30 MW, Puerto Errado<br />
2, est actuellement en cons truction et devrait<br />
devenir en 2012 la 1 re centrale commerciale<br />
de ce type. Des centrales de capacité inférieure<br />
ou égale à 150 MW sont en cours de<br />
développement, mais pas en Europe.<br />
Une technologie alternative est le système<br />
parabole-stirling (ou dish stirling). Celui-ci<br />
ne produit pas de la vapeur pour faire tourner<br />
une turbine, mais utilise un con -<br />
centrateur en forme de parabole (composé<br />
de miroirs paraboliques) pour capter la chaleur<br />
du soleil sur un récepteur situé sur le<br />
point focal de la parabole. Ce dispositif, qui<br />
suit le soleil, chauffe un gaz (hélium ou<br />
hydrogène) à des températures supérieures<br />
à 600 °C, actionnant ainsi un moteur Stirling<br />
produisant lui-même de l’électricité. La<br />
puissance de ces unités est limitée entre 10<br />
et 25 kW. Elles peuvent donc répondre à des<br />
besoins de production isolés, mais également<br />
à des projets de grande échelle quand<br />
des milliers de paraboles sont regroupées<br />
sur un même terrain. Deux projets cumulant<br />
une puissance de 1,4 GW sont en cours<br />
de construction aux États-Unis, mais aucune<br />
SYSTÈMES <strong>SOLAIRE</strong>S le journal des énergies renouvelables N° 203 – 2011<br />
BAROMÈTRE <strong>SOLAIRE</strong> <strong>THERMIQUE</strong> <strong>ET</strong> HÉLIOTHERMODYNAMIQUE – EUROBSERV’ER – MAI 2011
71baromètre solaire thermique et héliothermodynamique<br />
an incline. Furthermore, the absorber tube that concentrates the<br />
rays is stationary and the mirrors follow the course of the sun.<br />
The fluid is heated to a temperature of up to 450°C. For the time<br />
being only prototypes are operating, such as Puerto Errado 1 (1.4<br />
MW), which has been running since 2009 in the Murcia region of<br />
Spain. A second 30-MW plant, Puerto Errado 2, is under construction<br />
and is due to come on stream in 2012 as the first commercially-run<br />
Fresnel-type plant. Development is under way on larger<br />
(150-MW and more) plants, but they are outside Europe.<br />
Another alternative technology is the dish Stirling system, based<br />
on a dish-shaped concentrator (comprising parabolic mirrors) to<br />
capture the sunlightand focus it on a receiver at the focal point<br />
of the parabolic dish. The parabolic dish system, which tracks the<br />
sun, uses a gas (helium or hydrogen) that is heated in the receiver<br />
to temperatures in excess of 600°C to drives a Stirling engine coupled<br />
with a generator. The capacity of these units is limited to<br />
10–25 kW, which will meet isolated production needs. Alternatively,<br />
parabolic dish CSP plants may be built as large-scale plants<br />
whith thousands of parabolic dishes grouped together on a single<br />
site. Two projects with an aggregate capacity of 1.4 GW are<br />
under construction in the United States, but no industrial-scale<br />
ventures have been identified in Europe.<br />
round-up on the european union<br />
The 2010 year-end capacity figure for European Union CSP power<br />
plants was around 638.4 MW, which is 406 MW more than in 2009<br />
(table 1 and graph 1).<br />
Virtually all of this capacity, namely 632.4 MW, is located in Spain<br />
according to the IDAE, and spread across 15 plants including prototypes<br />
(12 of the cylindro-parabolic type, 2 tower plants and 1 Fresnel<br />
type plant).<br />
Eight of the twelve 50-MW plants were commissioned in 2010, producing<br />
742 GWh, up from 209 GWh in 2009 (a 255.2% leap) as<br />
metered by REE (Red Eléctrica de España). However, this figure is<br />
unrepresentative of the installed capacity because most of it was<br />
connected to the grid in the autumn. According to Protermo Solar<br />
(the Spanish Concentrating Solar Power Industry Association), the<br />
design output of these plants is 1 851 GWh, which equates to an<br />
annual load factor of 31 % (2 712 full-load hours out of 8 760 hours<br />
in a year).<br />
Sector build-up is following a tight schedule. At the start of this<br />
year (2011), two new 50-MW plants were connected up, raising<br />
Spanish electric Concentrating Solar Power plant capacity to 732.4<br />
MW (table 2). Protermo Solar notes that another 20 projects with<br />
an aggregate capacity of 898 MW are under construction and will<br />
be up and running between 2011 and 2012. This additional capacity<br />
should give Spain 1 630.4 MW of CSP capacity from 2012<br />
onwards. A host of projects are close to kick-off, as 23 plants with<br />
an aggregate capacity amounting to 842 MW are awaiting<br />
approval for the preliminary assignment of remuneration register.<br />
The procedure, which was introduced in Royal Decree 6/2009,<br />
transfers the power to grant project approval for eligibility for<br />
production aid to the central rather than regional government.<br />
The move is aimed to regulate installed capacity build-up from<br />
the national perspective, which for the CSP sector is 5 079 MW of<br />
thermodynamic solar capacity by 2020.<br />
At the end of 2010, a change to the incentive system, reflected by<br />
Graph. n°1<br />
Évolution de la puissance héliothermodynamique installée<br />
dans l’Union européenne (en MWe)<br />
European Union concentrated solar power capacity trend<br />
(in MWe)<br />
11<br />
61<br />
232,4<br />
638,4<br />
2007 2008 2009 2010<br />
Source : EurObserv’ER 2011.<br />
Royal Decree 1614/2010 caused serious financial difficulties for<br />
operators of CSP plants. Whereas in 2010, operators could choose<br />
between the regulated FiT, set that very same year at € 0.285/kWh<br />
or a € 0.268/kWh premium in addition to the market price, they<br />
have to opt for the regulated FiT for the first year of operation<br />
from 2011 onwards. The number of operating hours eligible for the<br />
FiT has also been reduced. The technologies used and storage<br />
capacities (that enable electricity production to continue after<br />
sunset) have little in common. Hence production ranges from 6 450<br />
full-load hours for tower-based CSP plants technology with 15<br />
hours of storage capability to 2 350 full-load hours for dish Stirling<br />
plants. In the case of cylindro-parabolic plants operation can vary<br />
from 2 855 hours with no energy storage system to 3 450 hours<br />
with 4 hours of storage, 3 950 with 7 hours, and 4 000 with 9 hours<br />
of storage. Fresnel plants operate for 2 450 hours per annum.<br />
The Spanish groups Abengoa Solar, Acciona Solar power and<br />
ACS/Cobra are constructing these plants, and source their cylindro-parabolic<br />
mirrors mainly from Rioglass of Spain and Flabeg<br />
of Germany.<br />
The French government’s enthusiasm for developing an industrial<br />
Concentrating Solar Power sector is demonstrated by its Call<br />
for Expressions of Interest (EOI). The sum of 1.35 billion Euros has<br />
been earmarked to encourage the development of innovative<br />
solar technologies such as Concentrating Solar Power (based on<br />
thermal energy conversion) and concentrated photovoltaic power<br />
(PV). This fund could be used for research and pre-industrial<br />
demonstrators and technology platforms for thermodynamic<br />
solar technologies and systems. The government has set its sights<br />
on developing a French leading-edge innovation sector that will<br />
sell its know-how to very sunny countries such as the Mediter-<br />
SYSTÈMES <strong>SOLAIRE</strong>S le journal des énergies renouvelables N° 203 – 2011<br />
SOLAR THERMAL AND CONCENTRATED SOLAR POWER BAROM<strong>ET</strong>ER – EUROBSERV’ER – MAY 2011
72<br />
solar thermal and concentrated solar power barometer<br />
Kimberlina, centrale de 5 MW,<br />
à miroirs de Fresnel, installée en Californie.<br />
Kimberlina – a 5-MW Fresnel-mirror<br />
plant in California.<br />
Areva<br />
SYSTÈMES <strong>SOLAIRE</strong>S le journal des énergies renouvelables N° 203 – 2011<br />
BAROMÈTRE <strong>SOLAIRE</strong> <strong>THERMIQUE</strong> <strong>ET</strong> HÉLIOTHERMODYNAMIQUE – EUROBSERV’ER – MAI 2011
73baromètre solaire thermique et héliothermodynamique<br />
7 044 MWe<br />
La puissance des centrales héliothermodynamiques<br />
de l’UE prévue pour fin 2020/The forecast capacity<br />
of the EU’s CSP plants by the end of 2020<br />
Tabl. n°2<br />
Centrales héliothermodynamiques en construction au<br />
1 er janvier 2011/Concentrated solar power plants in<br />
construction at the beginning of 2011<br />
Projet<br />
Project<br />
Spain<br />
Technologie Puissance (en MW)<br />
Technology Capacity (in MW)<br />
Extresol-2* Parabolic trough 50<br />
Manchasol 1* Parabolic trough 50<br />
Casa del Angel Dish Stirling 1<br />
Puerto Errado 2 Linear Fresnel 30<br />
Andasol 3 Parabolic trough 50<br />
Palma del Rio 1 Parabolic trough 50<br />
Gemasolar Central receiver 17<br />
Helioenergy 1 Parabolic trough 50<br />
Helioenergy 2 Parabolic trough 50<br />
Lebrija 1 Parabolic trough 50<br />
Termosol-50 Parabolic trough 50<br />
Arcosol-50 Parabolic trough 50<br />
Aries Solar 2 Parabolic trough 50<br />
Aries Solar 1A Parabolic trough 50<br />
Aries Solar 1B Parabolic trough 50<br />
Sol Guzman Parabolic trough 50<br />
Helios 1 Parabolic trough 50<br />
Helios 2 Parabolic trough 50<br />
Solacor 1 Parabolic trough 50<br />
Solacor 2 Parabolic trough 50<br />
Solaben 2 Parabolic trough 50<br />
Solaben 3 Parabolic trough 50<br />
Total Spain 998<br />
* Mise en service au début de l’année 2011.<br />
In operation at the beginning of the year 2011.<br />
Central receiver plants. Centrales solaires à tour – Parabolic trough<br />
plants. Centrales solaires cylindro-paraboliques – Linear Fresnel systems.<br />
Collecteurs linéaires de Fresnel – Dish Stirling systems. Paraboles<br />
solaires Dish Sterling.<br />
Source : EurObserv’ER 2011.<br />
ranean countries, Africa, the Middle-East and Australia rather<br />
than install dozens of plants in France. There are significant economic<br />
and development hurdles to be overcome before they<br />
achieve technological and business validation. The CSP capacity<br />
to be installed in France is restricted by the dearth of available<br />
land and less than ideal exposure to sunshine, so a CSP capacity<br />
target has been set at 540 MW by 2020 in the French National<br />
Renewable Energy Action Plan (NREAP). By that date partnership<br />
agreements may be signed with some of the Maghreb countries<br />
for the construction of CSP plants connected to the European grid<br />
via Spain.<br />
Several prototypes and demonstrators should emerge in the next<br />
few years. The CNIM group has installed a 1-MW prototype based<br />
on Fresnel mirrors at La Seyne-sur-Mer and is considering building<br />
a demonstrator in the Pyrenees Orientales. Solar Euromed also<br />
intends to site a prototype in the Pyrenees, followed by two industrial<br />
demonstrators, dubbed Alba Nova 1 and 2 in Corsica. It has<br />
announced the signing of a framework contract with the Sudan<br />
to install 2 000 MW of CSP capacity at Darfur. The best-placed<br />
French concern appears to be Areva Solar, the solar subsidiary of<br />
the nuclear power group, which offers turnkey solutions using<br />
Fresnel-type plant technology. A 5-MW plant (Kimberlina) is the<br />
first to be installed in California for 20 years, and the first to use<br />
this technology on American soil. In April 2011, the French group<br />
also announced it had closed a contract to construct a 44-MW<br />
Fresnel-type CSP plant to be coupled to the Kogan Creek coal-fired<br />
plant in Australia (750 MW) for an estimated 104.7 million AUD, i.e.<br />
77 million Euros. The project will kick off before the end of June<br />
2011 and commercial operation is expected in 2013.<br />
Italy is also committed to the CSP sector. In July 2010, Enel commissioned<br />
a 5-MW cylindro-parabolic plant near the municipality<br />
of Priolo Gargallo, Sicily. The Archimede project, as it is known,<br />
uses molten salt as the heat transfer fluid and energy storage<br />
medium.<br />
ANEST, the Italian Association for Solar Thermodynamic Energy,<br />
reckons that the construction of between 3 000 and 5 000 MW by<br />
2020 is feasible despite the fact that the country’s NREAP plan has<br />
only 600 MW of capacity pencilled in for that timeline.<br />
a tantalizing sector<br />
The future of the CSP sector is promising. The first projects<br />
installed in the United States in the 1980s have provided over 25 years<br />
of technology tweaking and maturing and resulted in commercially-viable<br />
production costs for starting large-scale industrial<br />
and commercial development in several regions across the globe<br />
– Europe, North America, North Africa, and (in the near term) the<br />
Middle-East, Asia, and Oceania.<br />
These plants offer a number of advantages for production as it<br />
becomes predictable and even continuous during the night provided<br />
the plants are equipped with storage systems. Furthermore<br />
they can be coupled to biomass-, coal- or gas-fuelled thermal power<br />
plants. By adopting either of these two configurations grid fluctuations<br />
can be ironed out, encouraging the integration of other<br />
intermittent renewable energy sources such as photovoltaic or<br />
wind power. Costs, which have come down dramatically, are continuing<br />
to drop because of equipment and component innovations,<br />
enhanced energy efficiency, the extended operating hours<br />
yielded by increased storage capacity, the learning curve and<br />
economies of scale.<br />
Six European Union countries have announced installation targets<br />
in their NREAPs amounting to 7 044 MW of capacity in 2020, with<br />
an intermediate stage set at 3 573 MW by 2015. In addition to the<br />
targets – already highlighted – of Spain, France and Italy already<br />
mentioned, the NREAPs envision 500 MW for Portugal, 250 MW for<br />
Greece and 75 MW for Cyprus. The electricity output provided by<br />
these plants is put at around 20 TWh in 2020 compared to just over<br />
9 TWh in 2015. The sector’s progress is consistent with the targets<br />
set in the NREAPs exercise, and the targets for development of the<br />
CSP technology may be met (graph 2).<br />
The European Solar Thermal Electricity Association (Estela) reckons<br />
that growth could be much faster, and forecasts 30 000 MW<br />
of installed capacity by 2020 (equivalent to output of 89.8 TWh p.a.)<br />
SYSTÈMES <strong>SOLAIRE</strong>S le journal des énergies renouvelables N° 203 – 2011<br />
SOLAR THERMAL AND CONCENTRATED SOLAR POWER BAROM<strong>ET</strong>ER – EUROBSERV’ER – MAY 2011
74<br />
solar thermal and concentrated solar power barometer<br />
Graph. n°2<br />
Tendance actuelle de la puissance des centrales héliothermodynamiques par rapport<br />
à la feuille de route des plans d’action nationaux énergies renouvelables (en MW)/<br />
Comparison of the current trend of CSP plants against the NREAP (National<br />
Renewable Energy Action Plans) roadmap (in MW)<br />
7 044 7 044<br />
61<br />
NREAP<br />
232,4<br />
réalisation de taille industrielle n’est<br />
actuellement recensée en Europe.<br />
situation dans<br />
l’union européenne<br />
638,4 637<br />
3 573 3 573<br />
2008 2009 2010 2015 2020<br />
Source : EurObserv’ER 2011.<br />
À la fin de l’année 2010, la puissance des<br />
centrales héliothermodynamiques de<br />
l’Union européenne destinées à la production<br />
d’élec tricité est de l’ordre de 638,4 MW,<br />
soit 406 MW de plus qu’en 2009 (tableau 1<br />
et graphique 1).<br />
Cette puissance brute, qui inclut les prototypes,<br />
est presque intégralement située en<br />
Espagne avec, selon l’IDAE, 632,4 MW installés<br />
fin 2010, et répartie entre 15 centrales<br />
(12 de type cylindro-parabolique, 2 centrales<br />
à tour et 1 de type Fresnel).<br />
Sur ce total, 8 centrales d’une puissance<br />
unitaire de 50 MW ont été raccordées au<br />
réseau durant l’année 2010. La production<br />
d’électricité de ces centrales a été mesurée<br />
en 2010, selon REE (Red Electrica de Es -<br />
paña), à 742 GWh, contre 209 GWh en 2009<br />
(+ 255,2 %). Celle-ci n’est pas représentative<br />
de la puissance installée car une part importante<br />
de la puissance a été connectée durant<br />
le dernier trimestre de l’année. Selon Protermo<br />
Solar (asso ciation espagnole des centrales<br />
solaires thermodynamiques à con -<br />
centration), la production théorique de ces<br />
centrales s’élève à 1 851 GWh, ce qui correspond<br />
à un facteur de charge (nombre<br />
d’heures de production à puissance nominale)<br />
de 2 712 heures par an.<br />
La montée en puissance de la filière est<br />
programmée. En ce début d’année 2011,<br />
2 nouvelles centrales de 50 MW ont été raccordées,<br />
portant la puissance héliothermodynamique<br />
espagnole à 732,4 MW (tableau<br />
2). Selon Protermo Solar, 20 autres projets<br />
sont en cours de construction et seront opérationnels<br />
entre 2011 et 2012 pour un total de<br />
898 MW. Cette puissance additionnelle de -<br />
vrait permettre au pays de disposer d’une<br />
puissance connectée au réseau de 1 630,4<br />
MW dès 2012. De nombreuses autres réalisations<br />
sont susceptibles de voir le jour prochainement.<br />
23 projets pour un total de 842<br />
MW sont en attente d’autorisation dans le<br />
cadre du registre des préaffectations. Ce dernier<br />
a été mis en place par le Décret royal<br />
6/2009. Une procédure qui nécessite que le<br />
gouvernement central donne préalablement<br />
son aval au projet pour qu’il puisse bénéficier<br />
du système d’aide à la production, alors<br />
qu’auparavant cette prérogative était du ressort<br />
des gouvernements régionaux. Le but<br />
est de mieux contrôler le développement des<br />
capacités installées en accord avec les objectifs<br />
fixés par le pays. L’ambition de la filière<br />
est de disposer d’une puissance héliothermodynamique<br />
de 5 079 MW en 2020.<br />
À la fin de l’année 2010, les acteurs ont dû<br />
faire face à une modification du régime d’incitation<br />
des centrales héliothermodynamiques,<br />
via le Décret royal 1614/2010. En<br />
2010, l’exploitant avait le choix entre le tarif<br />
régulé, fixé cette même année à 28,5 c€/kWh,<br />
et une prime de 26,8 c€/kWh, s’ajoutant au<br />
prix du marché. À partir de 2011, les acteurs<br />
se sont vu imposer d’opter pour le tarif régulé<br />
lors de la première année de fonctionnement.<br />
Le nombre d’heures de fonctionnement<br />
au-delà du quel le tarif ne s’applique<br />
pas a également été réduit. Il est extrêmement<br />
variable selon les technologies et les<br />
capacités de stockage. Le nom bre d’heures<br />
oscille entre 6 450 pour la technologie des<br />
centrales à tour équipées d’un système de<br />
stockage de l’énergie d’une durée de 15<br />
heures, et 2 350 pour les centrales paraboliques/stirling.<br />
Le nombre d’heures des centrales<br />
cylindro-paraboliques varie de 2 855<br />
en l’absence de système de stockage de<br />
l’énergie, à 3 450 pour 4 heures de stockage,<br />
3 950 pour 7 heures, et 4 000 pour 9 heures de<br />
stockage. Les centrales Fresnel disposent<br />
quant à elles d’un quota de 2 450 heures.<br />
Les acteurs majeurs impliqués dans la cons -<br />
truction de ces centrales sont les groupes<br />
espagnols Abengoa Solar, Acciona Solar<br />
Power et ACS/Cobra Group. Les principaux<br />
fournisseurs de miroirs cylindro-paraboliques<br />
de leurs centrales sont l’Espagnol<br />
Rioglass et l’Allemand Flabeg.<br />
En France, l’État a manifesté son intérêt<br />
pour le développement d’une filière industrielle<br />
héliothermodynamique et a annoncé<br />
un Appel à manifestation d’intérêt (AMI).<br />
Au total, 1,35 milliard d’euros ont été débloqués<br />
pour encourager le développement<br />
des technologies solaires innovantes, comme<br />
l’héliothermodynamique, le solaire<br />
thermique et le photovoltaïque à concentration.<br />
Dans le domaine des technologies<br />
et des sys tèmes héliothermodynamiques,<br />
cet ar gent permettra de financer des dé -<br />
mons trateurs de recherche et des démonstrateurs<br />
préindustriels ainsi que des plateformes<br />
technologiques. L’enjeu n’est pas<br />
tant d’installer des dizaines de centrales<br />
sur le territoire, mais de développer une<br />
filière française à la pointe de l’innovation,<br />
et capable de proposer son savoir-faire<br />
dans les pays très ensoleillés, comme les<br />
pays méditerranéens, en Afrique, au<br />
Moyen-Orient ou en Australie. La validation<br />
technique et commerciale de ces technologies<br />
représente des enjeux économiques et<br />
SYSTÈMES <strong>SOLAIRE</strong>S le journal des énergies renouvelables N° 203 – 2011<br />
BAROMÈTRE <strong>SOLAIRE</strong> <strong>THERMIQUE</strong> <strong>ET</strong> HÉLIOTHERMODYNAMIQUE – EUROBSERV’ER – MAI 2011
75baromètre solaire thermique<br />
2 627,6 MWth<br />
La puissance solaire thermique installée<br />
durant l’année 2010 dans l’UE/Solar thermal<br />
capacity installed in the EU during 2010<br />
and 60 000 MW of installed capacity by 2030 (equivalent to output<br />
of 195 TWh p.a.). This expansion would be boosted by setting up a<br />
super grid, linking the various European countries. If the European<br />
Union were to interconnect the European grids with those of<br />
North Africa, the whole picture would change dimension as the<br />
solar thermal sector’s development prospects in the Southern<br />
Mediterranean countries and their neighbours across the see<br />
dwarf those of the rest of Europe. If these technologies were to<br />
flourish in North Africa, production costs would come down even<br />
faster. The setting up of the Mediterranean Solar Plan 3 , essentially<br />
based on solar thermal electricity, is a key element of this development.<br />
The plan could also contribute to achieving the European<br />
Union’s renewable energy objectives for 2020. Article 9 of the<br />
2009/28/CE Directive authorises Member States to import energy<br />
from third countries. Europe’s political and economic role could<br />
be pivotal. If it decides to open up its grid, solar energy could contribute<br />
even more to securing energy supplies, at the same time<br />
quickening the pace of economic development and the installation<br />
of electrical infrastructures around the Mediterranean basin.<br />
The above are major industrial challenges for creating wealth and<br />
employment, in a sector which so far has limited Asian competition.<br />
Such a Mediterranen Solar Plan for CSP calls for huge investments<br />
in grid infrastructures. While they will guarantee a secure<br />
power supply, customers will inevitably have to pay more for their<br />
electricity. Cooperation would also underpin security in North<br />
African countries where the rise in hydrocarbon prices could create<br />
political instability, in a region that is a neighbour of the EU.<br />
heat recovery: glazed and unglazed<br />
solar thermal collectors<br />
indivi dual and multi-occupancy building segment, the available<br />
space is often insufficient to accommodate both types of collectors<br />
and power-producing collectors (solar PV) tend to take prefe -<br />
rence because they are seen to be more lucrative.<br />
While these three factors limit the solar thermal sector’s development<br />
prospects, specific circumstances are particularly responsible<br />
for the sharp market contraction recorded in 2010, in the flagging<br />
the German and Spanish markets (see below). Austria Solar<br />
is expecting the Austrian market to contract by around 20%, which<br />
tallies with an overall drop in heating appliance sales (all energy<br />
sources). First official estimates will not be available until the end<br />
of May.<br />
The situation is not so critical elsewhere in Europe. While some of<br />
the other major EU markets such as France, Portugal and Belgium<br />
are suffering, the damage is much more limited. Having gone<br />
through a very hard patch, these markets appear to be heading<br />
for stabilisation which should presage their recovery. The same<br />
view could be made for the Greek and Polish markets which<br />
weathered the recession and grew very slightly between 2009 and<br />
2010. The Italian and Czech markets need to be treated with circumspection<br />
because their 2010 results mask the suspension of<br />
their incentive systems that were deemed to be too costly (see<br />
below). It is reasonable to expect a return to strong solar thermal<br />
Capteurs plans vitrés intégrés<br />
en toiture en Allemagne.<br />
Roof integrated flat plate collectors<br />
on house in Germany.<br />
a 3.8 million m 2 market in 2010<br />
The solar thermal market for hot water production and space<br />
heating shrank further in 2010 as expected. According to EurObserv’ER,<br />
approximately 3 754 000 m 2 (equal to 2 627.6 MWth of thermal<br />
capacity) was installed during 2010 (tables 3 and 4), which is<br />
10% less than in 2009 and 18.6% less than in 2008 (graph 3). Flat<br />
glazed collector technology continued to dominate the market,<br />
accounting for an 86.5% market share followed by vacuum tube<br />
collector technology with 9.3% and unglazed collectors with 4.2%<br />
(graph 4). The last segment is not so closely monitored, so the real<br />
deployment may well be understated. This is compounded by the<br />
fact that records generally do not include absorbers imported<br />
directly from China.<br />
The recession is largely to blame for the current weakness of the<br />
solar thermal market as it continues to weigh heavily on householders’<br />
and companies’ investment capacities. The construction<br />
industry slowdown is another factor, particularly in those countries,<br />
such as Spain and more recently Greece, where the installation<br />
of solar thermal systems is legally binding. Solar thermal technology<br />
is also challenged by photovoltaic systems. In the<br />
3. The Mediterranean Solar Plan is one of the EU’s major projects for the Mediterranean.<br />
The institution was established by the European Union and Mediterranean<br />
Heads of State on 13 July 2008 and aims to inaugurate an area of peace,<br />
democracy, cooperation and prosperity throughout its member countries.<br />
Velux<br />
SYSTÈMES <strong>SOLAIRE</strong>S le journal des énergies renouvelables N° 197 – 2010<br />
SOLAR THERMAL BAROM<strong>ET</strong>ER – EUROBSERV’ER – MAY 2010
76<br />
solar thermal and concentrated solar power barometer<br />
Tabl. n°3<br />
Surfaces solaires thermiques annuelles installées en 2009 par type de capteurs (en m 2 ) et puissances correspondantes (en MWth)<br />
Annual installed solar thermal surfaces in 2009 per collector type (in m 2 ) and power equivalence (in MWth)<br />
Capteurs vitrés/Glazed collectors<br />
Capteurs plans vitrés<br />
Flat plate collectors<br />
Capteurs sous vide<br />
Vacuum collectors<br />
Capteurs non vitrés<br />
Unglazed collectors<br />
Total<br />
(m 2 )<br />
Puissance<br />
équivalente (MWth)<br />
Equivalent<br />
power (MWth)<br />
Germany 1 440 000 160 000 19 800 1 619 800 1 133,9<br />
Spain 375 000 16 000 11 000 402 000 281,4<br />
Italy 340 000 60 000 400 000 280,0<br />
Austria 349 000 7 700 8 300 365 000 255,5<br />
France* 284 456 26 500 6 000 316 956 221,9<br />
Greece 204 000 2 000 206 000 144,2<br />
Portugal 173 279 721 393 174 392 122,1<br />
Poland 106 494 37 814 144 308 101,0<br />
Czech Republic 30 000 10 000 50 000 90 000 63,0<br />
Netherlands 43 713 27 000 70 713 49,5<br />
United Kingdom 48 717 16 788 65 505 45,9<br />
Denmark 53 683 817 54 500 38,2<br />
Belgium 45 500 5 200 50 700 35,5<br />
Sweden 13 126 8 183 24 993 46 302 32,4<br />
Ireland 26 383 16 131 42 514 29,8<br />
Cyprus 31 973 2 736 254 34 963 24,5<br />
Slovenia 16 920 6 970 23 890 16,7<br />
Romania 20 000 20 000 14,0<br />
Slovakia 10 700 1 900 12 600 8,8<br />
Hungary 10 000 10 000 7,0<br />
Malta 4 386 4 122 8 508 6,0<br />
Bulgaria 5 000 5 000 3,5<br />
Luxembourg 3 352 3 352 2,3<br />
Finland 2 000 1 000 3 000 2,1<br />
Latvia 1 500 1 500 1,1<br />
Lithuania 700 700 0,5<br />
Estonia 350 350 0,2<br />
Total EU 27 3 640 232 383 582 148 740 4 172 553 2 920,8<br />
* Départements d’outre-mer inclus. Overseas departments included.<br />
Les décimales sont séparées par une virgule. Decimals are written with a comma. Source : EurObserv’ER 2011.<br />
de développement considérables. En France,<br />
la faible disponibilité du foncier et les conditions<br />
d’ensoleillement bien souvent insuffisantes<br />
limitent la capacité susceptible<br />
d’être installée. Le gouvernement s’est fixé<br />
comme objectif, dans le cadre de son plan<br />
d’action national énergies renouvelables,<br />
une puissance de 540 MW d’ici à 2020. Il est<br />
possible que d’ici là des accords de partenariat<br />
se fassent avec certains pays du<br />
Maghreb pour la construction de centrales<br />
reliées au réseau européen via l’Espagne.<br />
Plusieurs prototypes et démonstrateurs<br />
devraient voir le jour dans les prochaines<br />
années. Actuellement, le groupe CNIM a installé<br />
un prototype de 1 MW utilisant les<br />
miroirs de Fresnel à La Seyne-sur-Mer et<br />
envisage de construire un démonstrateur<br />
dans les Pyrénées-Orientales. La société<br />
Solar Euromed compte également mettre<br />
en place un prototype dans les Pyrénées,<br />
puis installer deux démonstrateurs industriels,<br />
baptisés Alba Nova 1 et 2, en Corse.<br />
Elle a également annoncé avoir déjà conclu<br />
un contrat-cadre avec le Soudan pour l’installation<br />
de 2 000 MW au Darfour. L’industriel<br />
français le mieux positionné semble<br />
être Areva Solar, filiale solaire du groupe<br />
SYSTÈMES <strong>SOLAIRE</strong>S le journal des énergies renouvelables N° 203 – 2011<br />
BAROMÈTRE <strong>SOLAIRE</strong> <strong>THERMIQUE</strong> <strong>ET</strong> HÉLIOTHERMODYNAMIQUE – EUROBSERV’ER – MAI 2011
77<br />
Tabl. n°4<br />
Surfaces solaires thermiques annuelles installées en 2010 par type de capteurs (en m 2 ) et puissances correspondantes (en MWth)*<br />
Annual installed solar thermal surfaces in 2010 per collector type (in m 2 ) and power equivalence (in MWth)*<br />
Capteurs vitrés/Glazed collectors<br />
Capteurs plans vitrés<br />
Flat plate collectors<br />
Capteurs sous vide<br />
Vacuum collectors<br />
Capteurs non vitrés<br />
Unglazed collectors<br />
Total<br />
(m 2 )<br />
Puissance<br />
équivalente (MWth)<br />
Equivalent power<br />
(MWth)<br />
Germany 1 035 000 115 000 20 000 1 170 000 819,0<br />
Italy 426 300 63 700 490 000 343,0<br />
Spain 315 500 21 500 11 000 348 000 243,6<br />
France** 271 380 30 000 6 000 307 380 215,2<br />
Austria 279 200 6 160 6 640 292 000 204,4<br />
Greece 207 000 207 000 144,9<br />
Portugal 182 018 252 5 374 187 645 131,4<br />
Czech Republic 70 000 16 000 70 000 156 000 109,2<br />
Poland 110 480 35 426 145 906 102,1<br />
United Kingdom 69 640 18 621 88 262 61,8<br />
Denmark 64 100 64 100 44,9<br />
Netherlands 41 000 20 000 61 000 42,7<br />
Belgium 35 000 7 500 42 500 29,8<br />
Sweden 14 000 7 000 17 000 38 000 26,6<br />
Cyprus 28 931 1 782 109 30 822 21,6<br />
Romania 30 000 30 000 21,0<br />
Ireland 16 771 12 809 29 580 20,7<br />
Hungary 10 000 6 000 1 000 17 000 11,9<br />
Slovakia 13 050 1 950 100 15 100 10,6<br />
Malta 4 300 4 100 8 400 5,9<br />
Bulgaria 8 000 8 000 5,6<br />
Slovenia 5 585 1 815 7 400 5,2<br />
Finland 4 000 4 000 2,8<br />
Luxembourg 3 000 3 000 2,1<br />
Latvia 1 500 1 500 1,1<br />
Lithuania 700 700 0,5<br />
Estonia 350 350 0,2<br />
Total EU 27 3 246 806 349 615 157 223 3 753 644 2 627,6<br />
baromètre solaire thermique et héliothermodynamique<br />
* Estimation. Estimate ** Départements d’outre-mer inclus. Overseas departments included.<br />
Les décimales sont séparées par une virgule. Decimals are written with a comma. Source : EurObserv’ER 2011.<br />
market growth in the European Union from this year onwards,<br />
particularly in the light of a new amendment to the German subsidy<br />
policy.<br />
Help with making up for lost time in Germany<br />
The number of new solar thermal installations in Germany<br />
dropped sharply in 2010. ZSW (Zentrum für Sonnenenergie und<br />
Wasserstoff-Forshung Baden-Württemberg) claims that only<br />
1 170 000 m 2 of solar thermal collectors (the equivalent of 819 MW<br />
of thermal capacity) were installed in 2010, compared to just below<br />
1 620 000 in 2009, which is a 27.8% drop. Nonetheless, once decommissioned<br />
installations are subtracted, this additional surface<br />
area takes the German installed collector base past the 14 million<br />
m 2 mark (9 830.8 MWth), which was enough to produce 447 ktoe<br />
(407 ktoe in 2009), or 0.4% of the country’s energy consumption.<br />
According to the sector’s experts, the German Federal government’s<br />
“stop-go” attitude to its renewable energy Market Incentive<br />
Program (“Marktanreizprogramm” – MAP), which is responsible<br />
SYSTÈMES <strong>SOLAIRE</strong>S le journal des énergies renouvelables N° 203 – 2011<br />
SOLAR THERMAL AND CONCENTRATED SOLAR POWER BAROM<strong>ET</strong>ER – EUROBSERV’ER – MAY 2011
78<br />
solar thermal and concentrated solar power barometer<br />
Graph. n°3<br />
Évolution annuelle des surfaces de capteurs solaires thermiques installées dans l’Union européenne depuis 1994 (en m 2 )<br />
Annual installed surface of solar thermal collectors in the European Union since 1994 (in m 2 )<br />
664 209<br />
725 815<br />
849 538<br />
944 277<br />
981 776<br />
1 007 039<br />
1 271 591<br />
1 596 792<br />
1 199 069<br />
1 461 040<br />
1 731 104 2 142 220<br />
3 125 302<br />
1994 1995 1996 1997 1998 1999 2000 2001 2002 2003 2004 2005 2006 2007 2008 2009 2010*<br />
* Estimation. Estimate. Pays membres inclus à la date de leur adhésion. Members states included at the date of their accession. Source : EurObserv’ER 2011.<br />
3 054 867<br />
4 609 764<br />
4 172 553<br />
3 753 644<br />
nucléaire. La société propose des solutions<br />
clés en main, utilisant la technologie des<br />
centrales de type Fresnel. Une centrale de<br />
5 MW (Kimberlina) a été installée en Californie,<br />
la première depuis 20 ans, et la première<br />
utilisant cette technologie sur le sol<br />
américain. En avril 2011, le groupe a également<br />
annoncé avoir remporté un contrat<br />
pour la construction d’une centrale thermodynamique<br />
de type Fresnel de 44 MW,<br />
qui sera couplée à la centrale charbon de<br />
Kogan Creek en Australie (750 MW). Le projet<br />
débutera avant la fin du premier<br />
semestre 2011 pour une exploitation commerciale<br />
attendue en 2013. Son coût est<br />
estimé à 104,7 millions de dollars australiens,<br />
soit 77 millions d’euros.<br />
L’Italie est également impliquée dans la<br />
filière héliothermodynamique. Enel a mis<br />
en service en juillet 2010 une centrale de<br />
type cylindro-parabolique de 5 MW près de<br />
la ville italienne de Priolo Gargallo, en Sicile.<br />
Ce projet, baptisé Archimède, utilise les<br />
sels fondus comme fluide caloporteur et<br />
comme moyen de stockage de l’énergie.<br />
ANEST, l’association italienne des centrales<br />
solaires thermodynamiques, estime réalisable<br />
la construction d’entre 3 000 et 5 000<br />
MW d’ici à 2020. Dans le cadre de son plan<br />
d’action national sur les énergies renouvelables,<br />
le gouvernement n’a pour l’instant<br />
prévu qu’une puissance de 600 MW à cette<br />
même échéance.<br />
une filière prometteuse<br />
La filière héliothermodynamique est pleine<br />
d’avenir. La longue gestation des premiers<br />
projets installés aux États-Unis dans<br />
les années 1980 a permis, plus de 25 ans<br />
plus tard, de disposer de technologies suffisamment<br />
matures sur le plan des coûts de<br />
production pour démarrer un développement<br />
industriel et commercial à grande<br />
échelle dans plusieurs régions du monde :<br />
Europe, Amérique du Nord, Afrique du<br />
Nord, Moyen-Orient, Asie et Océanie.<br />
La production de ces centrales présente un<br />
certain nombre d’avantages. Elle est prévisible<br />
et peut être disponible même la nuit<br />
lorsque ces dernières sont équipées d’un<br />
système de stockage. Les centrales héliothermodynamiques<br />
peuvent également<br />
être couplées à des centrales thermiques<br />
fonc tionnant à la biomasse, au charbon ou<br />
au gaz. Ces deux configurations leur permettent<br />
de participer à la stabilisation du<br />
réseau et de favoriser l’incorporation sur<br />
celui-ci d’autres sources énergies renouvelables<br />
intermittentes comme le photovoltaïque<br />
ou l’éolien. Les coûts, qui ont déjà<br />
fortement diminué, continueront leur baisse<br />
grâce aux innovations dans les équipements<br />
et composants, à l’accroissement de<br />
l’efficacité éner gétique, à l’extension du<br />
nombre d’heures de fonctionnement due à<br />
l’aug men tation de la capacité de stockage,<br />
à la courbe d’apprentissage et aux économies<br />
d’échelle.<br />
Six pays de l’Union européenne ont annoncé<br />
des objectifs d’installation dans leur<br />
plan d’action national énergies renouvelables<br />
pour une puissance de 7 044 MW en<br />
SYSTÈMES <strong>SOLAIRE</strong>S le journal des énergies renouvelables N° 203 – 2011<br />
BAROMÈTRE <strong>SOLAIRE</strong> <strong>THERMIQUE</strong> <strong>ET</strong> HÉLIOTHERMODYNAMIQUE – EUROBSERV’ER – MAI 2011
79baromètre solaire thermique et héliothermodynamique<br />
Graph. n°4<br />
Répartition par technologie du marché solaire thermique<br />
de l’Union européenne en 2010<br />
Breakdown by technology of the European Union solar<br />
thermal market in 2010<br />
9,3 %<br />
Capteurs sous vide<br />
Vacuum collectors<br />
Source : EurObserv’ER 2011.<br />
4,2 %<br />
Capteurs non vitrés<br />
Unglazed collectors<br />
86,5 %<br />
Capteurs plans vitrés<br />
Flat plate collectors<br />
for supporting solar thermal, heat pump and biomass-fuelled<br />
heating systems, is clearly to blame for this drop. The government<br />
decided to freeze the 115 million Euros of funds allocated to this<br />
programme from May 2010 onwards for budgetary considerations.<br />
Although the funds were released three months later, the installation<br />
shortfall over the summer period could not be made up over<br />
the remaining months. Only 235 million Euros of the 291 million<br />
Euros total allocated to this budget was used. The number of<br />
financed systems (all technologies taken together) dropped even<br />
faster with 145 742 subsidised applications in 2010, down from<br />
253 000 in 2009. It would appear that financial support tended to<br />
be diverted to more expensive heating systems, such as combined<br />
solar systems, biomass boilers and heat pumps.<br />
The Environment Minister announced a temporary upgrade from<br />
15 March 2011, to the end of the year, having lowered the MAP<br />
incentive level in 2010. One of the flagship elements of this new<br />
legislation is the premium for combined systems which has been<br />
provisionally increased from 90 to 120 Euros per m 2 and the “combi-bonus”,<br />
paid when a heat pump or boiler system is coupled to<br />
a solar thermal system, which is for the time being increased from<br />
500 to 600 Euros. The German solar industry association is more<br />
optimistic about 2011 and expects the market to recover because<br />
of the oil barrel price which rose over the $100 per barrel mark at<br />
the end of 2010, coinciding with a new high demand for replacement<br />
boilers. Let it be said that 2010 was a particularly harsh year<br />
for the German solar thermal industry, which shed 2 800 jobs (from<br />
13 900 in 2009 to 11 100 in 2010) and saw its sales slashed by a third<br />
(1.5 billion Euros in 2009 down to 1 billion in 2010).<br />
Tax reduction system prolonged in Italy<br />
The Italian market foiled the expert forecasts and finally grew,<br />
while it was expected to contract slightly in 2010. According to<br />
Assoltherm, the Italian solar thermal association, about 490 000 m 2<br />
of collectors were installed in 2010, up on the 400 000 m 2 installed<br />
figure for 2009, amounting to a 22.5% increase. Clearly this growth<br />
can be attributed to the Italian government’s announcement that<br />
it would curtail the 55% tax reduction measure for residential solar<br />
thermal systems from 2011 onwards. As a result of this announcement,<br />
some private individuals brought forward their investment<br />
decisions. At the beginning of December 2010, the government<br />
agreed to extend the tax reduction measure at the same rate for<br />
an additional twelve months under pressure from the Italian solar<br />
thermal industry. However this extension is only a half-baked victory<br />
for the sector’s promotion associations because from now on,<br />
the tax reduction has to be spread over a 10-year period as opposed<br />
to the previous 5-year period, which drastically reduces the annual<br />
benefit. According to Assoltherm, the measure resul ted in the<br />
creation of another hundred jobs in 2010 bringing the total to 4 900.<br />
The Italian industry’s sales turnover is put at 490 million Euros (480<br />
million Euros in 2009). It remains to be seen what provisions will be<br />
taken subsequently to sustain market development and maintain<br />
these new jobs.<br />
The Spanish industry clamouring for<br />
a thermal kWh purchase tariff<br />
Once again the market stagnated in 2010. According to the Spanish<br />
solar thermal association (ASIT), 348 000 m 2 of collectors were<br />
installed in 2010 (glazed flat collectors: 315 500 m 2 ; vacuum tube<br />
collectors: 21 500 m 2 ; and unglazed collectors: 11 000 m 2 ) as against<br />
402 000 m 2 in 2009 (glazed flat collectors: 375 000 m 2 ; vacuum tube<br />
collectors: 16 000 m 2 ; and unglazed collectors: 11 000 m 2 ). This is<br />
less than half the annual volume provided for in the country’s<br />
2005-2010 Renewable Energy Plan.<br />
Spain monitors the distribution of its installations by application,<br />
and is one of the few countries to do so. The single family unit<br />
dwellings segment accounted for 76.3% of annual installed capa -<br />
c ity, the multi-occupancy/public building segment 20.6%, and the<br />
pool heating segment 3.1%, however these distribution figures<br />
change when the installed collector base to date is considered.<br />
The Spanish market is the only one in the EU to be dominated by<br />
large multi-occupancy/purpose building systems. ASIT claims that<br />
multi-occupancy/public buildings account for 55.5% of the total<br />
(including 2.9% of unglazed collectors for heating pools) as against<br />
44.5% for single family unit systems. Looking at the overall 2010<br />
market figures, 83% of the capacity was installed under the terms<br />
of the Spanish Building Technical code (CTE), that obliges all new<br />
construction or renovation project developers to cover 30-70% of<br />
their domestic hot water needs using a solar thermal system. The<br />
autonomous community programme subsidized 15% of the<br />
installed capacity, and the remainder is accounted for by industrial<br />
and other applications.<br />
ASIT considers that the situation gives rise for even more concern<br />
in 2011 because of the property market slump that is devastating<br />
the Spanish construction industry. The number of new starts built<br />
under the CTE code predicted for 2011 is only about 150 000 which<br />
is a far cry from its 2008 level of 560 000.<br />
The Ministry of Industry will shortly publish (in June or July 2011)<br />
the new 2011-2020 Renewable Energy Plan, which could include<br />
the ASIT proposal to create a thermal kWh purchase price for<br />
large-surface solar thermal plants designed to sell heat commer-<br />
SYSTÈMES <strong>SOLAIRE</strong>S le journal des énergies renouvelables N° 203 – 2011<br />
SOLAR THERMAL AND CONCENTRATED SOLAR POWER BAROM<strong>ET</strong>ER – EUROBSERV’ER – MAY 2011
80<br />
solar thermal and concentrated solar power barometer<br />
2020, avec un palier de 3 573 MW en 2015.<br />
S’ajoutent aux visées de l’Espagne, de la<br />
France et de l’Italie déjà citées, 500 MW au<br />
Portugal, 250 MW en Grèce et 75 MW à<br />
Chypre. La production d’électricité de ces<br />
centrales est estimée à près de 20 TWh<br />
contre un peu plus de 9 TWh en 2015. La progression<br />
de la filière est en phase avec les<br />
objectifs fixés dans le cadre des NREAP, et<br />
il semble aujourd’hui raisonnable de penser<br />
que les objectifs politiques du développement<br />
de la filière sont respectés<br />
(graphique 2).<br />
L’Association européenne de l’électricité<br />
solaire thermodynamique à concentration<br />
(Estela) estime que le rythme de progression<br />
pourrait être beaucoup plus rapide avec une<br />
puissance installée de 30 000 MW d’ici à 2020<br />
(équivalent à une production annuelle de<br />
89,8 TWh) et une puissance installée de<br />
60 000 MW d’ici à 2030 (équivalent à une production<br />
de 195 TWh). Cette expansion serait<br />
facilitée par la mise en place d’un superréseau<br />
reliant les différents pays européens.<br />
Elle le serait encore plus si l’Union faisait le<br />
choix d’interconnecter les réseaux européens<br />
avec ceux de l’Afrique du Nord. En<br />
effet, les perspectives de développement de<br />
la filière héliothermodynamique dans les<br />
pays sud- méditerranéens et chez leurs voisins<br />
sont beaucoup plus importantes qu’en<br />
Europe. Un essor rapide de ces technologies<br />
en Afrique du Nord permettrait de diminuer<br />
encore plus vite les coûts de production. La<br />
mise en place du Plan solaire méditerranéen 3 ,<br />
basé essentiellement sur l’électricité héliothermodynamique,<br />
est une clé de ce développement.<br />
Ce plan pourrait également<br />
contribuer à l’atteinte des objectifs énergies<br />
renouvelables fixés par l’Union pour<br />
2020. L’article 9 de la Directive 2009/28/CE<br />
autorise en effet les États mem bres à importer<br />
de l’énergie en provenance des pays tiers.<br />
L’Europe a une belle carte à jouer sur le plan<br />
politique et économique. Si elle choisit l’ouverture,<br />
l’énergie solaire pourra davantage<br />
contribuer à la sécurité de ses approvisionnements<br />
en énergie, tout en accélérant<br />
le développement économique et la mise<br />
en place des infrastructures électriques des<br />
pays de la Méditerranée. Les enjeux industriels<br />
en termes de création de richesse et<br />
d’emplois sont majeurs, dans un secteur où<br />
les acteurs asiatiques ne sont pas encore<br />
présents. Des décisions qui ne pourront<br />
être que politiques, car ce choix nécessitera<br />
des investissements très importants en ce<br />
qui concerne les infrastructures réseaux.<br />
Ces inves tissements sont un gage de sécurité<br />
sur le plan des approvisionnements,<br />
mais ils auront nécessairement un impact<br />
sur la facture d’électricité. Une coopération<br />
qui représenterait également un gage de<br />
sécurité dans les pays nord-africains, où<br />
l’augmentation du prix des hydrocarbures<br />
pourrait être facteur d’instabilité politique,<br />
à quelques encablures du continent<br />
européen.<br />
valorisation thermique :<br />
les capteurs solaires<br />
thermiques vitrés et non<br />
vitrés<br />
un marché de 3,8 millions<br />
de m 2 en 2010<br />
Comme attendu, le marché solaire thermique<br />
dédié à la production d’eau chaude<br />
sanitaire et au chauffage des bâtiments a<br />
marqué en 2010 une nouvelle baisse.<br />
Selon EurObserv’ER, une surface de près<br />
de 3 754 000 m 2 (équivalant à une puissance<br />
thermique de 2 627,6 MWth) a été installée<br />
durant l’année 2010 (tableaux 3 et 4),<br />
c’est 10 % de moins qu’en 2009 et 18,6 % de<br />
moins qu’en 2008 (graphique 3). La technologie<br />
des capteurs plans vitrés est restée<br />
dominante. Elle représente encore 86,5 %<br />
de part de marché contre 9,3 % pour la technologie<br />
des capteurs à tubes sous vide<br />
et 4,2 % pour les capteurs non vitrés (graphique<br />
4). Ce dernier segment de marché<br />
est très certainement sous-estimé car beaucoup<br />
moins suivi. De plus, il ne prend généralement<br />
pas en compte les absorbeurs<br />
directement importés de Chine.<br />
La faiblesse actuelle du marché solaire<br />
thermique peut, dans une large mesure,<br />
être imputée à la crise économique, qui<br />
continue d’affecter les capacités d’investissement<br />
des ménages et des entreprises.<br />
Elle s’explique également par le ralentissement<br />
de l’activité dans le secteur de la<br />
construction, en particulier dans les pays<br />
où l’installation des systèmes solaires thermiques<br />
est une obligation, comme en<br />
3. Le Plan solaire méditerranéen constitue un des grands projets de l’Union pour la Méditerranée, institution<br />
mise en place le 13 juillet 2008 par les chefs d’État de l’Union européenne et de la Méditerranée. Cette Union<br />
vise l’instauration d’une zone de paix, de démocratie, de coopération et de prospérité entre les pays membres.<br />
Espagne et aujourd’hui en Grèce. La technologie<br />
solaire thermique doit aussi faire<br />
face à la concurrence des systèmes photovoltaïques.<br />
Sur le marché des maisons individuelles<br />
et des bâtiments collectifs, il n’est<br />
pas toujours possible, faute de place, d’installer<br />
ces deux types de capteurs, et le<br />
choix de la production d’électricité, jugé<br />
plus rémunérateur, est souvent privilégié.<br />
Si ces trois facteurs limitent les perspectives<br />
de développement de la filière solaire<br />
thermique, la baisse sensible du marché<br />
enregistrée en 2010 s’explique davantage<br />
par des situations particulières, et surtout<br />
par un affaiblissement notable des marchés<br />
allemand et espagnol (voir plus loin).<br />
Selon Austria Solar, une diminution de<br />
l’ordre de 20 % est également attendue sur<br />
le marché autrichien, en relation avec une<br />
baisse généralisée des ventes d’appareils<br />
de chauffage (toutes énergies). Les premières<br />
estimations officielles ne seront pas<br />
disponibles avant la fin du mois de mai.<br />
Ailleurs en Europe, la situation est moins<br />
tendue. On observe certes quelques autres<br />
baisses sur des marchés importants de l’UE,<br />
comme en France, au Portugal ou en Belgique,<br />
mais elles sont beaucoup plus contenues.<br />
Ces marchés, après avoir été durement<br />
touchés, semblent entrer dans une<br />
phase de stabilisation, prélude à une sortie<br />
de crise. On peut faire la même analyse<br />
pour les marchés grec et polonais, qui ont<br />
su résister à la crise, augmentant très légèrement<br />
entre 2009 et 2010. La situation des<br />
marchés italien et tchèque est plus nuancée<br />
car les bonnes performances enregistrées<br />
en 2010 cachent une remise en cause<br />
des systèmes d’incitations jugés trop coûteux<br />
(voir plus loin). Un retour à une croissance<br />
solide du marché solaire thermique<br />
de l’Union européenne peut raisonnablement<br />
être attendu dès cette année, aidé en<br />
cela par une nouvelle adaptation de la politique<br />
allemande de subvention.<br />
Coup de pouce de rattrapage<br />
en Allemagne<br />
En Allemagne, le niveau des installations<br />
solaires thermiques a diminué significativement<br />
en 2010. Selon le ZSW (Zentrum für<br />
Sonnenenergie und Wasserstoff-Forshung<br />
Baden-Württemberg), seuls 1 170 000 m 2 de<br />
capteurs solaires thermiques (équivalant à<br />
une puissance thermique de 819 MW) ont<br />
été installés en 2010, comparés à un volume<br />
SYSTÈMES <strong>SOLAIRE</strong>S le journal des énergies renouvelables N° 203 – 2011<br />
BAROMÈTRE <strong>SOLAIRE</strong> <strong>THERMIQUE</strong> <strong>ET</strong> HÉLIOTHERMODYNAMIQUE – EUROBSERV’ER – MAI 2011
81<br />
Puissance solaire thermique installée dans l’Union européenne fin 2010* (en MWth)<br />
Solar thermal power capacity installed in the European Union at the end of 2010* (in MWth)<br />
N<br />
Portugal n° 8<br />
526,2<br />
131,4<br />
400 km<br />
Ireland<br />
105,8<br />
20,7<br />
United Kingdom<br />
373,7<br />
61,8<br />
France 1 n° 6<br />
1 470,0<br />
215,2<br />
260,5<br />
Belgium n° 15<br />
Luxembourg n° 24<br />
16,2<br />
2,1<br />
Netherlands n° 7<br />
557,2<br />
42,7<br />
Germany n° 1<br />
9 830,8<br />
819,0<br />
3 227,0<br />
204,4<br />
379,1<br />
44,9<br />
Czech Rep.<br />
115,7<br />
Slovenia n° 16<br />
n° 14<br />
311,5<br />
26,6<br />
n° 12<br />
471,3<br />
109,2<br />
Hungary<br />
Lithuania<br />
Poland n° 11<br />
459,0<br />
102,1<br />
83,7<br />
10,6<br />
70,9<br />
11,9<br />
Finland n° 23<br />
23,1<br />
2,8<br />
Estonia<br />
Latvia<br />
3,9<br />
0,5<br />
n° 19<br />
1,8<br />
0,2<br />
6,9<br />
1,1<br />
101,0<br />
21,0<br />
TOTAL EU<br />
25 135,6<br />
2 627,6<br />
baromètre solaire thermique et héliothermodynamique<br />
Spain n° 5<br />
1 542,5<br />
243,6<br />
Italy n° 4<br />
1 752,8<br />
343,0<br />
Bulgaria<br />
61,6<br />
5,6<br />
2 855,4<br />
144,9<br />
Malta n° 22<br />
37,3<br />
5,9<br />
490,7<br />
21,6<br />
Cyprus n° 9<br />
Légende/Key<br />
50 Parc solaire thermique installé à<br />
la fin de l’année 2010* (en MWth).<br />
Total solar thermal capacity<br />
installed to date at the end of<br />
2010* (in MWth).<br />
50 Puissance solaire thermique<br />
installée durant l’année 2010*<br />
(en MWth).<br />
Solar thermal capacity installed<br />
during the year 2010* (in MWth).<br />
* Estimation. Estimate.<br />
1. DOM inclus. French Overseas Departments included.<br />
Les décimales sont séparées par une virgule.<br />
Decimals are written with a comma.<br />
Source : EurObserv’ER 2011.<br />
SYSTÈMES <strong>SOLAIRE</strong>S le journal des énergies renouvelables N° 203 – 2011<br />
SOLAR THERMAL AND CONCENTRATED SOLAR POWER BAROM<strong>ET</strong>ER – EUROBSERV’ER – MAY 2011
82<br />
solar thermal and concentrated solar power barometer<br />
TiSUN GmbH.<br />
d’installation d’un peu moins de 1 620 000<br />
en 2009, soit une baisse de 27,8 %. Cette surface<br />
additionnelle permet toutefois au parc<br />
allemand de dépasser les 14 millions de m 2<br />
de capteurs installés (9 830,8 MWth), une<br />
fois déduites les installations mises hors<br />
service. Une surface d’installation qui a permis<br />
la production de 447 ktep (407 ktep en<br />
2009), soit 0,4 % de la consommation d’énergie<br />
du pays.<br />
Selon les experts de la filière, cette baisse<br />
est clairement imputable à la politique de<br />
“stop and go” du gouvernement fédéral<br />
concernant le Programme national de stimulation<br />
du marché des énergies renouvelables<br />
“Marktanreizprogramm” (MAP), en<br />
charge d’aider au financement des systèmes<br />
solaires thermiques, des pompes à<br />
chaleur et des systèmes de chauffage fonctionnant<br />
à la biomasse. Pour des raisons de<br />
restrictions budgétaires, le gouvernement<br />
avait décidé de geler le financement de 115<br />
millions d’euros alloués à ce programme à<br />
partir de mai 2010. Bien que les fonds aient<br />
été débloqués trois mois plus tard, le déficit<br />
d’installation durant la période estivale<br />
n’a pu être compensé durant le reste de<br />
l’année. Seuls 235 millions sur un total de<br />
291 millions alloués à ce budget ont pu être<br />
utilisés. Le nombre de systèmes financés<br />
(toutes technologies) a diminué encore<br />
plus rapidement avec 145 742 applications<br />
aidées en 2010, contre 253 000 en 2009. Ceci<br />
indique que les financements se sont<br />
davantage reportés vers les systèmes de<br />
chauffage plus onéreux, comme les systèmes<br />
solaires combinés, les chaudières<br />
biomasse et les pompes à chaleur.<br />
Après avoir diminué le niveau des subventions<br />
du MAP en 2010, le ministre de l’Environnement<br />
a annoncé une revalorisation<br />
temporaire à partir du 15 mars 2011, et ce<br />
jusqu’à la fin de l’année. Parmi les éléments<br />
phare de cette nouvelle législation, la prime<br />
pour les systèmes combinés augmente provisoirement<br />
de 90 à 120 €/ m 2 , et le “combibonus”,<br />
payé quand un système de pompe<br />
à chaleur ou de chaudière est associé à un<br />
système solaire thermique, est augmenté<br />
provisoirement de 500 à 600 euros. Pour<br />
cette année, l’Association de l’industrie<br />
allemande du solaire est plus optimiste.<br />
Elle s’attend à un retournement du marché<br />
dû à un prix du baril de pétrole qui est<br />
repassé au-delà des 100 dollars fin 2010,<br />
coïncidant avec un besoin élevé de renouvellement<br />
des chaudières. Il est vrai que<br />
2010 a été une année particulièrement difficile<br />
pour l’industrie solaire thermique allemande<br />
qui a perdu 2 800 emplois (de 13 900<br />
en 2009 à 11 100 en 2010) et a vu son chiffre<br />
d’affaires baisser d’un tiers (1,5 milliard d’euros<br />
en 2009 contre 1 milliard en 2010).<br />
Piscine alimentée par un système solaire<br />
thermique, en Espagne. Mise en service en 2010.<br />
Swimming pool heated by a solar thermal<br />
system in Spain, commissioned in 2010.<br />
Prolongation de la réduction<br />
fiscale en Italie<br />
Le marché italien a déjoué les pronostics<br />
des experts. Alors qu’on s’attendait à une<br />
légère diminution de ce dernier en 2010, il est<br />
finalement reparti à la hausse. Selon Assoltherm,<br />
l’Association italienne du solaire thermique,<br />
environ 490 000 m 2 ont été installés<br />
durant l’année 2010, contre 400 000 m 2 en<br />
2009, soit une croissance de 22,5 %. Cette<br />
croissance s’explique très certainement par<br />
l’annonce faite par le gouvernement de supprimer<br />
à partir de 2011 la réduction fiscale<br />
de 55 % pour les systèmes solaires thermiques<br />
résidentiels. Annonce qui a conduit<br />
certains particuliers à devancer leurs décisions<br />
d’investissement. Au début du mois<br />
de décembre 2010, sous la pression de l’industrie<br />
italienne du solaire thermique, le<br />
gouvernement a accepté de prolonger pour<br />
une année supplémentaire la réduction fiscale<br />
à un taux identique. Cet allongement<br />
est cependant une demi- victoire pour les<br />
associations de promotion de la filière car<br />
la réduction d’impôt est désormais obligatoirement<br />
déductible sur une période de 10<br />
ans, contre 5 ans auparavant. La réduction<br />
annuelle est donc beaucoup plus faible.<br />
Selon Assoltherm, une centaine d’emplois<br />
supplémentaires ont ainsi pu être créés en<br />
2010 pour un total de 4 900. Le chiffre d’affaires<br />
de l’industrie italienne est quant à lui<br />
estimé à 490 millions d’euros (480 millions<br />
d’euros en 2009). Se pose la question de ce<br />
qui sera mis en place par la suite pour soutenir<br />
le développement du marché et maintenir<br />
les emplois créés.<br />
L’industrie espagnole pour un tarif<br />
d’achat du kWh thermique<br />
Le marché espagnol a de nouveau marqué<br />
le pas en 2010 avec, selon l’Association<br />
espagnole du solaire thermique (ASIT),<br />
348 000 m 2 installés en 2010 (315 500 m 2 de<br />
capteurs plans vitrés, 21 500 m 2 de capteurs<br />
à tubes sous vide et 11 000 m 2 de capteurs<br />
non vitrés) contre 402 000 m 2 en 2009<br />
(375 000 m 2 de capteurs plans vitrés, 16 000<br />
m 2 de capteurs à tubes sous vide et 11 000<br />
m 2 de capteurs non vitrés). Ce niveau d’installation<br />
représente moins de la moitié du<br />
volume annuel prévu dans le cadre du Plan<br />
énergies renouvelables 2005-2010.<br />
L’Espagne fait partie des quelques pays qui<br />
SYSTÈMES <strong>SOLAIRE</strong>S le journal des énergies renouvelables N° 203 – 2011<br />
BAROMÈTRE <strong>SOLAIRE</strong> <strong>THERMIQUE</strong> <strong>ET</strong> HÉLIOTHERMODYNAMIQUE – EUROBSERV’ER – MAI 2011
60 %<br />
Le pourcentage de couverture obligatoire des besoins en eau chaude solaire<br />
thermique pour les nouveaux bâtiments en Grèce/The compulsory percentage<br />
of hot-water needs to be covered by solar thermal in new buildings in Greece<br />
83<br />
cially. The tariff would be paid to energy utilities which would be<br />
advised to build extremely high-efficient installations, using lea -<br />
ding-edge European technologies and providing high-quality<br />
maintenance to optimise production. Typical customers would be<br />
hospitals, hotels and industries. This purchase tariff could also be<br />
applied to other technologies, such as geothermal or biomass<br />
heat. The proposal has already been heralded as a possible plank<br />
of Spain’s NREAP (2009/28/CE Directive). If accepted, it would<br />
require endorsement by a Royal Decree which would delay<br />
enforcement until 2012. ASIT forecasts that the Spanish industry<br />
will suffer until then, having shed around a thousand jobs<br />
between 2009 and 2010, with sales estimated at 278 million Euros<br />
in 2010, down from 322 million Euros in 2009.<br />
The French residential market<br />
still finding its way<br />
In 2010, the French solar thermal market slipped yet again. Accor -<br />
ding to annual data published by Enerplan/Uniclima, France<br />
installed only 257 826 m 2 on the mainland (265 000 m 2 in 2009) and<br />
43 554 m 2 in the Overseas Territories (45 956 m 2 in 2009). In finer<br />
detail, the two associations counted 32 428 individual solar water<br />
heaters (36 000 in 2009), 2 303 combined hot water and heating systems<br />
(2 600 in 2009) and in the multi-occupancy sector 79 351 m 2<br />
(66 600 m 2 in 2009). Observ’ER adds a further 6 000 m 2 of unglazedcollectors<br />
for swimming pools, giving a total of 307 380 m 2 installed<br />
in 2010. It is this latter segment that is growing just as it did in 2009,<br />
which may be ascribed to the introduction of the renewable Heat<br />
Fund for multi-occupied buildings in 2009 and the increa singly<br />
determined strategy of the authorities to integrate solar thermal<br />
technologies in social housing projects.<br />
In contrast, the market’s weakness in the residential sector is alarming,<br />
particularly as France has one of Europe’s most generous incentive<br />
systems for its solar thermal sector. Private individuals can still<br />
claim a 45% tax credit in 2011 (it was 50% in 2010) which unlike in<br />
Italy is deductible (or paid back in the case of earnings below the<br />
tax threshold in a year, often piggy-backed with regional and local<br />
Exemple d’un système de chauffe-eau<br />
solaire individuel (Sud de la France).<br />
Example of a residential solar water<br />
heater system (South of France).<br />
community aid. This high incentive level has prompted a number<br />
of French regions – Aquitaine, Brittany, Burgundy, Languedoc-Roussillon<br />
and Provence-Alpes-Côte d’Azur to stop granting financial aid<br />
to householders in 2011 while a number of their local communities<br />
continue to grant aid towards installation costs.<br />
The recession, which marked 2010, the crisis in the building sector,<br />
and the higher profitability of PV systems are strong factors to back<br />
this reasoning. Furthermore, some installers are charging such high<br />
prices that they are curbing development and some experts consider<br />
that the aid system channelled by tax credit is to blame<br />
because it does not encourage installers to reduce their prices<br />
because the price invoiced for the equipment governs the amount<br />
granted.<br />
Even if it does not resolve the problem of prices, the slight reco very<br />
in the new build market, felt in the second half of 2010, could<br />
encourage the solar thermal market to pick up from this year<br />
onwards.<br />
Greece enforces its obligation<br />
Since January 2011, all new (or redeveloped) buildings in Greece<br />
must cover at least 60% of their hot water requirements using solar<br />
energy. This obligation derives from Law L3851/2010 that aims to<br />
transpose the European Renewable Energy Directive (2009/28/CE)<br />
and combines it with Law L3661/2008 that takes up the European<br />
building energy performance levels Directive. The Greek Solar Industry<br />
Association (EBHE) has welcomed this measure which should<br />
resurrect the market. In 2010, it was lacklustre, close to its 2009 level,<br />
having dropped 31% between 2008 and 2009. This new legislation<br />
should hand the sector new opportunities, because more than half<br />
of the new houses and buildings have gas or electric water heaters.<br />
The EBHE states that the new legislation will have limited effects<br />
initially because of the construction market decline. Other solutions<br />
will have to be devised to achieve the country’s ambitious NREAP,<br />
which aims to double solar thermal energy’s contribution by 2020.<br />
Clipsol<br />
baromètre solaire thermique et héliothermodynamique<br />
SYSTÈMES <strong>SOLAIRE</strong>S le journal des énergies renouvelables N° 203 – 2011<br />
SOLAR THERMAL AND CONCENTRATED SOLAR POWER BAROM<strong>ET</strong>ER – EUROBSERV’ER – MAY 2011
84<br />
solar thermal and concentrated solar power barometer<br />
suivent la répartition des installations en<br />
fonction des applications. Le segment du<br />
résidentiel a représenté 76,3 % de la puissance<br />
annuelle installée, celui du collectif<br />
20,6 %, et celui des piscines 3,1 %. La répartition<br />
est différente en tenant compte du<br />
parc. L’Espagne est le seul pays de l’Union<br />
où la part des systèmes collectifs est majoritaire.<br />
Selon l’ASIT, le collectif représentait<br />
55,5 % du total (dont 2,9 % de capteurs non<br />
vitrés dédiés aux piscines) contre 44,5 %<br />
pour les systèmes individuels.<br />
Concernant le marché 2010 uniquement,<br />
83 % de la puissance a été installée dans le<br />
cadre du code de la construction (CTE –<br />
Código Técnico de la Edificación), qui oblige<br />
toute nouvelle construction ou réhabilitation<br />
à couvrir entre 30 % et 70 % de la<br />
demande domestique en eau chaude sanitaire<br />
grâce à une installation solaire thermique.<br />
15 % ont été installés dans le cadre<br />
du programme d’aide aux communautés<br />
autonomes, et le reste correspond aux<br />
applications industrielles et autres. L’ASIT<br />
considère que la situation pour 2011 est<br />
encore plus préoccupante en raison de la<br />
grave crise du marché immobilier que traverse<br />
l’Espagne. Le nombre de logements<br />
neufs entrant dans le cadre du CTE ne<br />
devrait être que de l’ordre de 150 000 en<br />
TISUN GmbH.<br />
2011. Il était de 560 000 en 2008.<br />
Le ministère de l’Industrie devrait publier<br />
prochainement, en juin ou en juillet 2011,<br />
un nouveau Plan énergies renouvelables<br />
2011-2020. Ce plan pourrait inclure une proposition<br />
faite par l’ASIT de créer un tarif<br />
d’achat du kWh thermique pour les centrales<br />
solaires thermiques collectives destinées<br />
à la vente commerciale de la chaleur.<br />
Ce tarif serait payé à une compagnie de services<br />
énergétiques qui aurait tout intérêt à<br />
réaliser des installations collectives extrêmement<br />
performantes, utilisant des technologies<br />
de pointe “made in Europe” et<br />
assurant une maintenance de qualité afin<br />
d’optimiser sa production. Les clients types<br />
seraient des hôpitaux, des hôtels ou des<br />
industriels. Ce tarif d’achat pourrait également<br />
être valable pour d’autres technologies,<br />
comme la géothermie ou la biomasse.<br />
Cette proposition a déjà été énoncée comme<br />
un possible moyen d’action dans le<br />
cadre du Plan d’action national sur les énergies<br />
renouvelables (Directive 2009/28/CE).<br />
Si elle est acceptée, elle nécessitera la mise<br />
en place d’un Décret royal qui ne pourra<br />
pas entrer en vigueur avant 2012. D’ici là,<br />
l’industrie espagnole devrait continuer de<br />
souffrir. Selon l’ASIT, elle a déjà perdu un<br />
millier d’emplois entre 2009 et 2010, avec un<br />
Hôtel alimenté en eau chaude solaire<br />
thermique, en Grèce.<br />
Solar thermal hot water supplies<br />
this hotel in Greece.<br />
chiffre d’affaires du secteur évalué à 278<br />
millions d’euros en 2010, contre 322 millions<br />
d’euros en 2009.<br />
Le marché français<br />
du résidentiel se cherche encore<br />
Le marché français du solaire thermique<br />
est en 2010 de nouveau en baisse. Selon les<br />
données annuelles d’Enerplan/Uniclima, le<br />
pays n’a installé que 257 826 m 2 en métropole<br />
(265 000 m 2 en 2009) et 43 554 m 2 dans<br />
les DOM (45 956 m 2 en 2009). Plus précisément,<br />
les deux associations ont comptabilisé<br />
sur le marché métropolitain 32 428<br />
chauffe-eau solaires individuels (36 000 en<br />
2009), 2 303 systèmes combinés eau chaude<br />
plus chauffage (2 600 en 2009) et 79 351 m 2<br />
de systèmes collectifs (66 600 m 2 en 2009).<br />
Observ’ER a ajouté une estimation de 6 000<br />
m 2 de capteurs non-vitrés destinés aux piscines,<br />
soit un total de 307 380 m 2 installés<br />
en 2010. Tout comme en 2009, seul le segment<br />
regroupant les applications collectives<br />
est en augmentation. Cette dernière<br />
peut être mise en relation avec l’instauration<br />
en 2009 du fonds chaleur renouvelable<br />
pour les bâtiments collectifs et une volonté<br />
de plus en plus affirmée des bailleurs<br />
publics d’intégrer les technologies solaires<br />
thermiques dans le logement social.<br />
En revanche, la faiblesse du marché dans le<br />
secteur résidentiel pose question. Le pays<br />
dispose pourtant, en ce qui concerne la<br />
filière solaire thermique, d’un système d’incitation<br />
parmi les plus généreux d’Europe.<br />
Les particuliers peuvent encore cumuler un<br />
crédit d’impôt de 45 % en 2011 (il était de<br />
50 % en 2010) qui, contrairement à l’Italie,<br />
est déductible (ou remboursable pour les<br />
revenus non imposables) en une année, et<br />
souvent des aides régionales et des collectivités<br />
locales. Ce niveau élevé d’incitation<br />
a conduit certaines régions françaises<br />
à ne plus accorder d’aides financières<br />
aux particuliers. C’est le cas en 2011 des<br />
régions Aquitaine, Bretagne, Bourgogne,<br />
Languedoc-Roussillon et Provence-Alpes-<br />
Côte d’Azur. Certaines collectivités locales<br />
de ces régions continuent à octroyer des<br />
aides à l’installation.<br />
La crise économique, encore très présente<br />
en 2010, la crise du logement neuf et la plus<br />
forte rentabilité des systèmes photovoltaïques<br />
sont des éléments importants d’explication.<br />
Le niveau des prix pratiqués par<br />
une partie des professionnels est certaine-<br />
SYSTÈMES <strong>SOLAIRE</strong>S le journal des énergies renouvelables N° 203 – 2011<br />
BAROMÈTRE <strong>SOLAIRE</strong> <strong>THERMIQUE</strong> <strong>ET</strong> HÉLIOTHERMODYNAMIQUE – EUROBSERV’ER – MAI 2011
SOLID<br />
85baromètre solaire thermique<br />
Centrale solaire thermique d’une surface<br />
de 3 855,1 m 2 alimentant un réseau<br />
de chaleur en Autriche.<br />
An Austrian urban heating network<br />
fed by a 3 855.1-m 2 solar thermal plant.<br />
SYSTÈMES <strong>SOLAIRE</strong>S le journal des énergies renouvelables N° 197 – 2010<br />
SOLAR THERMAL BAROM<strong>ET</strong>ER – EUROBSERV’ER – MAY 2010
86<br />
solar thermal barometer<br />
ment un autre frein au développement.<br />
Certains experts mettent en cause le système<br />
d’aides via le crédit d’impôt car il ne<br />
pousserait pas les installateurs à diminuer<br />
leurs tarifs, le montant de l’incitation étant<br />
fonction du prix du matériel facturé.<br />
Même s’il ne résout pas le problème des<br />
prix, le regain annoncé du marché de la<br />
construction neuve (+ 14,5 % sur les trois<br />
premiers mois de l’année 2011 par rapport<br />
aux trois premiers mois de l’année 2010)<br />
pourrait favoriser une reprise prudente du<br />
marché solaire thermique dès cette année.<br />
L’obligation effective en Grèce<br />
Depuis janvier 2011, tous les nouveaux bâtiments<br />
(ou en réhabilitation) en Grèce doivent<br />
couvrir au moins 60 % de leur besoin en<br />
eau chaude grâce à l’énergie solaire. Cette<br />
obligation est issue de la loi L3851/2010 qui<br />
vise à retranscrire la Directive européenne<br />
sur les énergies renouvelables (2009/28/CE)<br />
en combinaison avec la loi L3661/2008 qui<br />
reprend la Directive européenne sur les performances<br />
énergétiques des bâtiments.<br />
L’association de l’industrie solaire thermique<br />
grecque (EBHE) a accueilli favorablement<br />
cette mesure qui devrait permettre de<br />
relancer le marché. En 2010, il est resté à<br />
un niveau bas, proche de celui de 2009,<br />
après avoir chuté de 31 % entre 2008 et<br />
2009. Cette nouvelle législation promet d’offrir<br />
des opportunités à la filière, car plus de<br />
la moitié des constructions neuves restent<br />
équipées de chauffe-eau à gaz ou électriques.<br />
L’EBHE précise que les effets de<br />
cette législation seront limités dans un premier<br />
temps, en relation avec le déclin du<br />
marché de la construction en Grèce. D’autres<br />
solutions devront être envisagées pour réaliser<br />
les objectifs ambitieux du Plan d’action<br />
national sur les énergies renouvelables, qui<br />
vise un doublement de la contribution de<br />
l’énergie solaire thermique d’ici à 2020.<br />
Indicateurs au vert en Pologne,<br />
au rouge en République tchèque<br />
Le marché solaire thermique polonais est<br />
resté stable en 2010 avec, selon EC BREC<br />
Institut for Renewable Energy LtD, 145 906<br />
m 2 installés en 2010 (70 % dans l’individuel<br />
et 30 % dans le collectif) contre 144 308 m 2<br />
en 2009.<br />
La mise en œuvre tardive, fin août 2010, du<br />
nouveau programme de subvention des<br />
chauffe-eau solaires individuels a limité le<br />
développement du marché. Ce système d’incitation<br />
combine une subvention, plafonnée<br />
à 625 euros par m 2 et à concurrence de<br />
45 % des coûts d’investissement, à un prêt<br />
à tarif préférentiel sur les 55 % restants.<br />
En République tchèque, la croissance soutenue<br />
du marché solaire thermique observée<br />
en 2010 (156 000 m 2 – dont 70 000 m 2 de<br />
capteurs non vitrés – comparés à 90 000 m 2<br />
en 2009 – dont 50 000 m 2 de capteurs non<br />
vitrés) ne devrait pas se reproduire en<br />
2011. Le gouvernement a en effet choisi de<br />
ne pas relancer son programme d’incitation<br />
“Zelená Úsporám”, comme prévu au<br />
début de février 2011. Cette décision a été<br />
prise devant l’importance du nombre de<br />
demandes reçues la dernière semaine<br />
avant l’arrêt du programme en octobre<br />
2010, soit un total de 10 425 demandes,<br />
alors que seules 3 100 d’entre elles avaient<br />
été présentées durant l’année 2009. Selon<br />
le ministère de l’Environnement, cette<br />
hausse des demandes était devenue incompatible<br />
avec les ressources techniques,<br />
administratives et financières allouées.<br />
un parc de près de<br />
36 millions de m 2<br />
La superficie totale des capteurs solaires<br />
thermiques est difficile à mesurer car elle<br />
doit nécessairement inclure un déclassement<br />
des équipements les plus anciens. Les<br />
hypothèses de déclassement formulées par<br />
EurObserv’ER sont de 20 ans pour les capteurs<br />
vitrés et de 12 ans pour les capteurs<br />
non vitrés. Dans le cas où les experts nationaux<br />
contactés utilisent une hypothèse de<br />
déclassement propre à leur pays ou lorsqu’il<br />
s’agit d’une estimation officielle, EurObserv’ER<br />
reprend ces estimations. Il convient<br />
de préciser que les données de parc relatives<br />
à la France ont été revues à la baisse<br />
par Observ’ER, en charge du suivi de la filière<br />
pour la France, à la suite d’une modification<br />
des hypothèses de déclassement.<br />
Selon ces hypothèses, la superficie des capteurs<br />
solaires thermiques en fonctionnement<br />
dans l’Union européenne est de<br />
l’ordre de 35,9 millions de m 2 , soit une puissance<br />
de 25,1 GWth (tableau 5). Les parcs<br />
les plus importants sont ceux de l’Allemagne,<br />
de l’Autriche et de la Grèce. Un indicateur<br />
de surface par habitant est plus<br />
représentatif de l’implication d’un pays<br />
dans la technologie solaire thermique car il<br />
supprime l’effet lié à la taille du pays.<br />
Chypre prend la tête de ce nouveau classement<br />
avec 0,873 m 2 par habitant, devançant<br />
l’Autriche (0,550 m 2 par habitant) et la Grèce<br />
(0,361 m 2 par habitant). Des pays comme<br />
l’Espagne, l’Italie et la France sont très en<br />
dessous de la moyenne européenne qui se<br />
situe en 2010 à 0,072 m 2 par habitant. Cet<br />
indicateur démontre que la marge de progression<br />
est encore très importante dans<br />
les autres pays de l’Union (tableau 6).<br />
l’industrie européenne<br />
se remet en question<br />
L’industrie européenne n’a pas été habituée<br />
à subir deux années de suite une telle<br />
baisse d’activité. Elle a dû faire face à une<br />
multitude de facteurs conjoncturels, énoncés<br />
précédemment, défavorables à son<br />
développement. Elle a également subi de<br />
plein fouet l’importante augmentation du<br />
prix du cuivre, fortement reparti à la hausse<br />
depuis le début de l’année 2009 (2,5 €/kg<br />
début 2009 à 7,5€/kg fin 2010). La diminution<br />
du prix de l’énergie fossile, relative par<br />
rapport au sommet atteint mi-2008 (près de<br />
150 dollars le baril), a également favorisé la<br />
vente des appareils de chauffage conventionnel,<br />
telles les chaudières à condensation<br />
non utilisées comme appoint mais<br />
comme mode de chauffage principal.<br />
La plupart des représentants et des analystes<br />
de la filière en conviennent, les<br />
acteurs doivent repenser le futur de l’industrie<br />
afin de repositionner le solaire thermique<br />
comme la meilleure alternative au<br />
chauffage conventionnel.<br />
Le salon Intersolar de Munich et celui de ISH<br />
de Francfort (dédié entre autres à la cons -<br />
truction, à l’énergie et au changement climatique)<br />
ont été l’occasion pour l’industrie<br />
européenne de montrer ses capacités d’innovation<br />
et d’adaptation à la demande. Ces<br />
salons ont confirmé certaines nouvelles<br />
tendances. De plus en plus de fabricants<br />
proposent des absorbeurs en aluminium,<br />
matériau moins cher que le cuivre. Bosch<br />
Thermotechnik a par exemple présenté lors<br />
du dernier salon ISH de Francfort sa nouvelle<br />
génération de capteurs plans équipés<br />
d’absorbeurs en aluminium. Le producteur<br />
norvégien d’aluminium Norsk Hydro ASA a<br />
annoncé en début d’année 2011 le nom de<br />
ses premiers clients lui ayant commandé<br />
des tubes aluminium pour la fabrication de<br />
capteurs. Il s’agit de l’Allemand Solarbayer<br />
GmbH et du Polonais Hewalex, qui de -<br />
vraient dans les prochains mois débuter<br />
une production commerciale.<br />
SYSTÈMES <strong>SOLAIRE</strong>S le journal des énergies renouvelables N° 197 – 2010<br />
BAROMÈTRE <strong>SOLAIRE</strong> <strong>THERMIQUE</strong> – EUROBSERV’ER – MAI 2010
87<br />
Tabl. n°5<br />
Parc cumulé* de capteurs solaires thermiques installés dans l’Union européenne en 2009 et en 2010** (en m 2 et en MWth)<br />
Total European Union solar thermal collector capacity* installed by the end of 2009 and 2010** (in m 2 and in MWth)<br />
2009 2010<br />
m 2 MWth m 2 MWth<br />
Germany 12 909 000 9 036,3 14 044 000 9 830,8<br />
Austria 4 330 000 3 031,0 4 610 000 3 227,0<br />
Greece 4 076 200 2 853,3 4 079 200 2 855,4<br />
Italy 2 014 875 1 410,4 2 503 949 1 752,8<br />
Spain 1 865 036 1 305,5 2 203 636 1 542,5<br />
France*** 1 839 025 1 287,3 2 100 000 1 470,0<br />
Netherlands 761 000 532,7 796 000 557,2<br />
Portugal 564 066 394,8 751 711 526,2<br />
Cyprus 700 715 490,5 700 937 490,7<br />
Czech Republic 517 252 362,1 673 252 471,3<br />
Poland 509 836 356,9 655 742 459,0<br />
Denmark 484 080 338,9 541 546 379,1<br />
United Kingdom 476 260 333,4 533 927 373,7<br />
Sweden 422 000 295,4 445 000 311,5<br />
Belgium 330 713 231,5 372 151 260,5<br />
Slovenia 157 902 110,5 165 302 115,7<br />
Ireland 121 672 85,2 151 152 105,8<br />
Romania 114 300 80,0 144 300 101,0<br />
Slovakia 104 520 73,2 119 620 83,7<br />
Hungary 84 264 59,0 101 264 70,9<br />
Bulgaria 80 000 56,0 88 000 61,6<br />
Malta 44 867 31,4 53 267 37,3<br />
Finland 29 000 20,3 33 000 23,1<br />
Luxembourg 20 161 14,1 23 161 16,2<br />
Latvia 8 350 5,8 9 850 6,9<br />
Lithuania 4 850 3,4 5 550 3,9<br />
Estonia 2 170 1,5 2 520 1,8<br />
Total EU 27 32 572 114 22 800,5 35 908 036 25 135,6<br />
baromètre solaire thermique et héliothermodynamique<br />
* Toutes technologies y compris le non vitré. All technologies including unglazed collectors. ** Estimation. Estimate. *** Départements d’outre-mer inclus.<br />
Overseas departments included. Les décimales sont séparées par une virgule. Decimals are written with a comma. Source : EurObserv’ER 2011.<br />
The lights turn to green in Poland and to red<br />
in the Czech Republic<br />
The Polish solar thermal market was stable in 2010 with 145 906 m 2<br />
installed in 2010 (70% in family houses and 30% in multi-occupancy<br />
buildings) as against 144 308 m 2 in 2009, according to the EC<br />
BREC Institute for Renewable Energy Ltd.<br />
The application of the new individual solar water heater incentive<br />
programme postponed to the end of August 2010, limited market<br />
development. The incentive system combines a grant, capped<br />
at 625 Euros per m 2 and up to 45% of the investment costs with a<br />
preferential rate loan on the remaining 55%.<br />
In the Czech Republic, the steady growth of the solar thermal market<br />
observed in 2010, (156 000 m 2 – including 70 000 m 2 of unglazed<br />
collectors – compared with 90 000 m 2 in 2009 – including 50 000 m 2<br />
of unglazed collectors) is unlikely to be repeated in 2011. This is<br />
because the government has decided not to re-launch its “Zelená<br />
úsporám” incentive programme as planned at the beginning of<br />
February 2011. It applied this moratorium on the grounds that a<br />
total of 10 425 applications were received during the final week<br />
before the programme ended in October 2010 – yet only 3 100 of<br />
them had been submitted during 2009. According to the Czech<br />
Environment Ministry, this rise in the number of applications out-<br />
SYSTÈMES <strong>SOLAIRE</strong>S le journal des énergies renouvelables N° 203 – 2011<br />
SOLAR THERMAL AND CONCENTRATED SOLAR POWER BAROM<strong>ET</strong>ER – EUROBSERV’ER – MAY 2011
88<br />
solar thermal and concentrated solar power barometer<br />
DTEC GmbH<br />
Machine à souder au laser capable<br />
de produire un absorbeur toutes<br />
les 72 secondes (usine Viessmann).<br />
Laser welding machine capable<br />
of producing one absorber every<br />
72 seconds (Viessmann plant).<br />
Un autre axe de développement est celui<br />
de l’automatisation des processus de production,<br />
synonyme de réduction des coûts<br />
pour la production à grande échelle. Des<br />
progrès importants ont été réalisés sur le<br />
plan des soudures, qu’elles soient faites au<br />
laser ou par ultrason. L’entreprise autrichienne<br />
GREENoneTEC a été pionnière dans<br />
ce domaine. En juillet 2010, celle-ci a mis en<br />
service une nouvelle ligne de production,<br />
capable de produire un capteur par minute,<br />
soit une production annuelle de 450 000<br />
capteurs. Le coût total de cet investissement<br />
est de l’ordre de 4 millions d’euros.<br />
L’industriel allemand Viessmann avait<br />
quelques mois auparavant (en avril 2010)<br />
mis en service une nouvelle machine à<br />
souder au laser capable de produire un<br />
absorbeur toutes les 72 secondes. L’automatisation<br />
concerne également d’autres<br />
opéra tions. En avril 2011, GREENoneTEC a<br />
installé une nouvelle machine entièrement<br />
automatisée permettant le pliage des<br />
tubes de l’absorbeur. Alors qu’un appareil<br />
conventionnel est capable d’effectuer 20 à<br />
30 opérations de pliage par heure, celui mis<br />
en place affiche une productivité de 90<br />
pliages par heure.<br />
Autre tendance, l’industrie européenne<br />
compte sur le développement actuel du<br />
marché des systèmes solaires thermiques<br />
de grandes tailles. Ce segment de marché<br />
dédié aux hôtels, aux bâtiments collectifs<br />
ou administratifs ne cesse de se développer<br />
sous l’impulsion des systèmes d’incitation<br />
mis en place par les pouvoirs publics. Selon<br />
une enquête menée pour le magazine Sun<br />
& Wind Energie, la part de marché des systèmes<br />
collectifs était sur le plan de la surface<br />
de capteurs installée de 27 % en 2009.<br />
Elle serait déjà de 34 % en 2010. On observe<br />
également une multiplication du nombre<br />
de systèmes de très grande dimension (plus<br />
de 500 m 2 ) alimentant directement un<br />
réseau de chaleur ou plusieurs bâtiments à<br />
l’aide de microréseaux. Ces systèmes se<br />
développent très rapidement dans les pays<br />
d’Europe du Nord mais également en<br />
Autriche. Le Danemark possède déjà une<br />
puissance solaire thermique de 62 MWth<br />
(88 600 m 2 ), à laquelle devrait s’ajouter une<br />
puissance de l’ordre de 170 MWth (242 900<br />
m 2 ). Dans ce pays, la société Nordic Clean<br />
Energy offre aux exploitants de réseaux de<br />
chaleur la possibilité d’acheter du kWh<br />
solaire thermique à un tarif fixe. Ce type<br />
d’installation tend également à se développer<br />
hors d’Europe, ouvrant de nouveaux<br />
marchés à l’industrie européenne. GREEN -<br />
oneTEC a notamment été choisie pour fournir<br />
les capteurs de la construction du plus<br />
grand système solaire thermique au monde<br />
qui équipera l’université de la princesse<br />
Noura Bint Abdul Rahman en Arabie Saoudite.<br />
Ce campus, dont la construction<br />
devrait être terminée fin 2011, aura la taille<br />
d’une petite ville. Il offrira des espaces pour<br />
40 000 étudiants, professeurs et autres<br />
membres du personnel et comportera 13<br />
facultés, des immeubles d’hébergement,<br />
des installations de recherche et un hôpital.<br />
Le système solaire thermique est conçu<br />
pour couvrir les besoins en eau chaude de<br />
l’ensemble des installations et les besoins<br />
en chauffage durant la période hivernale<br />
(de novembre à février). Ce sys tème dispo-<br />
SYSTÈMES <strong>SOLAIRE</strong>S le journal des énergies renouvelables N° 203 – 2011<br />
BAROMÈTRE <strong>SOLAIRE</strong> <strong>THERMIQUE</strong> <strong>ET</strong> HÉLIOTHERMODYNAMIQUE – EUROBSERV’ER – MAI 2011
89<br />
stretched the technical, administrative and financial resources it<br />
had allocated.<br />
the collector base to date almost 36 million m 2<br />
The total solar thermal collector surface area is hard to gauge<br />
because the decommissioning of the oldest equipment must neces -<br />
sarily be factored in. The decommissioning assumptions used by<br />
EurObserv’ER are 20 years for glazed collectors and 12 years for<br />
unglazed collectors. EurObserv’ER has taken up any country-specific<br />
decommissioning assumptions used by the national experts<br />
consulted or official estimates given.<br />
It should be noted that because of a change to the decommissioning<br />
assumptions, the French installed base data has been revised<br />
downwards by Observ’ER, which is responsible for monitoring the<br />
sector for France.<br />
Accordingly, the solar thermal collector surface in operation in the<br />
European Union is about 35.9 million m 2 , which gives a capa city of<br />
25.1 GWth (table 5). The biggest collector bases are to be found in<br />
Germany, Austria and Greece. A per capita surface indicator is more<br />
representative of a country’s commitment to solar thermal technology<br />
because it eliminates the distortion created by the country’s<br />
size. Cyprus thus takes the lead of this new ranking with 0.873 m 2<br />
per capita, ahead of Austria (0.550 m 2 per capita) and Greece (0.361<br />
m 2 per capita). Countries like Spain, Italy and France are a long way<br />
below the European average for 2010 at 0.072 m 2 per capita. This<br />
indicator demonstrates that there is considerable scope for<br />
progress in the other European Union countries (table 6).<br />
european industry goes introspective<br />
Tabl. n°6<br />
Parcs solaires thermiques* en service par habitant<br />
(m 2 /hab. et kWth/hab.) en 2010**<br />
Solar thermal capacities* in operation per capita<br />
(m 2 /inhab. and kWh/inhab.) in 2010**<br />
m 2 /hab.<br />
m 2 /inhab.<br />
kWth/hab.<br />
kWth/inhab.<br />
Cyprus 0,873 0,611<br />
Austria 0,550 0,385<br />
Greece 0,361 0,253<br />
Germany 0,172 0,120<br />
Malta 0,129 0,090<br />
Denmark 0,098 0,068<br />
Slovenia 0,081 0,057<br />
Portugal 0,071 0,049<br />
Czech Republic 0,064 0,045<br />
Netherlands 0,048 0,034<br />
Spain 0,048 0,034<br />
Sweden 0,048 0,033<br />
Luxembourg 0,046 0,032<br />
Italy 0,041 0,029<br />
Belgium 0,034 0,024<br />
Ireland 0,034 0,024<br />
France*** 0,032 0,023<br />
Slovakia 0,022 0,015<br />
Poland 0,017 0,012<br />
Bulgaria 0,012 0,008<br />
Hungary 0,010 0,007<br />
United Kingdom 0,009 0,006<br />
Romania 0,007 0,005<br />
Finland 0,006 0,004<br />
Latvia 0,004 0,003<br />
Estonia 0,002 0,001<br />
Lithuania 0,002 0,001<br />
Total EU 27 0,072 0,050<br />
* Toutes technologies y compris le non vitré. All technologies including<br />
unglazed collectors. ** Estimation. Estimate. *** Départements d’outre-mer<br />
inclus. Overseas departments included. Les décimales sont séparées par une<br />
virgule. Decimals are written with a comma. Source : EurObserv’ER 2011.<br />
European industry is unaccustomed to facing two consecutive<br />
years of bust and has had to cope with myriad cyclical factors that<br />
have thwarted its development. It has also had to tackle head-on<br />
the massive hike in copper prices, which have rocketed since the<br />
start of 2009 (€ 2.5/kg early in 2009 to € 7.5/kg at the end of 2010). The<br />
drop in the fossil energy price compared to its mid-2008 peak<br />
(almost $ 150 per barrel), also drove up sales of conventional hea -<br />
ting appliances such as condensation boilers used as the main heating<br />
source rather than for top-up purposes.<br />
Most of the sector’s representatives and analysts agree… the main<br />
players will have to rethink the industry’s future if they are to recast<br />
solar thermal as the best alternative to conventional heating.<br />
Munich’s Intersolar trade fair and Frankfurt’s ISH (which has one<br />
construction, energy and climate change section) provided European<br />
industry occasions to showcase its capacities for innovation<br />
and adaptation to demand. These trade fairs underscored a number<br />
of new trends. More and more manufacturers are making<br />
absorbers out of aluminium rather than copper because the material<br />
is much cheaper. For example, at the last ISH fair, Bosch Thermotechnik<br />
presented its new generation of flat collectors equipped<br />
with aluminium absorbers. At the beginning of 2011, Norwegian aluminium<br />
producer Norsk Hydro ASA went public with the name of<br />
its first customers to order aluminium tubes for their collector manufacturing,<br />
Solarbayer GmbH of Germany and Hewalex of Poland,<br />
which should start commercial production in the coming months.<br />
Another development priority is automating manufacturing processes,<br />
in other words reducing large-scale production costs. Significant<br />
progress has been made with both laser- and ultrasonic<br />
welding. GREENoneTEC of Austria has been at the vanguard of this<br />
technology and in July 2010, commissioned a new production line<br />
capable of manufacturing one collector per minute, taking its annual<br />
output to 450 000 collectors, for a total investment cost of around<br />
4 million Euros. A few months earlier (in April 2010), Viessmann had<br />
commissioned a new laser-welding machine capable of producing<br />
baromètre solaire thermique et héliothermodynamique<br />
SYSTÈMES <strong>SOLAIRE</strong>S le journal des énergies renouvelables N° 203 – 2011<br />
SOLAR THERMAL AND CONCENTRATED SOLAR POWER BAROM<strong>ET</strong>ER – EUROBSERV’ER – MAY 2011
90<br />
6,3<br />
La quantité d’énergie solaire thermique prévue par<br />
les NREAP en 2020 en Mtep/The solar thermal energy<br />
quantity scheduled for 2020 in the NREAPs in Mtoe<br />
solar thermal and concentrated solar power barometer<br />
sera d’une surface de capteurs de 36 305 m 2 ,<br />
soit près du double de celle de Marstal au<br />
Danemark, qui bénéficie d’une surface de<br />
capteurs de 19 875 m 2 .<br />
Le marché de la chaleur industrielle est également<br />
à explorer. Viessmann a montré<br />
l’exemple en installant sur le toit et sur l’une<br />
des façades de son usine de production de<br />
capteurs de Faulquemont 260 m 2 de capteurs<br />
à tubes sous vide. Ce système est utilisé<br />
pour chauffer un bain alcalin à plus de<br />
60 °C dans le but de dégraisser les ballons<br />
d’eau chaude avant l’opération d’émaillage.<br />
Selon le directeur de l’usine, il permet d’économiser<br />
la consommation de 10 000 litres<br />
de pétrole chaque année.<br />
Une autre tendance de l’industrie européenne<br />
est de gagner des parts de marché à<br />
l’international en investissant dans des<br />
capacités de production hors d’Europe. C’est<br />
notamment le cas de Vaillant qui produit<br />
depuis le début de l’année 2010 des capteurs<br />
solaires thermiques en Turquie, dans l’usine<br />
du fabricant de chaudières DemirDöküm,<br />
que le groupe a acheté en 2007. Bosch Thermotechnik<br />
a également annoncé sa décision<br />
de démarrer une production à Bangalore en<br />
Inde et à Campinas au Brésil en 2012. Comme<br />
déjà annoncé dans notre précédent baromètre,<br />
le groupe autrichien Kioto Clear Energy<br />
AG, qui détient 50 % de GREENoneTEC<br />
(l’autre moitié appartient à la holding danoise<br />
Danish VKR), a décidé de s’attaquer au marché<br />
nord-américain en inaugurant l’an dernier<br />
une usine d’assemblage de panneaux<br />
au Mexique.<br />
Cette année, les principaux fabricants ont<br />
été beaucoup moins enclins à communiquer<br />
sur leurs chiffres de production, donnant<br />
au mieux des tendances de leur niveau<br />
d’activité. Ainsi, les données proposées dans<br />
le tableau 7 doivent être considérées comme<br />
des ordres de grandeur. Il convient de<br />
préciser que certains de ces industriels ont<br />
des activités différentes et ne peuvent donc<br />
faire l’objet d’un classement.<br />
2020 : une croissance<br />
à reconstruire<br />
Le marché solaire thermique a vraisemblablement<br />
terminé de manger son pain noir.<br />
Il devrait repartir raisonnablement à la<br />
hausse dès 2011, grâce à un retour à la croissance<br />
des principaux marchés européens,<br />
avec un bémol pour le marché espagnol.<br />
Les plans d’action nationaux énergies<br />
renouvelables, établis par la Directive énergies<br />
renouvelables 2009/28/CE, ont donné<br />
une première idée de ce que peut représenter<br />
la filière à l’horizon 2020. Selon un travail<br />
de synthèse de ces plans réalisé par ECN<br />
(Energy Research Centre of the Netherlands)<br />
et par l’Agence européenne de l’environnement,<br />
les 27 pays de l’Union ont prévu<br />
une consommation de 3 005 ktep en 2015<br />
et 6 278 ktep en 2020. L’essentiel de cet<br />
effort sera réalisé par 8 pays, à savoir l’Italie,<br />
l’Allemagne, la France, l’Espagne, la Grèce,<br />
l’Autriche, le Portugal et Chypre.<br />
Ces objectifs ne cadrent évidemment pas<br />
avec la tendance actuelle. Ils nécessiteront<br />
la mise en place de politiques beaucoup<br />
plus agressives et même contraignantes<br />
pour parvenir à ce résultat. Nos projections<br />
basées sur un retour à la croissance du marché<br />
européen de l’ordre de 15 % par an sont<br />
plus prudentes. Elles amèneraient la puissance<br />
du parc européen à plus de 80 000<br />
MWth d’ici à 2020 (équivalant à une superficie<br />
de 114 millions de m 2 de capteurs) et<br />
permettraient la production de 4 355 ktep<br />
(graphique 5). Cette projection prévoit que<br />
l’objectif du Livre blanc de 1997, qui envisageait<br />
100 millions de m 2 fin 2010, ne soit<br />
atteint qu’au début de l’année 2020.<br />
De son côté, l’ESTIF (European Solar Thermal<br />
Industry Federation), qui représente les<br />
intérêts de la filière, a affiché sa déception<br />
concernant les objectifs des plans d’action.<br />
Selon elle, de nombreux pays de l’Union ne<br />
semblent pas avoir pris la mesure des<br />
potentialités de la filière. D’après les calculs<br />
de l’ESTIF, les objectifs actuels de 2020 porteraient<br />
la contribution du solaire thermique<br />
à 1,2 % de la consommation brute<br />
d’énergie finale de l’UE à 27, et à 5,47 % des<br />
besoins en chaleur et en rafraîchissement<br />
d’ici à 2020. Ces niveaux sont équivalents à<br />
une surface installée de 0,257 m 2 par habi-<br />
Centrale solaire thermique au sol de 15 000 m 2<br />
alimentant un réseau de chaleur à Ringkøbing<br />
au Danemark, inaugurée en 2010.<br />
This 15 000-m 2 ground-based solar-thermal plant<br />
that supplies a district heating network at<br />
Ringkøbing, Denmark was inaugurated in 2010.<br />
Berlingske Media A/S<br />
SYSTÈMES <strong>SOLAIRE</strong>S le journal des énergies renouvelables N° 203 – 2011<br />
BAROMÈTRE <strong>SOLAIRE</strong> <strong>THERMIQUE</strong> <strong>ET</strong> HÉLIOTHERMODYNAMIQUE – EUROBSERV’ER – MAI 2011
91baromètre solaire thermique et héliothermodynamique<br />
Exemple d’installation solaire thermique<br />
à vocation industrielle : usine Viessmann<br />
de Faulquemont (France).<br />
Example of a solar thermal installation<br />
for industrial process heat at Viessmann’s<br />
Faulquemont plant (France).<br />
Viessmann<br />
one absorber every 72 seconds. Automation is applied to other operations.<br />
In April 2011, GREENoneTEC installed a new fully-automatic<br />
absorber tube bending machine which has an output of 90 cycles<br />
per hour compared to a conventional line that completes 20-30<br />
bending operations per hour.<br />
European industry is banking on the current development of the<br />
large-format solar thermal system market. This market segment<br />
geared to hotels, multi-occupancy/public and administrative buildings<br />
seems unstoppable given the impetus driven by public authority<br />
incentive systems. According to a survey conducted on behalf of<br />
Sun & Wind Energy magazine, the large-scale system market share<br />
of installed collector surface was 27% in 2009 and was set to rise to<br />
34% in 2010. There is also an increase in the number of very large systems<br />
(>500 m 2 ) that feed heating networks or several buildings directly<br />
via micro-networks. These systems are developing very fast in the<br />
Northern Europe and also Austria. Denmark already has 62 MWth<br />
(88 600 m 2 ) of solar thermal capacity and a further 170 MWth (242 900<br />
m 2 ) or so in the pipeline. Nordic Clean Energy has a fixed-rate solar<br />
thermal kWh purchase offer for Danish heating network operators.<br />
This type of installation is also starting to develop outside Europe,<br />
opening up new markets for European industry. A point in case is<br />
GREENoneTEC, which has been chosen to supply collectors for the<br />
construction of the world’s biggest solar thermal system to equip<br />
the Princess Noura bint Abdulrahman University in Saudi Arabia.<br />
The campus, whose construction is scheduled for completion by the<br />
end of 2011, will be the size of a small city, accommodating 40 000<br />
students, academic and other staff and comprise 13 faculties, halls<br />
of residence, research installations and a hospital. The solar thermal<br />
system is designed to cover all the installations’ hot water and<br />
winter hea ting needs (November to February). The system will have<br />
a collector surface area of 36 305 m 2 , which is almost twice the collector<br />
surface area (19 875 m 2 ) at Marstal, Denmark.<br />
The industrial heat market is also worth tapping and the German<br />
industrial concern Viessmann has shown the way by installing 260<br />
m 2 of vacuum tube collectors on the roof and one of the facades of<br />
its Faulquemont collector production plant. The system is used to<br />
heat an alkaline bath to over 60°C to degrease hot water tanks in<br />
preparation for enamelling. According to the factory director, the<br />
system saves 10 000 litres of oil per annum.<br />
Another European industry trend is to increase market share<br />
abroad by investing in production facilities outside Europe. A prime<br />
example of this is Vaillant which has been manufacturing solar<br />
thermal collectors in Turkey since the start of 2010 in the Demir<br />
Döküm boiler manufacturer’s plant, which the group acquired in<br />
2007. Bosch Thermotechnik has also announced its decision to start<br />
manufacturing in Bangalore, India and Cam pinas, Brazil in 2012. As<br />
already mentioned in our previous barometer, the Austrian group<br />
Kioto Clear Energy AG, which holds 50% of GREENoneTEC (the other<br />
half is held by Danish holding company VKR), decided to tackle<br />
the North-American market by opening a panel assembly plant in<br />
Mexico last year.<br />
This year the main manufacturers have been rather reluctant to<br />
publish their output figures, preferring at best to divulge their activity<br />
trends. Consequently, the data presented in table 7 should be<br />
read as orders of magnitude and it should be pointed out that some<br />
of these manufacturers have other activities and thus cannot be<br />
included in the ranking.<br />
2020 – growth needs to be rebuilt<br />
The solar thermal market is probably over the worst and in all reason<br />
should pick up again in 2011, thanks to the recovery of the main<br />
European markets, perhaps with the exception of the Spanish market.<br />
The national renewable energy action plans (NREAPs), established<br />
by the renewable energy directive 2009/28/CE, have given an<br />
inkling of what the sector could be like by the 2020 timeline. The<br />
summary paper on these plans published by ECN (Energy Research<br />
Center of the Netherlands) and the European Environment Agency<br />
of the 27 EU countries, predict consumption of 3 005 ktoe in 2015<br />
and 6 278 ktoe in 2020. Most of this effort will be produced by 8 countries:<br />
Italy, Germany, France, Spain, Greece, Austria, Portugal and<br />
Cyprus.<br />
Obviously these objectives are at odds with the current trend as<br />
they will call for the setting of much more proactive, binding policies<br />
if they are to achieve this result. Our projections are more conservative<br />
and are based on the European market returning to<br />
growth at an annual rate of around 15%, which would increase the<br />
capacity of European collector base to over 80 000 MWth by 2020<br />
(equivalent to a collector surface area of 114 million m 2 ) and would<br />
generate 4 355 ktoe (graph 5). This projection assumes the 1997<br />
White Paper which set a target of 100 million m 2 by the end of 2010,<br />
will not be achieved until the beginning of 2020.<br />
For its part, ESTIF (European Solar Thermal Industry Federation),<br />
which represents the sector’s interests, has expressed its disap-<br />
SYSTÈMES <strong>SOLAIRE</strong>S le journal des énergies renouvelables N° 203 – 2011<br />
SOLAR THERMAL AND CONCENTRATED SOLAR POWER BAROM<strong>ET</strong>ER – EUROBSERV’ER – MAY 2011
92<br />
solar thermal and concentrated solar power barometer<br />
Graph. n°5<br />
Tendance actuelle de la consommation d’énergie solaire thermique par rapport à<br />
la feuille de route des plans d’action nationaux énergies renouvelables (en ktep)/<br />
Comparison of the current solar thermal energy consumption trend against<br />
the NREAP (National Renewable Energy Action Plan) roadmaps (in ktoe)<br />
1 086<br />
1 243 1 370 1 449<br />
2 315<br />
3 005<br />
4 355<br />
2008 2009 2010 2015 2020<br />
Source : EurObserv’ER 2011.<br />
NREAP<br />
Télécharger/Download<br />
EurObserv’ER met à disposition sur<br />
www.energies-renouvelables.org<br />
(langue française) et<br />
www.eurobserver.org (langue anglaise)<br />
une base de données interactive des<br />
indicateurs du baromètre. Disponible<br />
en cliquant sur le bandeau “Interactive<br />
EurObserv’ER Database”, cet outil vous<br />
permet de télécharger les données<br />
du baromètre sous format Excel.<br />
NREAP<br />
6 278<br />
NREAP<br />
tant, alors que l’ESTIF visait un taux de pénétration<br />
d’au moins 0,8 m 2 par habitant.<br />
Toujours selon l’ESTIF, ce but pourrait facilement<br />
être atteint si l’Union européenne ou<br />
les États membres mettaient en place des<br />
standards d’efficacité énergétique plus performants<br />
pour les bâtiments déjà construits.<br />
En effet, les directives européennes sur les<br />
performances énergétiques des bâtiments<br />
ne concernent que les nouvelles constructions<br />
(Directive 2002/91/EC renforcée par la<br />
Directive 2010/31/EU), qui ne représentent<br />
que 1 % du parc total de bâtiments.<br />
La clé de la future croissance ne dépendra<br />
pas seulement des aspects de réglementation<br />
thermique. Elle sera sans doute fonction<br />
de l’évolution prochaine des prix de<br />
l’énergie conventionnelle, qui devraient augmenter<br />
de manière significative dans les<br />
prochaines années, en relation avec d’importants<br />
investissements prévus dans les<br />
infrastructures (électricité, gaz et pétrole) et<br />
du fait d’une demande toujours plus importante<br />
au niveau mondial. On peut remarquer<br />
que le prix du pétrole est progressivement<br />
repassé au-dessus de la barre des 100 $/le<br />
baril fin 2010, atteignant les 125 $/le baril en<br />
avril dernier, de plus en plus proche de son<br />
record historique des 150 $/le baril.<br />
L’industrie a également besoin de mettre<br />
en place une stratégie de communication<br />
plus agressive afin d’inculquer le “réflexe<br />
solaire” lorsque vient le temps d’investir<br />
dans un nouveau système de chauffage. Les<br />
efforts de formation des installateurs, des<br />
architectes et des bailleurs doivent aussi<br />
EurObserv’ER is posting an interactive<br />
database of the barometer indicators on<br />
the www.energies-renouvelables.org<br />
(French-language) and<br />
www.eurobserv-er.org (Englishlanguage)<br />
sites. Click the “Interactive<br />
EurObserv’ER Database” banner to<br />
download the barometer data in<br />
Excel format.<br />
être poursuivis. Le succès dépendra également<br />
de la capacité de la filière à diminuer<br />
ses coûts de production et à mettre sur le<br />
marché des systèmes de plus en plus faciles<br />
à installer et de mieux en mieux intégrés<br />
dans l’architecture des bâtiments. Pour ce<br />
faire, des passerelles plus étroites entre le<br />
secteur de la construction et celui de l’industrie<br />
solaire thermique doivent être mises<br />
en place. Les innovations présentées dans<br />
les salons et la modernisation des capacités<br />
de production montrent que la reconstruction<br />
de la filière est largement amorcée. Il<br />
faudra encore convaincre le grand public<br />
que l’énergie solaire n’est pas seulement<br />
une énergie du cœur, mais aussi une énergie<br />
de la raison. <br />
Ce baromètre a été réalisé par Observ’ER<br />
dans le cadre du projet “EurObserv’ER”<br />
regroupant Observ’ER (FR), ECN (NL),<br />
Institute for Renewable Energy (EC BREC<br />
I.E.O, PL), Jozef Stefan Institute (SL),<br />
Renac (DE) et EA Energy Analyses (DK).<br />
Le contenu de cette publication n’engage<br />
que la responsabilité de son auteur<br />
et ne représente pas l’opinion de<br />
la Communauté européenne.<br />
La Commission européenne n’est pas<br />
responsable de l’usage qui pourrait être<br />
fait des informations qui y figurent.<br />
Cette action bénéficie du soutien<br />
financier de l’Ademe, du programme<br />
Énergie Intelligente – Europe et de la<br />
Caisse des dépôts.<br />
This barometer was prepared by<br />
Observ’ER in the scope of the<br />
“EurObserv’ER” Project which groups<br />
together Observ’ER (FR), ECN (NL),<br />
Institute for Renewable Energy (EC BREC<br />
I.E.O, PL), Jozef Stefan Institute (SL),<br />
Renac (DE) and EA Energy Analyses (DK).<br />
Sole responsibility for the publication’s<br />
content lies with its authors. It does<br />
not represent the opinion of the<br />
European Communities. The European<br />
Commission may not be held<br />
responsible for any use that may be<br />
made of the information published.<br />
This action benefits from the financial<br />
support of Ademe, the Intelligent<br />
Energy – Europe programme and Caisse<br />
des dépôts.<br />
SYSTÈMES <strong>SOLAIRE</strong>S le journal des énergies renouvelables N° 203 – 2011<br />
BAROMÈTRE <strong>SOLAIRE</strong> <strong>THERMIQUE</strong> <strong>ET</strong> HÉLIOTHERMODYNAMIQUE – EUROBSERV’ER – MAI 2011
93<br />
Tabl. n°7<br />
Entreprises représentatives du solaire thermique dans l’Union européenne en 2010*<br />
Representative companies of the European Union solar thermal industry in 2010*<br />
Entreprises<br />
Companies<br />
GREENoneTEC<br />
Viessmann<br />
Schüco Solarthermie<br />
Thermosolar<br />
Solvis<br />
Ritter Solar<br />
Vaillant Group<br />
Bosch Thermotechnik<br />
Riposol<br />
Riello<br />
Prime Lasertech<br />
Pays<br />
Countries<br />
Autriche<br />
Austria<br />
Allemagne<br />
Germany<br />
Allemagne<br />
Germany<br />
Allemagne<br />
Germany<br />
Allemagne<br />
Germany<br />
Allemagne<br />
Germany<br />
Allemagne<br />
Germany<br />
Allemagne<br />
Germany<br />
Autriche<br />
Austria<br />
Italie<br />
Italy<br />
Grèce<br />
Greece<br />
* Estimation. Estimate. Source : EurObserv’ER 2011.<br />
Activité<br />
Activity<br />
Fabricant de capteurs plans vitrés et sous vide<br />
Flat plate and vacuum collectors<br />
Fournisseur d’équipements de chauffage dont systèmes solaires<br />
Heating equipment supplier: solar thermal component<br />
Fenêtrier et fournisseur de systèmes solaires thermiques<br />
Double glazing unit and solar thermal heating systems supplier<br />
Fournisseur de systèmes solaires thermiques<br />
Solar thermal heating systems supplier<br />
Fournisseur de systèmes solaires thermiques et photovoltaïques<br />
Solar thermal heating and photovoltaïc systems supplier<br />
Fournisseur de systèmes solaires thermiques<br />
Solar thermal heating systems supplier<br />
Fournisseur d’équipements de chauffage dont systèmes solaires<br />
Heating equipment supplier: solar thermal component<br />
Fournisseur d’équipements de chauffage dont systèmes solaires<br />
Heating equipment supplier: solar thermal component<br />
Fournisseur de systèmes solaires thermiques<br />
Solar thermal heating systems supplier<br />
Fournisseur de systèmes solaires thermiques<br />
Solar thermal heating systems supplier<br />
Fournisseur de systèmes solaires thermiques<br />
Solar thermal heating systems supplier<br />
Production<br />
en 2009 (m 2 )<br />
Production<br />
in 2009 (m 2 )<br />
Production<br />
en 2010 (m 2 )*<br />
Production<br />
in 2010 (m 2 )*<br />
980 000 800 000<br />
308 000 300 000<br />
320 000 310 000<br />
270 000 250 000<br />
300 000 280 000<br />
140 000 136 000<br />
190 000 200 000<br />
450 000 425 000<br />
125 000 135 000<br />
37 000 100 000<br />
100 000 105 000<br />
baromètre solaire thermique et héliothermodynamique<br />
pointment with the action plan targets. It feels that many European<br />
Union countries seem to have underestimated the sector’s potential.<br />
According to its calculations, the current targets for 2020 would<br />
raise solar thermal’s contribution to 1.2% of the gross final energy<br />
consumption of the EU of 27, and to 5.47% of the heating and cooling<br />
requirements by 2020. These levels are equivalent to an installed<br />
surface area of 0.257 m 2 per inhabitant, while ESTIF was aiming at<br />
a penetration rate of at lease 0.8 m 2 per inhabitant.<br />
The association claims this target would be easy to attain if the<br />
European Union or the Member States implemented more stringent<br />
energy efficiency standards for existing buildings. As it stands, the<br />
European building energy efficiency directives only cover new constructions<br />
(2002/91/EC Directive strengthened by the 2010/31/EU<br />
Directive) – a mere 1% annually of the total building base.<br />
The key to future growth will not only depend on thermal regulation<br />
issues, but will no doubt be driven by future conventional energy<br />
price trends. The latter should rise significantly in coming years,<br />
because of the major investments planned for infrastructures (electricity,<br />
gas and oil) and the fact that the worldwide demand is<br />
increasing relentlessly. We should bear in mind that the price of oil<br />
crept up and over the $100 per barrel bar at the end of 2010, to reach<br />
$125 per barrel last April, and is gradually getting nearer its historic<br />
high of $150 per barrel.<br />
The industry also needs to implement a harder-driving communication<br />
strategy to instil the “solar instinct” when the time comes<br />
to invest in a new heating system. Installer, architect and institutional<br />
landlord training efforts should also be pursued. The sector’s<br />
capacity to reduce its manufacturing costs and launch easier to<br />
install, more architecturally-friendly systems on the market will<br />
also enhance its success. The construction sector and the solar thermal<br />
industry will have to work much closer together. The innovations<br />
presented at trade fairs and the modernisation of production<br />
facilities demonstrate that the sector’s reconstruction is progressing<br />
well. Yet the general public will have to be convinced that solar<br />
energy is not just wishful thinking, but rational thinking at that. <br />
Sources table 1 and 5 : ZSW (Germany), ASIT (Spain), IDAE (Spain), Red Eléctrica de<br />
Espana (Spain), Protermo Solar (Spain), Assoltherm (Italy), Austria Solar, Enerplan<br />
(France), EBHE (Greece), IEO ECBREC (Poland), Apisolar (Portugal), Solar Trade Association<br />
(United Kingdom), Ministry of Industry and trade (Czech Republic), CBS<br />
(Netherlands), Belsolar (Belgium), PlanEnergi (Denmark), Solar Energy Association<br />
of Sweden, SEAI (Ireland Republic), Cyprus Energy Institute, JSI-EEC (Slovenia),<br />
Energy Center Bratislava (Slovakia), Thermosolar Ziar ltd (Slovakia), Sofia<br />
Energy Centre (Bulgaria), Statistics Finland.<br />
Le prochain baromètre traitera des biocarburants<br />
The next barometer will be about biofuels<br />
SYSTÈMES <strong>SOLAIRE</strong>S le journal des énergies renouvelables N° 203 – 2011<br />
SOLAR THERMAL AND CONCENTRATED SOLAR POWER BAROM<strong>ET</strong>ER – EUROBSERV’ER – MAY 2011