Industries des Matériaux de Construction, de la - Tunisie industrie
Industries des Matériaux de Construction, de la - Tunisie industrie
Industries des Matériaux de Construction, de la - Tunisie industrie

You also want an ePaper? Increase the reach of your titles
YUMPU automatically turns print PDFs into web optimized ePapers that Google loves.
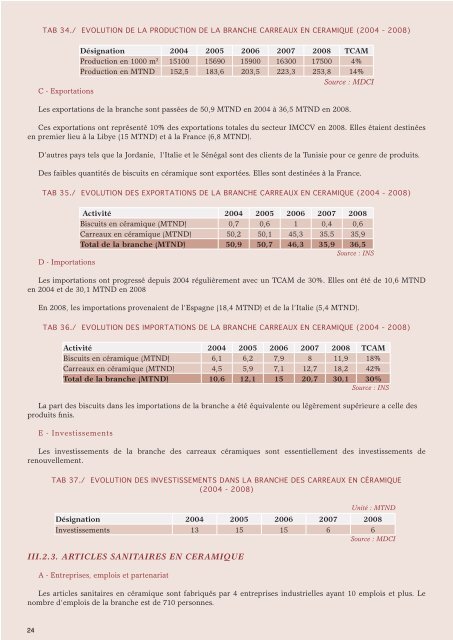
TAB 34./ EVOLUTION DE LA PRODUCTION DE LA BRANCHE CARREAUX EN CERAMIQUE (2004 - 2008)Désignation 2004 2005 2006 2007 2008 TCAMProduction en 1000 m 2 15100 15690 15900 16300 17500 4%Production en MTND 152,5 183,6 203,5 223,3 253,8 14%Source : MDCIC - ExportationsLes exportations <strong>de</strong> <strong>la</strong> branche sont passées <strong>de</strong> 50,9 MTND en 2004 à 36,5 MTND en 2008.Ces exportations ont représenté 10% <strong><strong>de</strong>s</strong> exportations totales du secteur IMCCV en 2008. Elles étaient <strong><strong>de</strong>s</strong>tinéesen premier lieu à <strong>la</strong> Libye (15 MTND) et à <strong>la</strong> France (6,8 MTND).D’autres pays tels que <strong>la</strong> Jordanie, l’Italie et le Sénégal sont <strong><strong>de</strong>s</strong> clients <strong>de</strong> <strong>la</strong> <strong>Tunisie</strong> pour ce genre <strong>de</strong> produits.Des faibles quantités <strong>de</strong> biscuits en céramique sont exportées. Elles sont <strong><strong>de</strong>s</strong>tinées à <strong>la</strong> France.TAB 35./ EVOLUTION DES EXPORTATIONS DE LA BRANCHE CARREAUX EN CERAMIQUE (2004 - 2008)Activité 2004 2005 2006 2007 2008Biscuits en céramique (MTND) 0,7 0,6 1 0,4 0,6Carreaux en céramique (MTND) 50,2 50,1 45,3 35.5 35,9Total <strong>de</strong> <strong>la</strong> branche (MTND) 50,9 50,7 46,3 35,9 36,5Source : INSD - ImportationsLes importations ont progressé <strong>de</strong>puis 2004 régulièrement avec un TCAM <strong>de</strong> 30%. Elles ont été <strong>de</strong> 10,6 MTNDen 2004 et <strong>de</strong> 30,1 MTND en 2008En 2008, les importations provenaient <strong>de</strong> l’Espagne (18,4 MTND) et <strong>de</strong> <strong>la</strong> l’Italie (5,4 MTND).TAB 36./ EVOLUTION DES IMPORTATIONS DE LA BRANCHE CARREAUX EN CERAMIQUE (2004 - 2008)Activité 2004 2005 2006 2007 2008 TCAMBiscuits en céramique (MTND) 6,1 6,2 7,9 8 11,9 18%Carreaux en céramique (MTND) 4,5 5,9 7,1 12,7 18,2 42%Total <strong>de</strong> <strong>la</strong> branche (MTND) 10,6 12,1 15 20,7 30,1 30%Source : INSLa part <strong><strong>de</strong>s</strong> biscuits dans les importations <strong>de</strong> <strong>la</strong> branche a été équivalente ou légèrement supérieure a celle <strong><strong>de</strong>s</strong>produits finis.E - InvestissementsLes investissements <strong>de</strong> <strong>la</strong> branche <strong><strong>de</strong>s</strong> carreaux céramiques sont essentiellement <strong><strong>de</strong>s</strong> investissements <strong>de</strong>renouvellement.TAB 37./ EVOLUTION DES INVESTISSEMENTS DANS LA BRANCHE DES CARREAUX EN CÉRAMIQUE(2004 - 2008)Unité : MTNDDésignation 2004 2005 2006 2007 2008Investissements 13 15 15 6 6Source : MDCIIII.2.3. ARTICLES SANITAIRES EN CERAMIQUEA - Entreprises, emplois et partenariatLes articles sanitaires en céramique sont fabriqués par 4 entreprises <strong>industrie</strong>lles ayant 10 emplois et plus. Lenombre d’emplois <strong>de</strong> <strong>la</strong> branche est <strong>de</strong> 710 personnes.24