Industries des Matériaux de Construction, de la - Tunisie industrie
Industries des Matériaux de Construction, de la - Tunisie industrie
Industries des Matériaux de Construction, de la - Tunisie industrie

Create successful ePaper yourself
Turn your PDF publications into a flip-book with our unique Google optimized e-Paper software.
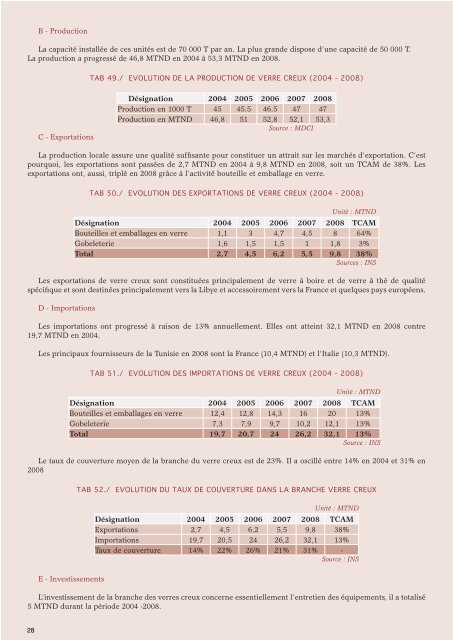
B - ProductionLa capacité installée <strong>de</strong> ces unités est <strong>de</strong> 70 000 T par an. La plus gran<strong>de</strong> dispose d’une capacité <strong>de</strong> 50 000 T.La production a progressé <strong>de</strong> 46,8 MTND en 2004 à 53,3 MTND en 2008.TAB 49./ EVOLUTION DE LA PRODUCTION DE VERRE CREUX (2004 - 2008)C - ExportationsDésignation 2004 2005 2006 2007 2008Production en 1000 T 45 45.5 46.5 47 47Production en MTND 46,8 51 52,8 52,1 53,3Source : MDCILa production locale assure une qualité suffisante pour constituer un attrait sur les marchés d’exportation. C’estpourquoi, les exportations sont passées <strong>de</strong> 2,7 MTND en 2004 à 9,8 MTND en 2008, soit un TCAM <strong>de</strong> 38%. Lesexportations ont, aussi, triplé en 2008 grâce à l’activité bouteille et embal<strong>la</strong>ge en verre.TAB 50./ EVOLUTION DES EXPORTATIONS DE VERRE CREUX (2004 - 2008)Unité : MTNDDésignation 2004 2005 2006 2007 2008 TCAMBouteilles et embal<strong>la</strong>ges en verre 1,1 3 4,7 4,5 8 64%Gobeleterie 1,6 1,5 1,5 1 1,8 3%Total 2,7 4,5 6,2 5,5 9,8 38%Sources : INSLes exportations <strong>de</strong> verre creux sont constituées principalement <strong>de</strong> verre à boire et <strong>de</strong> verre à thé <strong>de</strong> qualitéspécifique et sont <strong><strong>de</strong>s</strong>tinées principalement vers <strong>la</strong> Libye et accessoirement vers <strong>la</strong> France et quelques pays européens.D - ImportationsLes importations ont progressé à raison <strong>de</strong> 13% annuellement. Elles ont atteint 32,1 MTND en 2008 contre19,7 MTND en 2004.Les principaux fournisseurs <strong>de</strong> <strong>la</strong> <strong>Tunisie</strong> en 2008 sont <strong>la</strong> France (10,4 MTND) et l’Italie (10,3 MTND).TAB 51./ EVOLUTION DES IMPORTATIONS DE VERRE CREUX (2004 - 2008)Unité : MTNDDésignation 2004 2005 2006 2007 2008 TCAMBouteilles et embal<strong>la</strong>ges en verre 12,4 12,8 14,3 16 20 13%Gobeleterie 7,3 7,9 9,7 10,2 12,1 13%Total 19,7 20,7 24 26,2 32,1 13%Source : INSLe taux <strong>de</strong> couverture moyen <strong>de</strong> <strong>la</strong> branche du verre creux est <strong>de</strong> 23%. Il a oscillé entre 14% en 2004 et 31% en2008TAB 52./ EVOLUTION DU TAUX DE COUVERTURE DANS LA BRANCHE VERRE CREUXUnité : MTNDDésignation 2004 2005 2006 2007 2008 TCAMExportations 2,7 4,5 6,2 5,5 9,8 38%Importations 19,7 20,5 24 26,2 32,1 13%Taux <strong>de</strong> couverture 14% 22% 26% 21% 31% -Source : INSE - InvestissementsL’investissement <strong>de</strong> <strong>la</strong> branche <strong><strong>de</strong>s</strong> verres creux concerne essentiellement l’entretien <strong><strong>de</strong>s</strong> équipements, il a totalisé5 MTND durant <strong>la</strong> pério<strong>de</strong> 2004 -2008.28