1 Objectifs 2 Introduction `a SPSS - Statistique pour sciences sociales
1 Objectifs 2 Introduction `a SPSS - Statistique pour sciences sociales
1 Objectifs 2 Introduction `a SPSS - Statistique pour sciences sociales

You also want an ePaper? Increase the reach of your titles
YUMPU automatically turns print PDFs into web optimized ePapers that Google loves.
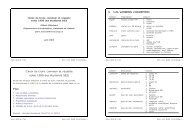
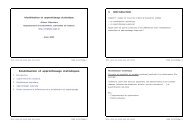
FREQUENCIESexempleValid123Totalclasse d'ageCumulativeFrequency Percent Valid Percent Percent32 32.0 32.0 32.033 33.0 33.0 65.035 35.0 35.0 100.0100 100.0 100.0403020classe d'ageGRAPHS : divers graphiques :– Données catégorielles : barres (bars), circulaire (pie)– Données ordinales : lines, surfaces (area), boxplot– Données quantitatives : histogrammes (histogram),dispersion (scatterplot)Frequency100123classe d'ageTraitement données d’enquête Plan <strong>SPSS</strong> Données Descr Infer ◭ ◮ 3/10/2002gr 13Traitement données d’enquête Plan <strong>SPSS</strong> Données Descr Infer ◭ ◮ 3/10/2002gr 15DESCRIPTIVES : exempleGRAPHS/BAR : exempleNUMÉROSEXEclasse d'ageINSTRUCTprofession du pèreNUMEROSEXclasse d'ageETUDEprofession du pèreValid N (listwise)Descriptive StatisticsN Minimum Maximum Mean Std. Deviation100 102 1101 160.50 99.205100 1 3 1.58 .516100 1 3 2.03 .822100 1 2 1.38 .488100 1 4 3.02 .864100 101 200 150.50 29.011100 1 2 1.56 .499100 1 3 2.01 .823100 1 2 1.38 .488100 1 4 3.05 .869100CountClasses d'âge35.535.034.534.033.533.032.532.031.5123classe d'age!! Observer l'échelle !!Traitement données d’enquête Plan <strong>SPSS</strong> Données Descr Infer ◭ ◮ 3/10/2002gr 14Traitement données d’enquête Plan <strong>SPSS</strong> Données Descr Infer ◭ ◮ 3/10/2002gr 16