2008 Rapport d'activité ARRG - Aéroport Roland Garros de la Réunion
2008 Rapport d'activité ARRG - Aéroport Roland Garros de la Réunion
2008 Rapport d'activité ARRG - Aéroport Roland Garros de la Réunion

Create successful ePaper yourself
Turn your PDF publications into a flip-book with our unique Google optimized e-Paper software.
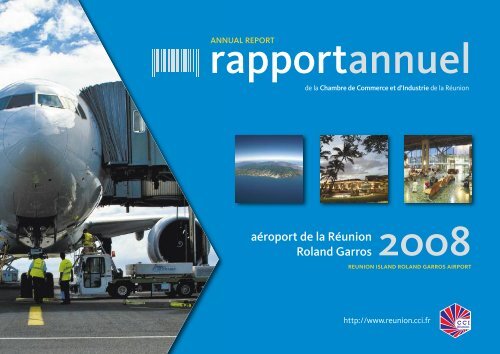
apportannuelANNUAL REPORT<strong>de</strong> <strong>la</strong> Chambre <strong>de</strong> Commerce et d’Industrie <strong>de</strong> <strong>la</strong> Réunionaéroport <strong>de</strong> <strong>la</strong> Réunion<strong>Ro<strong>la</strong>nd</strong> <strong>Garros</strong><strong>2008</strong>reunion is<strong>la</strong>nd ro<strong>la</strong>nd garros airporthttp://www.reunion.cci.fr
R A P P O R T A N N U E LA É R O P O R T D E L A R É U N I O N R O L A N D G A R R O S 2 0 0 8ANNUAL REPORT | REUNION ISLAND ROLAND GARROS AIRPORTéditorial par Bernard Lallemand page 3l’aéroport <strong>Ro<strong>la</strong>nd</strong> <strong>Garros</strong> page 4ROLAND GARROS AIRPORTle trafic pages 5|6TRAFFICles passagers pages 7|10PASSENGERSle fret pages 11|12FREIGHTles événements marquants en <strong>2008</strong> pages 13|15<strong>2008</strong>’S MAJOR EVENTSles éléments financiers pages 16|17FINANCIAL DATAles annexes pages 18|22APPENDICESrapportannuel <strong>2008</strong>|2aéroport <strong>de</strong> <strong>la</strong> Réunion <strong>Ro<strong>la</strong>nd</strong> <strong>Garros</strong><strong>Rapport</strong> d’activité <strong>de</strong> l’aéroport <strong>de</strong> <strong>la</strong> Réunion <strong>Ro<strong>la</strong>nd</strong> <strong>Garros</strong>Photos : Florent Perau<strong>de</strong>au (CCIR) - Serge Gé<strong>la</strong>bert - Martin BenckeConception - Réalisation : HTC - N°ISSN : 1958-8550 - Impression : Print 2000IMPRESSION SUR PAPIER RECYCLÉhttp://www.reunion.cci.fr
éditorialRedressement confirméL’aéroport <strong>de</strong> <strong>la</strong> Réunion <strong>Ro<strong>la</strong>nd</strong> <strong>Garros</strong> a accueilli en <strong>2008</strong> un nombre <strong>de</strong> passagers record(1,654 million), confirmant <strong>la</strong> reprise du trafic sur notre p<strong>la</strong>te-forme, amorcée en 2007 après<strong>la</strong> grave crise <strong>de</strong> 2006.Notre premier motif <strong>de</strong> satisfaction est d’ordre économique. Grâce à unecroissance du trafic conforme à nos prévisions, les principaux indicateurs<strong>de</strong> <strong>la</strong> comptabilité aéroportuaire ont poursuivi leur amélioration et nousavons pu anticiper le remboursement <strong>de</strong>s <strong>de</strong>ttes sociales et fiscalesaccumulées au cours <strong>de</strong>s années passées. De même, <strong>la</strong> surtaxe excep -tion nelle appliquée aux passagers <strong>de</strong>puis juillet 2007 a pu être suppriméeau 1er avril 2009. Sur ces bases assainies, l’aéroport a pu continuer àpréparer l’avenir. Les investissements ont porté à <strong>la</strong> fois sur les pistes, quiont été adaptées à l’arrivée <strong>de</strong> nouveaux avions gros porteurs (B 777–300), et sur les équipements <strong>de</strong> l’aérogare.Nos équipes ont accompli en <strong>2008</strong> un important travail dans le domaine<strong>de</strong> <strong>la</strong> sécurité : <strong>Ro<strong>la</strong>nd</strong> <strong>Garros</strong> a reçu sa certification <strong>de</strong> sécurité aéropor -tuaire, délivrée par l’OACI, et son schéma directeur opérationnel <strong>de</strong> <strong>la</strong>sécurité a été approuvé.Notre concession a également pris en charge une nouvelle mission, celle<strong>de</strong> l’accueil <strong>de</strong>s personnes à mobilité réduite, et s’est préparée au trans -fert <strong>de</strong> nouvelles compétences jusqu’alors assumées par l’Aviation Civile.Malgré une conjoncture économique générale qui a commencé à sedégra<strong>de</strong>r en fin d’année, atténuant <strong>la</strong> forte reprise du premier semestre,l’aéroport <strong>de</strong> <strong>la</strong> Réunion <strong>Ro<strong>la</strong>nd</strong> <strong>Garros</strong> s’apprête à vivre une nouvelleétape <strong>de</strong> son développement. Elle sera marquée par <strong>la</strong> création d’uneSociété Aéroportuaire au sein <strong>de</strong> <strong>la</strong>quelle <strong>la</strong> CCIR entend jouer un rôlemoteur, et par d’importants investissements nécessaires pour adapterl’aéroport <strong>de</strong> <strong>la</strong> Réunion à <strong>la</strong> crois sance du trafic, mais aussi auxévolutions règlemen taires et technologiques.Bernard LallemandPrési<strong>de</strong>nt <strong>de</strong> <strong>la</strong> Commission Aéroport<strong>de</strong> <strong>la</strong> Réunion <strong>Ro<strong>la</strong>nd</strong> <strong>Garros</strong> et Liaisons AériennesConfirmed recoveryReunion Is<strong>la</strong>nd <strong>Ro<strong>la</strong>nd</strong> <strong>Garros</strong> Airport handled an all-time high numberof passengers in <strong>2008</strong> (1.654 million); traffic recovery, which startedin 2007 after the severe 2006 crisis, was confirmed.Our first motive for satisfaction is economic. Thanks to traffic growththat met our previsions, the airport’s main accounts indicators continuedto improve, enabling us to clear in advance our Social Security repaymentcontributions and tax <strong>de</strong>bts accrued in previous years. In the same line,the exceptional surtax charged to passengers since July 2007was suppressed as of 1 April 2009. On these healthy bases, the airportcontinued to prepare the future. Investment was ma<strong>de</strong> both on runways,which were adapted to accommodate new long-haul carriers (B 777-300),and terminal equipment.Our staff did a consi<strong>de</strong>rable job for security in <strong>2008</strong>: <strong>Ro<strong>la</strong>nd</strong> <strong>Garros</strong>Airport was granted Airport Safety and Security certification by ICAO,and its Security Operational Blueprint was approved.The Airport also took on a new responsibility: handling of passengerswith reduced mobility, and got ready for the transfer of new functionshitherto performed by the Civil Aviation administration.Though the global economic situation worsened <strong>la</strong>te in the year,bringing down the first semester’s strong recovery, Reunion <strong>Ro<strong>la</strong>nd</strong> <strong>Garros</strong>Airport is ready to live a new stage of its <strong>de</strong>velopment: an AirportManagement Company-of which the CCIR intends to be the drivingforce-is to be set up, and substantial investment will have to be ma<strong>de</strong>to adapt Reunion’s airport to traffic growth and ensure compliancewith regu<strong>la</strong>tory and technological changes.Bernard LallemandPresi<strong>de</strong>nt of the Reunion <strong>Ro<strong>la</strong>nd</strong> <strong>Garros</strong> Airportand Air Services Committeerapportannuel <strong>2008</strong>|3aéroport <strong>de</strong> <strong>la</strong> Réunion <strong>Ro<strong>la</strong>nd</strong> <strong>Garros</strong>
L’aéroport <strong>de</strong> <strong>la</strong> Réunion <strong>Ro<strong>la</strong>nd</strong> <strong>Garros</strong>En tenant compte <strong>de</strong>s passagers en transit, l’aéroport <strong>de</strong><strong>la</strong> Réunion <strong>Ro<strong>la</strong>nd</strong> <strong>Garros</strong> a connu en <strong>2008</strong> une affluencerecord <strong>de</strong> 1654105 passagers (+3,7%). Cette <strong>de</strong>uxièmeannée <strong>de</strong> croissance consécutive après <strong>la</strong> crise<strong>de</strong> 2006 a comporté <strong>de</strong>ux phases distinctes :niveau soutenu au premier semestre (+8,4%)mais quasi stagnation au second, traduisantles premiers effets <strong>de</strong> <strong>la</strong> crise mondiale.Reunion <strong>Ro<strong>la</strong>nd</strong> <strong>Garros</strong> AirportThe number of Reunion <strong>Ro<strong>la</strong>nd</strong> <strong>Garros</strong> Airportpassengers (transit inclu<strong>de</strong>d) reachedan all-time high of 1,654,105 (+ 3.7%) in <strong>2008</strong>.The second consecutive growth yearafter the 2006 crisis had two distinctive phases:strong rise in the first semester (+ 8.4%),but near stagnation in the second,due to the first effects of the world crisis.Trafic commercial // Commercial trafficPassagers Passengers Arrivées ArrivingDéparts DepartingTotal Passagers locaux Total Local PassengersTransitsTotal Passagers Total PassengersFret aérien Air Freight débarqué Freight In(en tonnes) (tons) embarqué Freight OutTotal Fret aérien Total Air FreightFret poste Postal Freight débarqué Freight In(en tonnes) (tons) embarqué Freight OutTotal Fret poste Total Postal FreightMouvements d'avions P<strong>la</strong>ne MovementsTonnage Atterri/décollé Lan<strong>de</strong>d-Taken-off Tonnage2004 2005 2006 2007 <strong>2008</strong>796 403790 0021 586 40510 2531 596 65820 1848 10028 2842 9251 0964 02113 2601 650 876771 383767 1371 538 52034 7391 573 25919 9117 91027 8203 2771 2454 52212 4221 644 252653 306654 9301 308 23655 8001 364 03620 6647 75328 4173 6009814 58110 9361 592 304764 287755 7771 520 06474 7411 594 80521 0087 75528 7633 4891 1384 62710 9831 687 842797 046788 9711 586 01768 0881 654 10519 4637 41626 8793 8211 3385 15911 6781 757 920Evolution Variation2007/<strong>2008</strong>+4,3%+4,4%+4,3%-8,9%+3,7%-7,4%-4,4%-6,6%+9,5%+17,6%+11,5%+6,3%+4,2%Taux moyen/an2004/<strong>2008</strong>Average Annual Rate+0,02%-0,03%-0,01%+60,5%+0,9%-0,9%-2,2%-1,3%+6,9%+5,1%+6,4%-3,1%+1,6%rapportannuel <strong>2008</strong>|4aéroport <strong>de</strong> <strong>la</strong> Réunion <strong>Ro<strong>la</strong>nd</strong> <strong>Garros</strong>
Le traficLa hausse <strong>de</strong> 6,3% du nombre <strong>de</strong>s mouvements d'avions,associée à <strong>la</strong> croissance du tonnage atterri-décollé<strong>de</strong> 4,2%, témoigne <strong>de</strong> l’augmentation <strong>de</strong>s capacitésoffertes par <strong>la</strong> p<strong>la</strong>te-forme, avec une augmentation<strong>de</strong>s aéronefs <strong>de</strong> petites capacités (inférieursà 100 sièges) par rapport aux aéronefs <strong>de</strong> capacitésupérieure. La croissance au même rythme dutonnage atterri-décollé et du trafic passagersindique un maintien du taux <strong>de</strong> remplissage<strong>de</strong>s avions par rapport à 2007.TrafficThe 6.3% rise in aircraft movement, togetherwith the 4.2% rise in <strong>la</strong>n<strong>de</strong>d-taken off tonnage,bears witness to the airport’s capacity increase.The number of small-capacity aircraft (seatingun<strong>de</strong>r 100) rose more quickly than than that of<strong>la</strong>rger p<strong>la</strong>nes. Simi<strong>la</strong>r growth of <strong>la</strong>n<strong>de</strong>d-taken offtonnage and passenger traffic shows that aircraftload factor was stable compared to 2007.rapportannuel <strong>2008</strong>|5aéroport <strong>de</strong> <strong>la</strong> Réunion <strong>Ro<strong>la</strong>nd</strong> <strong>Garros</strong>
le trafic | TRAFFICEvolution générale du trafic // Overall traffic variationÉvolution du trafic passagers 2007 // 2007 passenger traffic variationrapportannuel <strong>2008</strong>|6aéroport <strong>de</strong> <strong>la</strong> Réunion <strong>Ro<strong>la</strong>nd</strong> <strong>Garros</strong>
Les passagersLe trafic passagers a progressé sur toutes les <strong>de</strong>stinations:France métropolitaine, Océan Indien et Asie(ligne Saint-Denis-Bangkok). L’augmentationdu nombre <strong>de</strong> passagers locaux (dont le point<strong>de</strong> départ ou <strong>la</strong> <strong>de</strong>stination finale du voyageest <strong>Ro<strong>la</strong>nd</strong> <strong>Garros</strong>) a atteint 4,3%alors que le trafic en transit a baissé.PassengersPassenger traffic increased in all <strong>de</strong>stinations:main <strong>la</strong>nd France, Indian Ocean and Asia(Saint-Denis - Bangkok line). The number of localpassengers (<strong>de</strong>par ting from or with a final<strong>de</strong>stination to <strong>Ro<strong>la</strong>nd</strong> <strong>Garros</strong> Airport) rose 4.3%,while transit traffic dropped.Passagers Passengers Arrivées ArrivingDéparts DepartingTotal Passagers locaux Total Local PassengersTransitsTotal Passagers Total PassengersFret aérien Air Freight débarqué Freight In(en tonnes) (tons) embarqué Freight OutTotal Fret aérien Total Air FreightFret poste Postal Freight débarqué Freight In(en tonnes) (tons) embarqué Freight OutTotal Fret poste Total Postal FreightMouvements d'avions P<strong>la</strong>ne MovementsTonnage Atterri/décollé Lan<strong>de</strong>d-Taken-off TonnageTrafic commercial // Commercial traffic2004 2005 2006 2007 <strong>2008</strong>796 403790 0021 586 40510 2531 596 65820 1848 10028 2842 9251 0964 02113 2601 650 876771 383767 1371 538 52034 7391 573 25919 9117 91027 8203 2771 2454 52212 4221 644 252653 306654 9301 308 23655 8001 364 03620 6647 75328 4173 6009814 58110 9361 592 304764 287755 7771 520 06474 7411 594 80521 0087 75528 7633 4891 1384 62710 9831 687 842797 046788 9711 586 01768 0881 654 10519 4637 41626 8793 8211 3385 15911 6781 757 920Evolution Variation2007/<strong>2008</strong>+4,3%+4,4%+4,3%-8,9%-7,4%-4,4%-6,6%+9,5%+17,6%+11,5%+6,3%+4,2%Taux moyen/an2004/<strong>2008</strong>Average Annual Rate+0,02%-0,03%-0,01%+60,5%+0,9%-0,9%-2,2%-1,3%+6,9%+5,1%+6,4%-3,1%+1,6%rapportannuel <strong>2008</strong>|7aéroport <strong>de</strong> <strong>la</strong> Réunion <strong>Ro<strong>la</strong>nd</strong> <strong>Garros</strong>
les passagers | PASSENGERSLe trafic <strong>de</strong>s passagers en transit à <strong>la</strong> Réunion s’est ralenti, repré -sentant 68 088 passagers, soit près <strong>de</strong> 7 000 <strong>de</strong> moins qu’en 2007:soit une baisse <strong>de</strong> près <strong>de</strong> 9 %.Cette baisse est principalement due au fonctionnement réduit <strong>de</strong><strong>la</strong> ligne Paris-Réunion-Tananarive <strong>de</strong> Corsairfly uniquement sur lesquatre premiers mois <strong>de</strong> l’année <strong>2008</strong> au lieu <strong>de</strong> dix mois sur 2007.Ce courant est alimenté en <strong>2008</strong> par les liaisons quotidiennesMayotte-Réunion-Paris d’Air Austral, ainsi que par <strong>la</strong> ligne bihebdomadaire Tananarive-Réunion-Bangkok et retour, assurée parAir Madagascar en partage <strong>de</strong> co<strong>de</strong> avec Air Austral.Le trafic avec <strong>la</strong> France métropolitaine est toujours prépondérantdans l’activité globale <strong>de</strong> l’aéroport. Près <strong>de</strong> 946 000 passagerslocaux ont emprunté les lignes Paris-Réunion ou Réunion-villes <strong>de</strong>province (Marseille, Lyon, Toulouse et Nantes) en <strong>2008</strong>, ce quireprésente une progression <strong>de</strong> plus <strong>de</strong> 4,1 % par rapport à 2007. Lapart re<strong>la</strong>tive <strong>de</strong> <strong>la</strong> métropole dans l’ensemble <strong>de</strong>s <strong>de</strong>stinations eststable : 60 % environ <strong>de</strong>s mouvements <strong>de</strong> passagers. Ce trafic estopéré par Air France (36,9% <strong>de</strong> parts <strong>de</strong> marché en <strong>2008</strong>), Corsairfly(32,4%) et Air Austral (30,5%).The number of passengers transiting in Reunion dropped to68,088, nearly 7,000 fewer than in 2007 (down nearly 9%).The drop was mainly due to a reduction in Corsair’Paris-Reunion-Antananarivo flights: the line was operatedonly during the first four months of the year insteadof ten months in 2007.New services opened in <strong>2008</strong>: Air Austral’s dailyMayotte-Reunion-Paris flights, and two Tananarive-Reunion-Bangkok and back weekly flights operatedby Air Madagascar in co<strong>de</strong>-sharing partnershipwith Air Austral.Main<strong>la</strong>nd France traffic was still predominant.Nearly 946,000 local passengers flew from Reunionto Paris or French provincial towns (Marseille, Lyon,Toulouse and Nantes) in <strong>2008</strong>, up more than 4.1%over 2007. Main<strong>la</strong>nd France’s re<strong>la</strong>tive share among all<strong>de</strong>stinations was stable, around 60% of passenger traffic.Flights were operated by Air France (36.9% market sharein <strong>2008</strong>), Corsairfly (32.4%) and Air Austral (30.5%).rapportannuel <strong>2008</strong>|8aéroport <strong>de</strong> <strong>la</strong> Réunion <strong>Ro<strong>la</strong>nd</strong> <strong>Garros</strong>
les passagers | PASSENGERSLe trafic intérieur Pierrefonds–<strong>Ro<strong>la</strong>nd</strong> <strong>Garros</strong> <strong>de</strong> 30014 passagersen <strong>2008</strong>, en progression <strong>de</strong> 8,6% par rapport à 2007, est exclusi -vement composé <strong>de</strong>s pré et post acheminements sur <strong>la</strong> métropoleopérés par Air Austral.Le trafic régional est réalisé essentiellement avec Maurice : 363 313passagers en <strong>2008</strong>, 23% du trafic total, soit une progression <strong>de</strong> 6,3%par rapport à l’année précé<strong>de</strong>nte. Les autres <strong>de</strong>stinations régionales(Mayotte, Madagascar, les Comores, les Seychelles et l’Afrique duSud) représentent globalement 236 000 passagers, soit 15% dutrafic total en <strong>2008</strong> et une progression <strong>de</strong> 1,6% par rapport à 2007.Avec près <strong>de</strong> 10 400 passagers, <strong>la</strong> liaison avec <strong>la</strong> Thaï<strong>la</strong>n<strong>de</strong> ouvertefin 2006 draine un trafic croissant (+19,7% par rapport à 2007).Principalement, cinq compagnies sont présentes dans le cielréunionnais. Air Austral, avec plus <strong>de</strong> 44% <strong>de</strong>s passagers locaux estle premier transporteur <strong>de</strong> l’Aéroport Réunion <strong>Ro<strong>la</strong>nd</strong> <strong>Garros</strong><strong>de</strong>vant Air France (22%), Corsairfly (19%), Air Mauritius (10%) et AirMadagascar (4%).The best part of regional traffic was to and from Mauritius:363,313 passengers in <strong>2008</strong>, 23% of overall traffic, up 6.3%over 2007. Other regional <strong>de</strong>stinations (Mayotte,Madagascar, Comoros, Seychelles and South Africa)together represented 236,000 passengers, 15% of overalltraffic, up 1.6% over 2007.The Thai<strong>la</strong>nd service opened in <strong>la</strong>te 2006, attractedan increasing number of passengers: 10,400 in <strong>2008</strong>,up 19.7% over 2007).Five airlines operated in Reunion in <strong>2008</strong>.With over 44% of local passengers, Air Austral wasReunion <strong>Ro<strong>la</strong>nd</strong> <strong>Garros</strong> Airport leading carrier, followedby Air France (22%), Corsairfly (19%), Air Mauritius (10%)and Air Madagascar (4%).rapportannuel <strong>2008</strong>|10aéroport <strong>de</strong> <strong>la</strong> Réunion <strong>Ro<strong>la</strong>nd</strong> <strong>Garros</strong>
le fret | FREIGHTÉvolution générale du trafic // Air fight variationRépartition du fret import par région <strong>de</strong> provenance// Import freight distribution by region of originRépartition du fret par compagnie // Freight distribution by airlineRépartition du fret export par région <strong>de</strong> <strong>de</strong>stination// Export freight distribution by region of originrapportannuel <strong>2008</strong>|12aéroport <strong>de</strong> <strong>la</strong> Réunion <strong>Ro<strong>la</strong>nd</strong> <strong>Garros</strong>
Les événements marquants en <strong>2008</strong>Une activité soutenue dans le domaine <strong>de</strong> <strong>la</strong> sécuritéLa CCIR, gestionnaire <strong>de</strong> l’aéroport, a obtenu en mars <strong>2008</strong> <strong>la</strong>certification <strong>de</strong> sécurité aéroportuaire. Cette certification concerne<strong>la</strong> conception, l’aménagement et l’exploitation <strong>de</strong>s infrastructures,<strong>de</strong>s équipements et <strong>de</strong>s services aéroportuaires nécessaires à <strong>la</strong>circu<strong>la</strong>tion <strong>de</strong>s aéronefs, conformément aux normes édicteés parl’OACI (Organisation <strong>de</strong> l’Aviation Civile Internationale). Ledispositif s’appuie sur le Système <strong>de</strong> Gestion <strong>de</strong> <strong>la</strong> Sécurité (SGS),ensemble structuré <strong>de</strong> moyens, <strong>de</strong> procédures et <strong>de</strong> procédés,permettant <strong>de</strong> maintenir cette certification attribuée pour <strong>de</strong>uxans et qui reste sous <strong>la</strong> surveil<strong>la</strong>nce permanente <strong>de</strong>s autorités <strong>de</strong>l’Aviation Civile, au travers d’audits annuels.Le schéma directeur opérationnel <strong>de</strong> <strong>la</strong> sécurité, qui porte plusparticulièrement sur les bâtiments <strong>de</strong> l’aéroport, a été finalisé etprésenté à <strong>la</strong> Commission <strong>de</strong> Sécurité Préfectorale en juillet et àreçu l’approbation <strong>de</strong> <strong>la</strong> Préfecture.Deux exercices <strong>de</strong> sécurité ont été organisés en cours d’année :simu<strong>la</strong>tion d’un crash aérien et évacuation <strong>de</strong> l’aérogare passagersLe premier, en février <strong>2008</strong>, a simulé le crash d’un B 737 avec 130personnes à bord sur <strong>la</strong> partie ouest <strong>de</strong>s pistes. Il s’agissait <strong>de</strong> tester<strong>la</strong> mise en œuvre du P<strong>la</strong>n <strong>de</strong> Secours Spécialisé Aérodrome (PSSA)par l’ensemble <strong>de</strong>s acteurs concernés (CCI Aéroport, BGTA,Douanes, SDIS, SAMU, Préfecture…).Le 08 avril <strong>2008</strong> un exercice d’évacuation <strong>de</strong>s niveaux 3 et 4 <strong>de</strong>l’aérogare passagers a été réalisé afin <strong>de</strong> tester l’efficacité <strong>de</strong>l’évacuation <strong>de</strong>s personnels travail<strong>la</strong>nt à ces niveaux (environ 150personnes) et <strong>la</strong> mise en œuvre <strong>de</strong>s moyens <strong>de</strong> secours <strong>de</strong>l’établissement par les équipes <strong>de</strong> sécurité.<strong>2008</strong>’s Major EventsStrong and Steady Activity in Safety and SecurityAirport managing body CCIR was granted airport safetyand security certification in March <strong>2008</strong> according to ICAO(International Civil Aviation Organisation) standards forthe <strong>de</strong>sign, <strong>de</strong>velopment and operation of airport facilities,equipment and services required for aircraft traffic.The certification is given for two years on the basis onthe Safety Management System, a structured set of means,procedures and processes, and airport safety is un<strong>de</strong>rpermanent control of Civil Aviation authoritiesthrough annual audits.The Security Operational Blueprint, which mainlyconcerns airport buildings, was finalised and submittedto the Prefecture Safety and Security Committee in July,and approved by the Prefecture.Two safety exercises were organised during the year:air crash simu<strong>la</strong>tion and passenger terminal evacuation.The first took p<strong>la</strong>ce in February <strong>2008</strong>: the crash of a B 737with 130 people on board was simu<strong>la</strong>ted on the west sectionof runways. The aim was to test the application of the PSSA(Special Airport Rescue P<strong>la</strong>n) by all relevant actors(CCIR Airport, Air Transport Police, Customs, FireDepartment, Mobile Acci<strong>de</strong>nt Unit, Prefecture, etc.).On 8 April <strong>2008</strong> a passenger terminal evacuation exercisewas carried out at Levels 3 and 4 in or<strong>de</strong>r to test evacuationefficiency for the personnel working there (some 150 people)and the application of Airport rescue meansby safety teams.rapportannuel <strong>2008</strong>|13aéroport <strong>de</strong> <strong>la</strong> Réunion <strong>Ro<strong>la</strong>nd</strong> <strong>Garros</strong>
les événements marquants en <strong>2008</strong> | <strong>2008</strong>’S MAJOR EVENTSDes missions en évolutionLa mission d’assistance aux Personnes à Mobilité Réduite (PMR) aété transférée en juillet <strong>2008</strong> au concessionnaire <strong>de</strong> l’aéroport,conformément aux directives règlementaires. Cette assistance étaitjusqu’à cette date directement prise en charge par les compagniesaériennes. La nouvelle réglementation prévoit un é<strong>la</strong>rgissement<strong>de</strong>s critères permettant aux personnes handicapées où à mobilitéréduite <strong>de</strong> bénéficier d’une prise en charge adaptée, tout au long<strong>de</strong> leur parcours dans l’aéroport.Parallèlement, d’autres missions jusqu’ici dévolues aux services <strong>de</strong>l’Aviation Civile sont appelées à être transférées vers les services dugestionnaire : fabrication <strong>de</strong>s badges d’accès à <strong>la</strong> zone réservée,fourniture <strong>de</strong> données et renseignements aéronautiques, les visites<strong>de</strong> surveil<strong>la</strong>nce <strong>de</strong>s systèmes <strong>de</strong> pistes… L’année <strong>2008</strong> a été consacréeà <strong>la</strong> préparation <strong>de</strong> ces transferts.Gestion environnementale<strong>2008</strong> a aussi été consacrée à poser <strong>de</strong>s bases <strong>de</strong> <strong>la</strong> politiqueenvironnementale <strong>de</strong> l’aéroport, notamment au travers <strong>de</strong> <strong>de</strong>uxétu<strong>de</strong>s sur <strong>la</strong> gestion globale et collective <strong>de</strong>s déchets et <strong>la</strong> maîtrise<strong>de</strong> <strong>la</strong> <strong>de</strong>man<strong>de</strong> d’énergie.New ResponsibilitiesThe responsibility for assistance to persons with reducedmobility was transferred to the Chamber of Commercein July <strong>2008</strong> in accordance with regu<strong>la</strong>tory directives.Until then this had been the responsibility of airlines.The new regu<strong>la</strong>tion provi<strong>de</strong>s for broa<strong>de</strong>r criteria allowinghandicapped persons or persons with reduced mobility tobenefit from adapted help during their passage throughoutthe airport.In addition, other functions hitherto performed bythe Civil Aviation administration were to be transferredto the Chamber of Commerce: making of badges for accessto reserved area, providing aeronautical data andinformation, runway system monitoring inspections, etc.These transfers were prepared in <strong>2008</strong>.Eco-friendly Management<strong>2008</strong> was also <strong>de</strong>voted to <strong>la</strong>ying down the bases ofthe Airport’s environmental policy, especially throughtwo studies on general and collective waste managementand reduction of energy <strong>de</strong>mand.rapportannuel <strong>2008</strong>|14aéroport <strong>de</strong> <strong>la</strong> Réunion <strong>Ro<strong>la</strong>nd</strong> <strong>Garros</strong>
les événements marquants en <strong>2008</strong> | <strong>2008</strong>’S MAJOR EVENTSLes investissements aéroportuaires4,5 millions d’euros ont été investis en <strong>2008</strong> à l’aéroport, dont1,8M€ ont été consacrés à l’achèvement <strong>de</strong>s travaux d’adaptation<strong>de</strong>s chaussées pour l’accueil <strong>de</strong> <strong>la</strong> nouvelle génération <strong>de</strong> grosporteurs (B 777-300), ainsi que <strong>la</strong> mise aux normes <strong>de</strong>s dispositifs<strong>de</strong> balisage et <strong>de</strong> signalisation sur les pistes. Globalement, cesopérations <strong>la</strong>ncées en 2006 portent sur 4,7 M€, financés enpartenariat avec l’Europe (2,3 M€) et l’Etat (800 K€).D’autres opérations ont été finalisées en <strong>2008</strong> : renouvellement <strong>de</strong>l’éc<strong>la</strong>irage du hall public et <strong>de</strong> <strong>la</strong> sonorisation (236 K€), rénovation<strong>de</strong>s bureaux opérations et locaux techniques au niveau piste(529K€), renouvellement et l’augmentation du parc <strong>de</strong> chariots àbagages (300 K€).L’année <strong>2008</strong> a aussi vu <strong>la</strong> migration matérielle et logicielle duSystème d’Information Aéroportuaire (SIA) pour 434K€.Les étu<strong>de</strong>s <strong>de</strong> conception d’un P<strong>la</strong>n <strong>de</strong> Composition Générale,é<strong>la</strong>boré avec les différents partenaires intéressés au développement<strong>de</strong> l’aéroport, ont été finalisées en <strong>2008</strong>. Sur <strong>la</strong> base d’unscénario d’évolution <strong>de</strong>s courants <strong>de</strong> trafics et <strong>de</strong>s activités aéroportuaires,le PCG prévoit les grands principes et les gran<strong>de</strong>sphases du développement <strong>de</strong>s infrastructures et <strong>de</strong>s superstructuressur l’enceinte aéroportuaire à l’horizon 2025.Airport Investments4.5 million euros were invested in the airport in <strong>2008</strong>,of which €1.8m for the upgrading of runways necessaryto accommodate new generation jumbo jets (B 777-300)as well as runway lighting and signage compliance work.Overall investment since 2006 totalled €4.7m, financedin partnership with the EU (€2.3m) and FrenchGovernment (€800K).Other operations were finalised in <strong>2008</strong>: renewal of mainconcourse lighting and PA system (€236K), upgradingof operations offices and runway level technical rooms(€529K), repair and renewal of luggage trolleys (€300K).€434K were invested for the relocation of and new softwarefor the Airport Information System.Overall Layout P<strong>la</strong>n in ProgressOverall Layout P<strong>la</strong>n <strong>de</strong>sign studies carried out with thevarious stakehol<strong>de</strong>rs involved in airport <strong>de</strong>velopment werefinalised in <strong>2008</strong>. Based on traffic trend and airport activityforecasts, the P<strong>la</strong>n provi<strong>de</strong>s for the overall principles andmajor stages in the <strong>de</strong>velopment of airport infrastructuresand superstructures in the run-up to 2030.rapportannuel <strong>2008</strong>|15aéroport <strong>de</strong> <strong>la</strong> Réunion <strong>Ro<strong>la</strong>nd</strong> <strong>Garros</strong>
Les éléments financiersLa croissance du trafic (+4,3 % pour les passagers locaux),associée à <strong>la</strong> re<strong>de</strong>vance passagers exceptionnelle perçuesur une année pleine, ont permis <strong>de</strong> consoli<strong>de</strong>rles comptes <strong>de</strong> <strong>la</strong> concession aéroportuaire à un niveaucomparable à celui <strong>de</strong> l’année passée avecun bénéfice <strong>de</strong> près <strong>de</strong> 5 305K€. Le p<strong>la</strong>n <strong>de</strong> retourà l’équilibre activé après <strong>la</strong> crise du chikungunyaen 2006 a porté ses fruits, <strong>la</strong> capacitéd’autofinancement a retrouvé un niveausatisfaisant. Les bons résultats <strong>de</strong> l’année<strong>2008</strong> ont permis à l’aéroport<strong>de</strong> rembourser <strong>la</strong> totalité <strong>de</strong> ses <strong>de</strong>ttesfiscales et sociales <strong>de</strong> manière anticipée,en avril 2009.Financial dataTraffic growth (+ 4.3% for local passengers) togetherwith the exceptional passenger tax collected overa full year contributed to consolidating the airport’saccounts to a level comparable to that of 2007,with a benefit close to €5.305m. The restructuringp<strong>la</strong>n activated after the chikungunya crisis in 2006bore fruit, cash flow returned to satisfactory leve<strong>la</strong>gain. Good <strong>2008</strong> performance ma<strong>de</strong> it possiblefor the airport to clear all its tax <strong>de</strong>bts and SocialSecurity contributions in advance in April 2009.Résultats financiers (en milliers d’euros) // Financial result (€’000)CHIFFRE D’AFFAIRE SALESCAPACITÉ D’AUTOFINANCEMENT CASH FLOWINVESTISSEMENTS INVESTMENTSREMBOURSEMENTS EMPRUNTS LOAN REPAYMENTFONDS DE ROULEMENT WORKING CAPITAL2004 2005 2006 2007 <strong>2008</strong>32 190 31 414 29 347 34 937 37 6122 939 4 462 3 755 6 232 6 2731 480530 2 229 4 344 4 5663 276 4 137 3 409 2 983 3 1703 041 2 791 3 376 9 184 12 172Evolution Variation2007/<strong>2008</strong>+ 2 675+ 41+ 222+ 187+ 2 988rapportannuel <strong>2008</strong>|16aéroport <strong>de</strong> <strong>la</strong> Réunion <strong>Ro<strong>la</strong>nd</strong> <strong>Garros</strong>
les éléments financiers | FINANCIAL DETAILSL’activités extra-aéronautiquesLe chiffre d’affaires <strong>de</strong>s activités extra-aéronautiques(30 millions d’euros) a progressé <strong>de</strong> 7,2%, enlien avec <strong>la</strong> croissance du trafic. Cette progressionconcerne les différentes activités : les commercesont un chiffre d’affaires en croissance <strong>de</strong> 5,2%, lesbars et restaurants <strong>de</strong> +1,3%, et les loueurs <strong>de</strong> voitures<strong>de</strong> +12,2%.Non air-re<strong>la</strong>ted activitiesNon air-re<strong>la</strong>ted business sales (€30 million) rose 7.2%in connection with traffic increase. All sectors benefitedfrom such increase: shop sales rose 5.2%, bars andrestaurants 1.3%, car rental companies 12.2%.Produits d’exploitation // Operating revenueCharges d’exploitation // Operating expensesrapportannuel <strong>2008</strong>|17aéroport <strong>de</strong> <strong>la</strong> Réunion <strong>Ro<strong>la</strong>nd</strong> <strong>Garros</strong>
AnnexesCommerciaux Regu<strong>la</strong>rNon Commerciaux Non regu<strong>la</strong>rDont - Cotam Government- Militaires Military- Privés Private- Aéroclubs Flying Clubs- Travail aérien P<strong>la</strong>ne and Copter Works- Autres OthersTOTAL TotalÉvolution du nombre <strong>de</strong> mouvements aériens // P<strong>la</strong>ne Movements Variation2004 2005 2006 2007 <strong>2008</strong>13 26023 346242 7653 42215 1531 8849836 60612 42225 385242 7623 93616 7391 81510934 80710 93623 924343 0823 65614 2182 75717734 86010 98324 126242 8197 34410 5713 22514335 10911 67820 878273 1809 2465 9072 4694932 556Evolution Variation2007/<strong>2008</strong>+7%-13%-21%3%+153%-58%-10%-72%-7%Taux moyen/an2004/<strong>2008</strong>Average Annual Rate-3,1%-2,8%+3,0%+3,6%+28,2%-21%+7,0%-15,9%-2,9%Évolution par compagnie du tonnage atterri et décollé (trafic commercial) // Lan<strong>de</strong>d-Taken-off Tonnage Variation by Airline (Regu<strong>la</strong>r Flights)(en Tonnes)COMPAGNIES Airlines 2004 2005 2006 2007 <strong>2008</strong>AIR AUSTRALAIR FRANCEAIR MAURITIUSCORSAIRFLYAIR BOURBONAIR MADAGASCARCARGOLUXAIR HORIZONSAXIS AIRWAYSDIVERS non réguliers Various Non Regu<strong>la</strong>rTOTAL Total525 652515 586232 576224 44495 39236 72819 0181 4801 650 876623 056485 734229 000263 29041 0326961 1602841 644 252652 736447 344218 112220 82452 0889282721 592 304677 846390 858237 000262 434119 3263781 687 842707 274409 244245 748276 210118 8446001 757 920Evolution Variation2007/<strong>2008</strong>+4,3%+4,7%+3,7%+5,2%--0,4%---+58,7%%+4,2%Taux moyen/an2004/<strong>2008</strong>Average Annual Rate+7,7%-5,6%+1,4%+5,3%-100,0%+34,1%-100,0%---20,2%+1,6%rapportannuel <strong>2008</strong>|18aéroport <strong>de</strong> <strong>la</strong> Réunion <strong>Ro<strong>la</strong>nd</strong> <strong>Garros</strong>
annexes | APPENDICESARRIVÉE ArrivingDÉPART DepartingTRANSIT (compté 1 fois) Transit counted onceTOTAL TotalTOTAL LOCAUX Total LocalRépartition du trafic arrivées - Base INSEE-CTR-IRTTouristes extérieurs External TouristsAutres OthersTouristes TouristsAutres OthersÉvolution du nombre <strong>de</strong> passagers commerciaux // Commercial Passenger Number Variation2004 2005 2006 2007 <strong>2008</strong>796 403790 00210 2531 596 6581 586 40554,0%46,0%430 000366 403771 383767 13734 7391 573 2591 538 52053,0%47,0%409 000362 383653 306654 93055 8001 364 0361 308 23642,7%57,3%278 800374 506764 287755 77774 7411 594 8051 520 06449,8%50,2%380 547383 740797 046788 97168 0881 654 1051 586 01749,7%50,3%396 400400 646Evolution Variation2007/<strong>2008</strong>+4,3%+4,4%-8,9%+3,7%+4,3%+4,2%+4,4%Taux moyen/an2004/<strong>2008</strong>Average Annual Rate+60,5%+0,9%+0,9%-2,0%+2,3%Répartition par compagnie <strong>de</strong>s passagers locaux (arrivées + départs) // Local Passenger Distribution by Airline (Arriving and Departing Passengers)COMPAGNIES Airlines 2004 2005 2006 2007 <strong>2008</strong> PARTAIR AUSTRALAIR FRANCECORSAIRAIR MAURITIUSAIR BOURBONAIR MADAGASCARAIR SEYCHELLESINTERAIRAXIS AIRWAYSAIR HORIZONSTOTAL Total588 534416 932275 860178 50880 36344 9051 239641 586 405625 145376 649307 478177 89548 116246602 0249071 538 520566 358313 239227 236147 37752 485411 5001 308 236660 772328 601300 853164 70065 085531 520 064702 642350 043307 369164 51261 369821 586 01744%22%19%10%0%4%0%0%0%0%100%Evolution Variation2007/<strong>2008</strong>+6,3%+6,5%+2,2%-0,1%--5,7%-+54,7%--+4,3%Taux moyen/an2004/<strong>2008</strong>Average Annual Rate+4,5%-4,3%+2,7%-2,0%-100,0%+8,1%-100,0%+6,4%---0,01%rapportannuel <strong>2008</strong>|19aéroport <strong>de</strong> <strong>la</strong> Réunion <strong>Ro<strong>la</strong>nd</strong> <strong>Garros</strong>
annexes | APPENDICESRépartition <strong>de</strong>s passagers locaux par région <strong>de</strong> provenance/<strong>de</strong>stination // Local Passenger Distribution by Origin/DestinationRÉGIONS DE PROVENANCEDESTINATION // Origin or Destination2004 2005 2006 2007 <strong>2008</strong> PARTEvolution Variation2007/<strong>2008</strong>Taux moyen/an2004/<strong>2008</strong>Average Annual RateLa RéunionFrance métropolitaineDont Of whichParisLyonMarseilleToulouseNantes18 962961 436887 50140 17024 9358 83023 695932 483825 83440 72144 33020 64876526 956778 394650 31546 02154 80021 5575 40027 633908 554738 04257 48360 49540 68011 85430 014945 955748 84166 54066 15849 57714 8391,9%59,6%47,2%4,2%4,2%3,1%0,94%+8,6%+4,1%+1,5%+15,8%+9,4%+21,9%+25,2%+12,2%-0,4%-4,2%+13,4%+27,6%+53,9%-Régions océan Indien,Afrique AustraleDont Of whichIle MauriceMayotteMadagascarAfrique du SudComoresIles RodriguesSeychellesAutres <strong>de</strong>stinationsChineThai<strong>la</strong>n<strong>de</strong>Autres Others603 786360 728122 81080 90818 16810 5055 5175 1502 2211 034581 988356 496111 96582 32413 2559 6294 1904 129354354500 315293 224101 83884 44811 0107 5467161 5332 5711 81169763574 073341 681113 97497 55910 3037 12903 4279 8043688 686750599 486363 313116 57897 23110 8815 656-5 82710 562-10 39616637,8%22,9%7,4%6,1%0,7%0,4%0,0%0,4%0,67%0,0%0,7%0,01%+4,4%+6,3%+2,3%-0,3%+5,6%-20,7%-+70,0%+7,7%-100,0%+19,7%-77,9%%-0,2%+0,2%-1,3%+4,7%-12,0%-14,3%-100,0%+3,1%+47,7%-36,7%ARRIVÉE ArrivingDÉPART DepartingTRANSIT (Compté 1 fois) Transit (Counted once)TOTAL Total% trafic % TrafficRépartition mensuelle du trafic passagers // Passenger Traffic Monthly Distribution<strong>2008</strong> JANVIER FÉVRIER MARS AVRIL MAI JUIN JUILLET AOÛT SEPTEMBRE OCTOBRE NOVEMBRE DÉCEMBRE TOTAL95 05780 6974 996180 75011%47 31944 3914 92198 6316%62 27165 6825 634133 5878%56 04857 3174 927118 2927%59 03464 6014 853128 4888%53 25357 0435 018115 3147%79 66785 2218 915173 80311%88 73870 6118 669165 01810%50 58351 6536 089108 3257%73 99966 9204 883145 8029%64 96062 2624 301131 5238%69 11782 5734 882156 5729%797 046788 97168 0881 654 105rapportannuel <strong>2008</strong>|20aéroport <strong>de</strong> <strong>la</strong> Réunion <strong>Ro<strong>la</strong>nd</strong> <strong>Garros</strong>
annexes | APPENDICESÉvolution du fret aérien (en tonnes) // Air Freight Variation (Tons)Fret débarqué Freight inFret embarqué Freight outTOTAL FRET Total Freight2004 2005 2006 2007 <strong>2008</strong>20 1848 10028 28419 9117 91027 82020 6647 75328 41721 0087 75528 76319 4637 41626 879Evolution Variation2007/<strong>2008</strong>-7,4%-4,4%-6,6%Taux moyen/an2004/<strong>2008</strong>Average Annual Rate-0,9%-2,2%-1,3%Répartition du fret aérien par provenance et par <strong>de</strong>stination (en tonnes) // Air Freight Distribution by Origin/Destination (Tons)COMPAGNIES Airlines 2004 2005 2006 2007 <strong>2008</strong> PARTFrance + EuropeSous-Total Sub-totalIle MauriceMauritius Is<strong>la</strong>ndSous-Total Sub-totalMadagascarSous-Total Sub-totalMayotteSous-Total Sub-totalAfrique du SudSouth AfricaSous-Total Sub-totalAutresOthersSous-Total Sub-totalImportExportImportExportImportExportImportExportImportExportImportExport14 8436 07220 9164 6485265 175113401514209607815744011429745375014 7615 77820 5394 6995335 2321162393552029661 1682422610939150015 2935 63120 9244 8134905 3042062754812961 0011 297221233335438815 0185 79820 8165 0124805 4926263149402751 0671 34239040389513313 8665 40719 2734 7395345 2734533277812711 1001 37136137984714571,2%72,9%24,3%7,2%2,3%4,4%1,4%14,8%0,2%0,0%0,5%0,6%Evolution Variation2007/<strong>2008</strong>-7,7%-6,7%-7,4%+5,5%+11,2%-4,0%-27,6%+4,3%-17,0%-1,3%+3,1%+2,2%-8,6%+73,9%-7,6%+159,4%-50,5%+9,1%Taux moyen/an2004/<strong>2008</strong>Average Annual Rate+1,7%+1,6%+1,7%+9,4%-7,5%+7,2%+49,5%-8,2%+13,5%+11,6%+31,9%+26,2%-10,3%-54,2%-13,5%-31,5%-34,8%-33,9%TotalTotalTotalImportExportFret20 1848 10028 28419 9117 91027 82020 6647 75328 41721 0087 75528 76319 4637 41626 879-7,4%-4,4%-6,6%-0,9%-2,2%-1,3%rapportannuel <strong>2008</strong>|21aéroport <strong>de</strong> <strong>la</strong> Réunion <strong>Ro<strong>la</strong>nd</strong> <strong>Garros</strong>
annexes | APPENDICESÉvolution du fret aérien par compagnie (import + export + transbor<strong>de</strong>ment) (en tonnes)// Air Freight variation by Airline (Import + Export + Transhipment) (Tons)COMPAGNIES Airlines 2004 2005 2006 2007 <strong>2008</strong> PARTAIR FRANCEAIR AUSTRALAIR MAURITIUSAIR BOURBONCORSAIRFLYCARGOLUXAIR MADAGASCARTOTAL Total12 8876 6004 7041 9511 36767310128 28413 9656 9994 7152 00513727 82014 5447 0104 6991 95520828 41713 9487 0324 7292 41963528 76312 5266 4444 6622 75848926 87946,6%24,0%17,3%0,0%10,3%0,0%1,8%Evolution Variation2007/<strong>2008</strong>-10,2%-8,4%-1,4%-+14,0%--22,9%-6,6%Taux moyen/an2004/<strong>2008</strong>Average Annual Rate-0,7%-0,6%-0,2%+19,2%+48,3%-1,3%Évolution du trafic poste (en tonnes) // Postal Freight Variation (Tons)ARRIVEE InDEPART OutTOTAL Total2004 2005 2006 2007 <strong>2008</strong>2 925 3 277 3 600 3 489 3 8211 096 1 245981 1 138 1 3384 021 4 5224 581 4 6275 159Evolution Variation2007/<strong>2008</strong>+9,5%+17,6%+11,5%Taux moyen/an2004/<strong>2008</strong>Average Annual Rate+6,9%+5,1%+6,4%rapportannuel <strong>2008</strong>|22aéroport <strong>de</strong> <strong>la</strong> Réunion <strong>Ro<strong>la</strong>nd</strong> <strong>Garros</strong>
apportannuel <strong>2008</strong>|23aéroport <strong>de</strong> <strong>la</strong> Réunion <strong>Ro<strong>la</strong>nd</strong> <strong>Garros</strong>
Concession aéroportuaire - Aéroport <strong>de</strong> <strong>la</strong> Réunion <strong>Ro<strong>la</strong>nd</strong> <strong>Garros</strong>97438 Sainte-Marie - Tél. : 0262 48 80 00 - Fax : 0262 48 80 46Airport Concession - Reunion Is<strong>la</strong>nd <strong>Ro<strong>la</strong>nd</strong> <strong>Garros</strong> Airport - 97438 Sainte-MarieTel.: +262 (0) 262 48 80 00 - Fax: +262 (0) 262 48 80 46aéroport <strong>de</strong> <strong>la</strong> Réunion <strong>Ro<strong>la</strong>nd</strong> <strong>Garros</strong> <strong>2008</strong>reunion is<strong>la</strong>nd ro<strong>la</strong>nd garros airporte-mail : arrg.dir@reunion.cci.fr - Site internet : www.reunion.aeroport.fr