Marché européen de l'oeuf - FACW
Marché européen de l'oeuf - FACW
Marché européen de l'oeuf - FACW

Create successful ePaper yourself
Turn your PDF publications into a flip-book with our unique Google optimized e-Paper software.
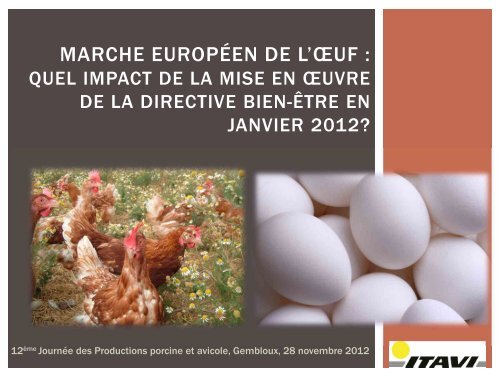
MARCHE EUROPÉEN DE L’ŒUF :QUEL IMPACT DE LA MISE EN ŒUVREDE LA DIRECTIVE BIEN-ÊTRE ENJANVIER 2012?12 ème Journée <strong>de</strong>s Productions porcine et avicole, Gembloux, 28 novembre 2012
MARCHE EUROPÉEN DE L’ŒUF ET DESOVOPRODUITS• Repères sur la production et le marché communautaire• La mise en œuvre <strong>de</strong> la Directive 99/74• Evolution <strong>de</strong>s systèmes <strong>de</strong> production• Enjeux <strong>de</strong> la réglementation• Impact sur le marché européen• Impact sur les évolutions <strong>de</strong> production• Impact sur les échanges extérieurs• Impact sur les prix• Impact sur la consommation• Perspectives et conclusions
REPÈRES SUR LA PRODUCTIONET LE MARCHÉCOMMUNAUTAIRE
PRODUCTION MONDIALE D’ŒUFSMT 2010EMA2000-2010%2011(prévision)2012(prévision)Mon<strong>de</strong> 63.6 +2.3 64.2 64.7Afrique 2.6 +3.7 2.6 2.6Amérique 12.7 +2.1 12.9 12.9Asie 37.5 +2.6 38.1 38.7Europe 10.5 +1.1 10.3 10.2Chine 23.8 +2.3 24 24.3Japon 2.5 = 2.5 2.5In<strong>de</strong> 3.4 +5.3 3.6 3.8UE-27D’après FAO, Poultry site et Commission européenne
PRODUCTION EUROPÉENNE STABLESUR 10 ANSProduction 2011(milliards d’œufs)*Evolution2011/2010Prévision 2012(milliards d’œufs)*Evolution moyenneannuelle 2002-2012France 12.9 - 9.7 % 12.2 - 2.1 %Espagne 12.4 + 2.6 % 10.6 - 2.4 %Allemagne 11.6 + 18.8 % 12.2 - 0.9 %Italie 11.2 - 2.4 % 10.8 - 1.3 %Pays-Bas 10.5 + 3.6 % 10.1 + 0.7 %Royaume-Uni 10.1 - 0.5% 10.1 - 0.9 %Pologne 9.3 = 9.3 + 2.1 %UE à 27 102.5 - 3.0 % 99.9 - 0.7* Sur la base <strong>de</strong> 16.4 œufs/kgD’après Commission européenne et SSP
L’UE-27 AUTOSUFFISANTE À 103%Teoc250 0002007 2008 2009 2010 2011216 446200 000150 000166 764 teoc187 193 teoc150 173 teoc181 916 teoc100 00050 00067%66%67%65%61%0-50 00077% 89% 93% 88% 91 %44 459 teoc22 850 teoc31 630 teoc 32 925 teoc 19 045 teocImport extra UE tot œufsexport extra UE tot œufsimport extra UE ovopexport extra UE ovop.ITAVI d’après Commission européenne
CONSOMMATION PAR HAB. DANS UE-27350300300250235 233247 242 234 222206 212 207 207182 186 188200150152 165 172147 142100500126NP NP NP87 75NP NP 39 43 26 43 40 7 NP 15 33 NP 12part <strong>de</strong>s œufs coquilles dans la consommation totale d'oeufspart <strong>de</strong>s ovoproduits dans la consommation totale d'œufs (nb œufs/hab)D’après IECconsommation moyenne d'œuf et d'ovoproduits dans l'UE 27 en 2011 (nb œufs/habitant)NP : Information relative à la consommation d'ovoproduits Non Précisée
LA MISE EN ŒUVRE DE LADIRECTIVE BIEN-ÊTREEVOLUTIONS DES SYSTÈMES DEPRODUCTION ET ENJEUX
SYSTÈMES DE PRODUCTIONUE - 27 201192 % <strong>de</strong> pon<strong>de</strong>uses en cages en 1996 (UE-15) , 65 % en 2010 (UE-27) et 55% en 2011(résultats provisoires sur 15 Etats-membres)Elaboration ITAVI d’après Commission européenne 2012
EVOLUTION DES SYSTÈMES DEPRODUCTIONSource Peter Van Horne LEI
100908070EVOLUTION DES SYSTÈMES DEPRODUCTION DANS L’UE-27% du cheptel <strong>de</strong> pon<strong>de</strong>uses élevées en cage605040302020072008200920102011100ITAVI d’après IEC
DIVERSITÉ DES MODES D’ÉLEVAGEEN 2011100%90%80%70%60%50%40%30%20%10%0%Plein air et BioSolCagesITAVI d’après IEC
LES « MINI VOLIÈRES » ALLEMANDES- 20 à 60 poules- cages + hautes- 890 cm 2 / poule- perchoirs
VOLIÈRES OU PRODUCTION AU SOL
COÛT DE PRODUCTION SELON LESYSTÈME D’ÉLEVAGEBase 100 = coût <strong>de</strong> production normes UE 2003élevage plein air (France)137gran<strong>de</strong>s volières (Pays-Bas)122"mini volières" alleman<strong>de</strong>sUE-2012 (cages aménagées 750 cm²/p)109107UE-2003 (550 cm²/p)USA 2009 (430 cm²/p)96IAbsence <strong>de</strong> réglementation Bea (300 à 400 cm²/p)9380 90 100 110 120 130 140ITAVI d’après LEI et données propres
IMPACT DE LA DIRECTIVE BIEN ÊTREPrix d’offre <strong>de</strong> la poudre d’œufentier rendu Allemagne en 2010Prix d’offre <strong>de</strong> la poudre d’œuf entierrendu Allemagne en 2012Source Peter Van Horne (LEI)
IMPACT DIRECTIVE BEA + RÉDUCTIONDROITS DE DOUANEPrix d’offre <strong>de</strong> la poudred’œuf entierrendu Allemagne en 2012avec réduction <strong>de</strong> 50% surdroits <strong>de</strong> douaneSource Peter Van Horne (LEI)
IMPACTS SUR LE MARCHÉEUROPÉEN
IMPACT SUR LES PRODUCTIONSNATIONALES1 0009008007006005004003002001000France Allemagne Italie Royaume Uni Espagne Pays Bas200720082009201020112012D’après Commission européenne
EVOLUTION DES MISES EN PLACE DANSL’UE-27EVOLUTION 2011/10 EVOLUTION 8 MOIS 2012/11Allemagne + 2.6 % + 8.6 %Pays-Bas - 10.9 % - 2.8 %Royaume-Uni - 6.0 % + 5.9 %Italie + 0.5 % - 0.6 %Espagne - 12.2 % + 8.0 %Pologne - 18.0 % + 12.7 %France - 13.5 % + 35.4 %D’après MEG et SSP
IMPACT SUR LES ÉCHANGES DE L’UE-27DOUBLEMENT DES IMPORTS EN 2012 DE 14 % DES EXPORTSD’après Commission européenne
IMPACT SUR LES PRIX DE GROS+46% SUR 44 SEMAINES 2012/11220200180€/100 kg160140120100801 3 5 7 9 11 13 15 17 19 21 23 25 27 29 31 33 35 37 39 41 43 45 47 49 51avg 2005 - 2009 2010 2011 2012D’après Commission européenne
… MAIS HAUSSE DU PRIX DES MATIÈRESPREMIÈRESEvolution <strong>de</strong> l’indice ITAVI poule pon<strong>de</strong>use ( coût MP d’une formule optimisée)220200180160140120100Base 100 janv 06Octobre 12/11 + 31%80J06A Jt O J07A Jt O J08A Jt O J09A Jt O J10A Jt O J11A Jt O J12A Jt OSource ITAVI
IMPACT SUR LA CONSOMMATION ?Segmentation du marché <strong>de</strong> l’œuf en GMS dans ≠ Etats-membres100%90%80%70%60%50%40%30%20%10%0%France Roy.Uni Allemagne Pays-Bas Danemarkcage sol plein air bioD’après panels consommateurs nationaux
BONNE TENUE DE LA CONSOMMATION ENFRANCE: + 0.8% SUR 10 PÉRIODES 2012/11BioAutres Plein airLabel rougeSolEvol prixEvol volumeCage-20 -10 0 10 20D’après Kantar World Panel
CONCLUSIONS ETPERSPECTIVES
DES PERSPECTIVES INCERTAINES• Perspectives favorables sur la consommation en raison <strong>de</strong>satouts <strong>de</strong> l’œuf (coût, nutrition, impact environnemental)• La crise économique semble renforcer ces atouts• Une part <strong>de</strong>s ovoproduits en croissance (recherche <strong>de</strong> praticité)mais un marché mature sur certains segments (IAA)• L’évolution <strong>de</strong>s systèmes d’élevage n’est pas terminée• Acceptabilité <strong>de</strong> la cage même aménagée?• Position <strong>de</strong> certains acteurs aval sera déterminante (RHD, IAA)• Compromis entre BEA (et représentation du BEA), efficacitéenvironnementale et économique• Des perspectives incertaines au plan international• Accords bilatéraux• Place du Bea dans négociations multilatérales• Vers une UE -27 importatrice d’ovoproduits?
MERCI DE VOTREATTENTIONmag<strong>de</strong>laine@itavi.asso.frMERCI DE VOTRE ATTENTION