SSL Safi 2001-2009.pdf - Ministère de l'Habitat, de l'urbanisme et de ...
SSL Safi 2001-2009.pdf - Ministère de l'Habitat, de l'urbanisme et de ...
SSL Safi 2001-2009.pdf - Ministère de l'Habitat, de l'urbanisme et de ...
- No tags were found...

Create successful ePaper yourself
Turn your PDF publications into a flip-book with our unique Google optimized e-Paper software.
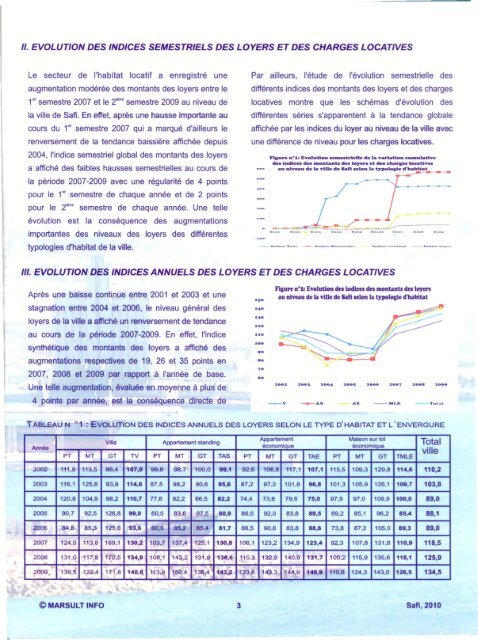
Il. EVOLUTION DES INDICES SEMESTRIELS DES LOYERS ET DES CHARGES LOCATIVESLe secteur <strong>de</strong> l'habitat locatif a enregistré uneaugmentation modérée <strong>de</strong>s montants <strong>de</strong>s loyers entre le1- semestre 2007 <strong>et</strong> le 2.....semestre 2009 au niveau <strong>de</strong>la ville <strong>de</strong> <strong>Safi</strong>. En eff<strong>et</strong>, après une hausse importante aucours du 1" semestre 2007 qui a marqué d'ailleurs lerenversement <strong>de</strong> la tendance baissière affichée <strong>de</strong>puis2004, l'indice semestriel global <strong>de</strong>s montants <strong>de</strong>s loyersa affiché <strong>de</strong>s faibles hausses semestrielles au cours <strong>de</strong>la pério<strong>de</strong> 2007-2009 avec une régularité <strong>de</strong> 4 pointspour le 1- semestre <strong>de</strong> chaque année <strong>et</strong> <strong>de</strong> 2 pointspour le 2..... semestre <strong>de</strong> chaque année. Une telleévolution est la conséquence <strong>de</strong>s augmentationsimportantes <strong>de</strong>s niveaux <strong>de</strong>s loyers <strong>de</strong>s différentestypologies d'habitat <strong>de</strong> la ville.Par ailleurs, l'étu<strong>de</strong> <strong>de</strong> l'évolution semestrielle <strong>de</strong>sdifférents indices <strong>de</strong>s montants <strong>de</strong>s loyers <strong>et</strong> <strong>de</strong>s chargeslocatives montre que les schémas d'évolution <strong>de</strong>sdifférentes séries s'apparentent à la tendance globaleaffichée par les indices du loyer au niveau <strong>de</strong> la ville avecune différence <strong>de</strong> niveau pour les charges locatives.FJ.cu.re D-sa Eyolutlon .eateStrleUe <strong>de</strong> la Yariadon CUlltulath-e<strong>de</strong>s lndlc:ea <strong>de</strong>s ..ontanta <strong>de</strong>s I.oyen <strong>et</strong> <strong>de</strong>s cbaraes loeatlvesau nl__ a cl. la vUl. cl. SaD selon la ~lotll. cl"ha::b_lta=t----III. EVOLUTION DES INDICES ANNUELS DES LOYERS ET DES CHARGES LOCATIVESAprès une baisse continue entre <strong>2001</strong> <strong>et</strong> 2003 <strong>et</strong> unestagnation entre 2004 <strong>et</strong> 2006, le niveau général <strong>de</strong>sloyers <strong>de</strong> la ville a affiché un renversement <strong>de</strong> tendanceau cours <strong>de</strong> la pério<strong>de</strong> 2007-2009. En eff<strong>et</strong>, l'indicesynthétique <strong>de</strong>s montants <strong>de</strong>s loyers a affiché <strong>de</strong>saugmentations respectives <strong>de</strong> 19, 26 <strong>et</strong> 35 points en2007, 2008 <strong>et</strong> 2009 par rapport à l'année <strong>de</strong> base.Une telle augmentation, évaluée en moyenne à plus <strong>de</strong>4 points par année, est la conséquence directe <strong>de</strong>·S.........8.-7.F"agure DOZ:EvolutioD <strong>de</strong>s iadices <strong>de</strong>s mODtants <strong>de</strong>s loyersau aiveau <strong>de</strong> la ville <strong>de</strong> <strong>Safi</strong> seloD la typologie d'habitat-v _AS _Ait _Mur. T.nalTABLEAU N 01 : EVOLUTION DES INDICES ANNUELS DES LOYERS SELON LE TYPE D'HABITAT ET L'ENVERGUREArlnéeAppartement Maison sur lotVilla Appartement standingéconomiqueéconomiquePT MT GT TV PT MT GT TAS PT MT GT TAE PT MT GT TMLETotalville2002 111,9 113,5 86,4 107,0 99,8 98,7 100,0 99,1 92,6 106,8 117,1 107,1 115,5 109,3 129,8 114,6 110,22003 116,1 125,8 93,9 114,6 87,5 98,2 90,6 95,6 87,2 97,2 101,6 96,8 101,3 105,9 126,1 109,7 103,82004 120,8 104,9 98,2 110,7 77,6 82,2 86,5 82,2 74,4 73,6 79,6 75,0 97,9 97,0 109,9 100,0 89,02005 90,7 92,5 126,8 99,0 60,5 83,6 87,5 80,9 86,5 92,0 83,8 89,S 69,2 85,1 96,2 85,4 88,12006 84,8 85,3 125,6 93,6 80,5 85,2 85,4 81,7 86,5 90,6 83,8 88,6 73,8 87,2 105,0 89,3 89,02007 124,0 113,8 169,1 130,2 103,7 137,4 125,1 130,8 106,1 123,2 134,9 123,4 92,3 107,8 131,8 110,9 118,52008 131,~ 117,8 170,5 134,9 108,1 143,2 131,8 1311,6 115,3 132,0 140,9 131,7 100,2 115,9 135,6 118,1 125,92009 139,5 122,4 171,8 14O,tl 1-13,9 150,4 136,4 143,2 123,6 143,3 144,9 140,1 110,6 124,3 143,0 126,5 134,5© MARSULT INFO 3 <strong>Safi</strong>,2010