- Page 5 and 6:
DEMOGRAPHIC YEARBOOK1960ANNUAIRE DE
- Page 7 and 8:
-------------------------------TABL
- Page 9 and 10:
TABLE OF CONTENTS (continued) -TABL
- Page 11 and 12:
Yearbook is the central internation
- Page 13:
L'Annuaire demographique s'integre
- Page 16 and 17:
--------------------------
- Page 19 and 20:
CHAPTER 1: HOW WELL DO WE KNOW THE
- Page 21 and 22:
lation would have grown to about 20
- Page 23 and 24:
TableA. Estimated mid·1959 populat
- Page 25 and 26:
of time adjustment (types a, h and
- Page 27 and 28:
that the estimate for China (mainla
- Page 29 and 30:
Continentandcountry"7959 midyearpop
- Page 31 and 32:
CHAPTER II. TECHNICAL NOTES ON THE
- Page 33 and 34:
AREAStatistics of territorial expan
- Page 35 and 36:
tistics and, as such, must be consi
- Page 37 and 38:
Category': Highly accurate data (co
- Page 39 and 40:
dividuals or households from which
- Page 41 and 42:
as encompassing these, as well as s
- Page 43 and 44:
events. It is important, for exampl
- Page 45 and 46:
Component parts of territories, suc
- Page 47 and 48:
EUROPENorthern and WesternEurope (c
- Page 49 and 50:
day and the data are the unsmoothed
- Page 51 and 52:
dures, or from ad hoc surveys. Thei
- Page 53 and 54:
35-44 years and 45 years and over.
- Page 55 and 56:
15 years and the illiterate populat
- Page 57 and 58:
for convenience in evaluating the c
- Page 59 and 60:
Table 17Table 17 is the regular tre
- Page 61 and 62:
Rate computation: The rates in Tabl
- Page 63 and 64:
are based on the mortality rates of
- Page 65 and 66:
probablement pas 5 pour 1000 pour u
- Page 67 and 68:
des programmes antipaludiques, ains
- Page 69 and 70:
Tableau B. Population estimee au mi
- Page 71 and 72:
Le tableau E donne des indications
- Page 73 and 74:
prouvees. Cela montre bien qu'il fa
- Page 75 and 76:
Population estimeeau milieu de 7959
- Page 77 and 78:
CHAPITRE II. NOTES TECHNIQUES SUR L
- Page 79 and 80:
siden~es comme compU:tes ou exactes
- Page 81 and 82:
a l'autre. Les variations de cet or
- Page 83 and 84:
demographique de 1949-50. Cet indic
- Page 85 and 86:
Quatrieme element. Qualite de l'aju
- Page 87 and 88:
Notation a ou h : met/LOde du regis
- Page 89 and 90:
statistiques. D'apres les renseigne
- Page 91 and 92:
STATISTIQUES DES MORTS FaTALESDans
- Page 93 and 94:
Les donnees relatives a. la superfi
- Page 95 and 96:
Asie du Sud-OuestAdenArabie Saoudit
- Page 97 and 98:
Par un souci de conformite avec Ie
- Page 99 and 100:
de resultats de recensements de la
- Page 101 and 102:
Les estimations sont elles aussi af
- Page 103 and 104:
tItIOns selon la situation matrimon
- Page 105 and 106:
fournir des donnees pour Ie groupe
- Page 107 and 108:
degre de compIetude de 1'enregistre
- Page 109 and 110:
infantile. Dans certains cas, les c
- Page 111 and 112:
Comme dans les tableaux de populati
- Page 113 and 114:
Insuflisances des donnees: To.utes
- Page 115:
TABLESTABLEAUX
- Page 118 and 119:
WORLD SUMMARY1. Area, density, popu
- Page 120 and 121:
WORLD SUMMARY1. Area, density, popu
- Page 122 and 123:
WORLD SUMMARY1. Area, density, popu
- Page 124 and 125:
WORLD SUMMARY1. Area, density, popu
- Page 126 and 127:
WORLD SUMMARY1. Area, density, popu
- Page 128 and 129:
WORLD SUMMARY1. Area, density, popu
- Page 130 and 131:
WORLD SUMMARY1. Area, density, popu
- Page 132 and 133:
WORLD SUMMARY1. Area, density, popu
- Page 134 and 135:
WORLD SUMMARY1. Area, density, popu
- Page 136 and 137:
WORLD SUMMARY2. Area, density, popu
- Page 138 and 139:
WORLD SUMMARY3. Vital statistics ra
- Page 140 and 141:
WORLD SUMMARY3. Vital statistics ra
- Page 142 and 143:
POPULATION4. Estimates of midyear p
- Page 144 and 145:
POPULATION4. Estimates of midyear p
- Page 146 and 147:
POPULATION4. Estimates of midyear p
- Page 148 and 149:
POPULATION4. Estimates of midyear p
- Page 150 and 151:
POPULATION4. Estimates of midyear p
- Page 152 and 153:
POPULATION4. Estimates of midyear p
- Page 154 and 155:
POPULATION4. Estimates of midyear p
- Page 156 and 157:
POPULATION4. Estimates of midyear p
- Page 158 and 159:
POPULATION4. Estimates of midyear p
- Page 160 and 161:
POPULATION4. Estimates of midyear p
- Page 162 and 163:
POPULATION4. Estimates of midyear p
- Page 164 and 165:
POPULATION4. Estimates of midyear p
- Page 166 and 167:
POPULATION4. Estimates of midyear p
- Page 168 and 169:
POPULATION4. Estimates of midyear p
- Page 170 and 171:
POPULATION5. Population by age and
- Page 172 and 173:
POPULATION5. Population by age and
- Page 174 and 175:
POPULATION5. Population by a,ge and
- Page 176 and 177:
POPULATION5. Population by a,ge and
- Page 178 and 179:
POPULATION5. Population by age and
- Page 180 and 181:
POPULATION5. Population by age and
- Page 182 and 183:
POPULATION5. Population by age and
- Page 184 and 185:
POPULATION5. Population by age and
- Page 186 and 187:
POPULATION5. Population by age and
- Page 188 and 189:
POPULATION5. Population by a,ge and
- Page 190 and 191:
POPULATION5. Population by age and
- Page 192 and 193:
POPULATION5. Population by a,ge and
- Page 194 and 195:
POPULATION5. Population by age and
- Page 196 and 197:
POPULATION5. Population by age and
- Page 198 and 199:
POPULATION5. Population by age and
- Page 200 and 201:
POPULATION5. Population by age and
- Page 202 and 203:
POPULATION5. Population by age and
- Page 204 and 205:
POPULATION5. Population by age and
- Page 206 and 207:
POPULATION5. Population by age and
- Page 208 and 209:
POPULATION5. Population by age and
- Page 210 and 211:
~POPULATION5. Population by age and
- Page 212 and 213:
POPULATION5. Population by age and
- Page 214 and 215:
POPULATION5. Population by a.ge and
- Page 216 and 217:
POPULATION5. Population by a,ge and
- Page 218 and 219:
POPULATION5. Population by age and
- Page 220 and 221:
POPULATION5. Population by age and
- Page 222 and 223:
POPULATION5. Population by a,ge and
- Page 224 and 225:
POPULATION5. Population by a.ge and
- Page 226 and 227:
POPULATION5. Population by age and
- Page 228 and 229:
POPULATION5. Population by age and
- Page 230 and 231:
POPULATION5. Population by age and
- Page 232 and 233:
POPULATION5. Population by age and
- Page 234 and 235:
POPULATION5. Population by age and
- Page 236 and 237:
P'OPULATlON5. Population by a,ge an
- Page 238 and 239:
POPULATION5. Population by age and
- Page 240 and 241:
POPULATION5. Population by a,ge and
- Page 242 and 243:
POPULATION5. Population by age and
- Page 244 and 245:
POPULATION5. Population by a,ge and
- Page 246 and 247:
POPULATION5. Population by a,ge and
- Page 248 and 249:
POPULATION5. Population by age and
- Page 250 and 251:
POPULATION5. Population by age and
- Page 252 and 253:
POPULATION5. Population by age and
- Page 254 and 255:
POPULATION5. Population by age and
- Page 256 and 257:
-- -------------------------POPULAT
- Page 258 and 259:
POPULATION5. Population by age and
- Page 260 and 261:
POPULATION5. Population by age and
- Page 262 and 263:
POPULATION5. Population by age and
- Page 264 and 265:
POPULATION5. Population by age and
- Page 266 and 267:
POPULATION5. Population by age and
- Page 268 and 269:
POPULATION5. Population by age and
- Page 270 and 271:
POPULATION5. Population by age and
- Page 272 and 273:
POPULATION5. Population by age and
- Page 274 and 275:
POPULATION5. Population by age and
- Page 276 and 277:
POPULATION5. Population by age and
- Page 278 and 279:
POPULATION5. Population by age and
- Page 280 and 281:
POPULATION6. Enumerated population
- Page 282 and 283:
POPULATION6. Enumerated population
- Page 284 and 285:
POPULATION6. Enumerated population
- Page 286 and 287:
POPULATION6. Enumerated population
- Page 288 and 289:
POPULATION6. Enumerated population
- Page 290 and 291:
POPULATION6. Enumerated population
- Page 292 and 293:
POPULATION6. Enumerated population
- Page 294 and 295:
POPULATION6. Enumerated population
- Page 296 and 297:
POPULATION6. Enumerated population
- Page 298 and 299:
POPULATION6. Enumerated population
- Page 300 and 301:
POPULATION6. Enumerated population
- Page 302 and 303:
POPULATION6. Enumerated population
- Page 304 and 305:
POPULATION7. Population of capital
- Page 306 and 307:
POPULATION7. Population of capital
- Page 308 and 309:
POPULATION7. Population of capital
- Page 310 and 311:
POPULATION7. Population of capital
- Page 312 and 313:
POPULATION7. Population of capital
- Page 314 and 315:
POPULATION7. Population of capital
- Page 316 and 317:
POPULATION7. Population of capital
- Page 318 and 319:
POPULATION7. Population of capital
- Page 320 and 321:
POPULATION7. Population of capital
- Page 322 and 323:
POPULATION7. Population of capital
- Page 324 and 325:
POPULATION7. Population of capital
- Page 326 and 327:
POPULATION7. Population of capital
- Page 328 and 329:
POPULATION7. Population of capital
- Page 330 and 331:
POPULATION7. Population of capital
- Page 332 and 333:
POPULATION7. Population of capital
- Page 334 and 335:
POPULATION7. Population of capital
- Page 336 and 337:
POPULATION7. Population of capital
- Page 338 and 339:
POPULATION7. Population of capital
- Page 340 and 341:
POPULATION7. Population of capital
- Page 342 and 343:
POPULATION7. Population of capital
- Page 344 and 345:
POPULATION7. Population of capital
- Page 346 and 347:
POPULATION7. Population of capital
- Page 348 and 349:
POPULATION7. Population of capital
- Page 350 and 351:
POPULATION7. Population of capital
- Page 352 and 353:
POPULATION7. Population of capital
- Page 354 and 355:
POPULATION7. Population of capital
- Page 356 and 357:
POPULATION7. Population of capital
- Page 358 and 359:
POPULATION7. Population of capital
- Page 360 and 361:
POPULATION7. Population of capital
- Page 362 and 363:
POPULATION7. Population of capital
- Page 364 and 365:
POPULATION7. Population of capital
- Page 366 and 367:
POPULATION7. Pop'ulation of capital
- Page 368 and 369:
POPULATION8. Population in localiti
- Page 370 and 371:
POPULATION8. Population in localiti
- Page 372 and 373:
POPULATION8. Population in localiti
- Page 374 and 375:
POPULATION8. Population in localiti
- Page 376 and 377:
POPULATION8. Population in localiti
- Page 378 and 379:
POPULATION8. Population in localiti
- Page 380 and 381:
POPULATION8. Population in localiti
- Page 382 and 383:
POPULATION8. Population in localiti
- Page 384 and 385:
POPULATION8. Population in localiti
- Page 386 and 387:
POPULATION8. Population in localiti
- Page 388 and 389:
POPULATION8. Population in localiti
- Page 391 and 392:
9. Urban and total population by se
- Page 393 and 394:
9. Urban and total population by se
- Page 395 and 396:
9. Urban and total population by se
- Page 397 and 398:
9. Urban and total population by se
- Page 399 and 400:
9. Urban and total population by se
- Page 401 and 402:
9. Urban and total population by se
- Page 403 and 404:
POPULATION9. Urban and total popula
- Page 405 and 406:
9. Urban and total population by se
- Page 407 and 408:
9. Urban and total population by se
- Page 409 and 410:
9. Urban and total population by se
- Page 411 and 412:
9. Urban and total population by se
- Page 413 and 414:
9. Urban and total population by se
- Page 415 and 416:
Central African Republic 5_Republlq
- Page 417 and 418:
Libya 20 - Libye 20Male - Masculln3
- Page 419 and 420:
Rhodesia and Nyasaland, Fed.of - Rh
- Page 421 and 422:
TanganyikaNon-Afrrean populollon 42
- Page 423 and 424:
Canada 52Male - Mastulin1 VI 1931.
- Page 425 and 426:
Female - Femlnln1 VII 1954 1•81 .
- Page 427 and 428:
Female - Ferninin9 IV 1946 25 .....
- Page 429 and 430: Femole - F6minin4 I 1943 ..........
- Page 431 and 432: Paraguay 94Male - Masculin28 X1950
- Page 433 and 434: 1Cyprus 106 _ Chypre106itt. Mule -
- Page 435 and 436: Female - Flimlnin28 V1952 - 28 V195
- Page 437 and 438: Female - Feminin23 V 1947 .........
- Page 439 and 440: 22 Y1947 25 •••••••
- Page 441 and 442: 31 VIII 1950 .• , ..............
- Page 443 and 444: Female - Ferninin19 X1941 .........
- Page 445 and 446: female - Feminln31 XII 1930 25 •
- Page 447 and 448: 1 VII 1957 tE) ............... 2 84
- Page 449 and 450: Christmas Island [Aust.adm.] 156-Ue
- Page 451 and 452: Indigenous populatlon-Population In
- Page 453 and 454: 11. Illiterate and total population
- Page 455 and 456: ----~----11. Illiterate and total p
- Page 457 and 458: 11. Illiterate and total population
- Page 459 and 460: POPULATION11. Illiterate and totaI
- Page 461 and 462: 11. Illiterate and total population
- Page 463 and 464: -------------------~-_._-----------
- Page 465 and 466: 11. Illiterate and total population
- Page 467 and 468: 11. Illiterate and total population
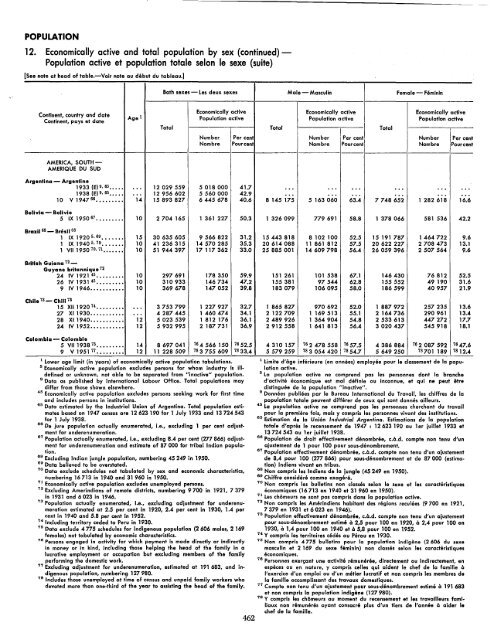
- Page 469 and 470: 12. Economically active and total p
- Page 471 and 472: 12. Economically active and total p
- Page 473 and 474: 12. Economically active and total p
- Page 475 and 476: POPULATION12. Economically active a
- Page 477 and 478: 12. Economically active and total p
- Page 479: 12. Economically active and total p
- Page 483 and 484: --~-_._---~----------------.,----12
- Page 485 and 486: 12. Economically active and total p
- Page 487 and 488: 12. Economically active and total p
- Page 489 and 490: 12. Economically active and total p
- Page 491 and 492: 12. Economically active and total p
- Page 493 and 494: 12. Economically active and total p
- Page 495 and 496: 13. Naissances vivantes et taux bru
- Page 497 and 498: ----~~--13. Naissances vivantes et
- Page 499 and 500: 13. Naissances vivantes et taux bru
- Page 501 and 502: NAISSANCES13. Naissances vivantes e
- Page 503 and 504: 13. Naissances vivantes et taux bru
- Page 505 and 506: 13. Naissances vivantes et taux bru
- Page 507 and 508: 13. Naissances vivantes et taux bru
- Page 509 and 510: 14. Live births by age of mother (c
- Page 511 and 512: 14. live births by age of mother (c
- Page 513 and 514: 14. Live births by age of mother (c
- Page 515 and 516: 14. Live births by age of mother (c
- Page 517 and 518: 15. Deces et taux bruts de mortalit
- Page 519 and 520: 15. Deces et taux bruts de mortalit
- Page 521 and 522: 15. Daces et taux bruts de mortalit
- Page 523 and 524: DECES15. Deces et taux bruts de mor
- Page 525 and 526: 15. Deces et taux bruts de mortalit
- Page 527 and 528: ~~.-15. Deces et taux bruts de mort
- Page 529 and 530: 15. Deces et taux bruts de mortalit
- Page 531 and 532:
16. Deces d'enfants de moins d'un a
- Page 533 and 534:
16. Deces d/enfants de moins d'un a
- Page 535 and 536:
--~---_.16. Daces d'enfants de moin
- Page 537 and 538:
16. Deces d/enfants de moins dlun a
- Page 539 and 540:
16. Daces d/enfants de moins d'un a
- Page 541 and 542:
17. Morts foetales tardives et rapp
- Page 543 and 544:
MORTS FOETALES17. Morts foetales ta
- Page 545 and 546:
17. Morts foetales tardives et rapp
- Page 547 and 548:
MORTS FOETALES17. Morts foetales ta
- Page 549 and 550:
18. Daces selon I'age et Ie sexe de
- Page 551 and 552:
18. Deces selen I'age et Ie sexe (s
- Page 553 and 554:
18. Daces selon I'ege et Ie sexe (s
- Page 555 and 556:
18. Deces selon !'age et Ie sexe (s
- Page 557 and 558:
18. Daces selon "age et Ie sexe (su
- Page 559 and 560:
18. Daces selon l'ege et Ie sexe (s
- Page 561 and 562:
18. Deces selon I'age et Ie sexe (s
- Page 563 and 564:
18. Deces selon liege et Ie sexe (s
- Page 565 and 566:
18. Deces selon I'age et Ie sexe (s
- Page 567 and 568:
18. Deces selon I'age et Ie sexe (s
- Page 569 and 570:
DECES18. Daces selon I'age et Ie se
- Page 571 and 572:
19. Deces selon la cause, nombres e
- Page 573 and 574:
19. Daces selon la cause, nombres e
- Page 575 and 576:
19. Daces selon la cause, nombres e
- Page 577 and 578:
19. Decas selon la cause, nombres e
- Page 579 and 580:
19. Daces selon la cause, nombres e
- Page 581 and 582:
19. Deces selon la cause, nombres e
- Page 583 and 584:
19. Oeces selon la cause, nombres e
- Page 585 and 586:
19. Deces selon la cause, nombres e
- Page 587 and 588:
19. Deces selon 10 cause, nombres e
- Page 589 and 590:
MARIAGES20. Mariages et taux bruts
- Page 591 and 592:
MARIAGES20. Mariages et taux bruts
- Page 593 and 594:
20. Mariages et taux bruts de nupti
- Page 595 and 596:
MARIAGES20. Mariages et taux bruts
- Page 597 and 598:
20. Mariages et taux bruts de nupti
- Page 599 and 600:
MARIAGES21. Mariages selon I'age de
- Page 601 and 602:
21. Mariages selon I'age de I'epous
- Page 603 and 604:
----_21. Mariages selon I'age de I'
- Page 605 and 606:
21. Mariages selon I'age de I'epous
- Page 607 and 608:
---~-----_.21. Mariages selon I'age
- Page 609 and 610:
21. Mariages selon I'oge de I'epous
- Page 611 and 612:
21. Mariages selon I'age de I'epous
- Page 613 and 614:
DIVORCES22. Divorces, nombre et tau
- Page 615 and 616:
22. Divorces, nombre et taux bruts
- Page 617 and 618:
22. Divorces, nombre et taux bruts
- Page 619 and 620:
22. Divorces, nombre et taux bruts
- Page 621 and 622:
23. Esperance de vie a differents a
- Page 623 and 624:
23. Esperance de vie (suite)TABLES
- Page 625 and 626:
23. Esperance de vie (suite)[Voir n
- Page 627 and 628:
23. Esperance de vie (suite)TABLES
- Page 629 and 630:
Index Cumulatif des Matieres:Objet
- Page 631 and 632:
1959Index cumulatif des matieres (s
- Page 633 and 634:
INDEXIndex cumulatif des matieres (
- Page 635 and 636:
Index cumulatif des matiE~res (suit
- Page 637 and 638:
Index cumulatif des matieres (suite
- Page 639 and 640:
Index cumulatif des matieres (suite
- Page 641 and 642:
PUBLICATIONS OF THE WORLD HEALTH OR
- Page 643:
DISTRIBUTORS FOR UNITED NATIONS PUB