Statistiques Construction OA - Année 1992 - PLATEFORME ...
Statistiques Construction OA - Année 1992 - PLATEFORME ...
Statistiques Construction OA - Année 1992 - PLATEFORME ...

You also want an ePaper? Increase the reach of your titles
YUMPU automatically turns print PDFs into web optimized ePapers that Google loves.
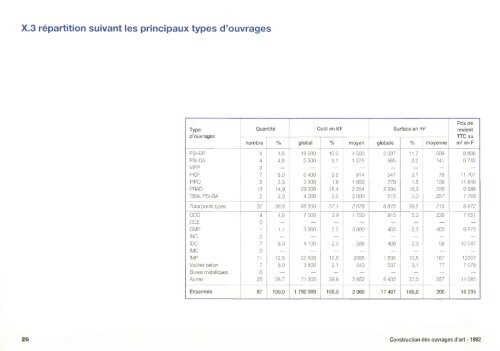
X.3 répartition suivant les principaux types d'ouvragesTyped'ouvragesnombreQuantité%globalCoût en KF%moyenglobaleSurface en m^%moyennePrix derevientTTC aum^en FPSI-DPPSI-DAVIPPPICFPIPOPRADTIBA, PSI-BA440721324,64,68,02,314,92,318 0005 5006 4003 30029 3004 00010,03,13,61,816,42,24 5001 3759141 6502 2542 0002 0375655472792 93451511,73,23,11,616,93,0509141781392262578 8369 74311 70711 8499 9887 769Total ponts typesCDCCCECMPINCIDCIMCIMPVoûtes bétonBuses métalliquesAutres3240107011702536,84,6—1,18,012,68,0—28,766 5007 000—3 9004 10022 6003 800—71 30037,73,9—2,22,312,62,1—39,82 0781 750—3 9005862055543—2 8526 875915—4034081 836537—6 43239,55,3—2,32,310,53,1—37,0215229—4035816777—2579 6727 651—9 67310 047123077 079—11 085Ensemble87100,01 792 000100,02 06017 407100,020010 29526 Conilniction dss ouvrages d'art -1982