Pays-de-la-Loire - Ordre National des Pharmaciens
Pays-de-la-Loire - Ordre National des Pharmaciens
Pays-de-la-Loire - Ordre National des Pharmaciens

Create successful ePaper yourself
Turn your PDF publications into a flip-book with our unique Google optimized e-Paper software.
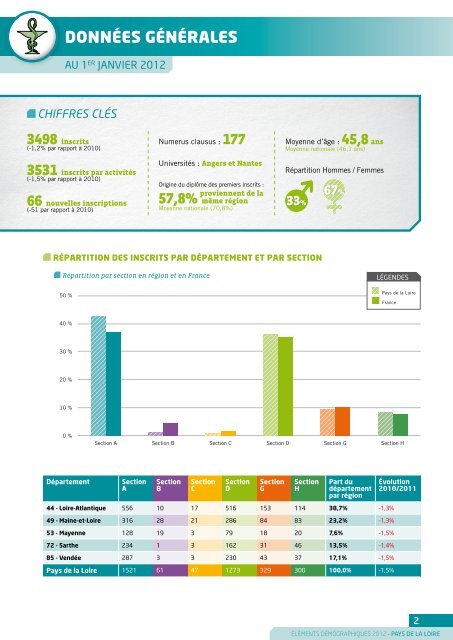
DONNÉES GÉNÉRALESAU 1 ER JANVIER 2012CHIFFRES CLÉS3498 inscrits(-1,2% par rapport à 2010)3531 inscrits par activités(-1,5% par rapport à 2010)66 nouvelles inscriptions(-51 par rapport à 2010)Numerus c<strong>la</strong>usus : 177Universités : Angers et NantesOrigine du diplôme <strong>de</strong>s premiers inscrits :proviennent <strong>de</strong> <strong>la</strong>57,8% même régionMoyenne nationale (70,8%)Moyenne d’âge : 45,8 ansMoyenne nationale (46,1 ans)Répartition Hommes / Femmes33%67%RÉPARTITION DES INSCRITS PAR DÉPARTEMENT ET PAR SECTIONRépartition par section en région et en France50 %LÉGENDES<strong>Pays</strong> <strong>de</strong> <strong>la</strong> <strong>Loire</strong>France40 %30 %20 %10 %0 %Section A Section B Section C Section D Section G Section HDépartementSectionASectionBSectionCSectionDSectionGSectionHPart dudépartementpar régionÉvolution2010/201144 - <strong>Loire</strong>-At<strong>la</strong>ntique 556 10 17 516 153 114 38,7% -1,3%49 - Maine-et-<strong>Loire</strong> 316 28 21 286 84 83 23,2% -1,3%53 - Mayenne 128 19 3 79 18 20 7,6% -1,5%72 - Sarthe 234 1 3 162 31 46 13,5% -1,4%85 - Vendée 287 3 3 230 43 37 17,1% -1,5%<strong>Pays</strong> <strong>de</strong> <strong>la</strong> <strong>Loire</strong> 1521 61 47 1273 329 300 100,0% -1,5%2ÉLÉMENTS DÉMOGRAPHIQUES 2012 - PAYS DE LA LOIRE