SE Region - TCAP Blitz - Grade 7 - Math Week 6 - April 9 â April 13
SE Region - TCAP Blitz - Grade 7 - Math Week 6 - April 9 â April 13
SE Region - TCAP Blitz - Grade 7 - Math Week 6 - April 9 â April 13
- No tags were found...

You also want an ePaper? Increase the reach of your titles
YUMPU automatically turns print PDFs into web optimized ePapers that Google loves.
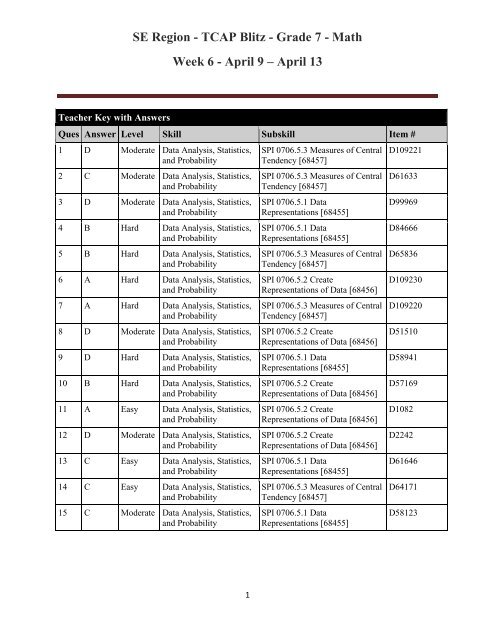
<strong>SE</strong> <strong>Region</strong> - <strong>TCAP</strong> <strong>Blitz</strong> - <strong>Grade</strong> 7 - <strong>Math</strong><strong>Week</strong> 6 - <strong>April</strong> 9 – <strong>April</strong> <strong>13</strong>Question 1 of 15Drew kept track of his bowling scores while he played on a summer league. He has organziedthe data from least to greatest:95, 95, 96, 105, 121, 123, 128, 128, <strong>13</strong>0, <strong>13</strong>2, <strong>13</strong>4, <strong>13</strong>7, <strong>13</strong>7, 140, 142, 145According to Drew's bowling scores above, what is the mean of his lower quartile?A. 95B. 96.5C. 97D. 97.75Question 2 of 15You get your report card with grades listed by each subject. What are the mean and median ofyour grades?A. 90, 88B. 88, 90C. 90, 90D. 88, 882
SectionA. Architecturepolitique etéconomiqueB. Systèmes de santéC. Au delà des soinsde santéD. Observatoire de lasantéE. Résistance, luttes etalternativesOrganisation générale de Global Health Watch 4Sujet• Le néo-libéralisme aujourd’hui• L’Europe en crise• Expériences de ‘gauche’ (focus sur l’Amérique latine)• Changements dans le Moyen Orient et le rôle de l’impérialisme• Discours sur le développement, objectifs du millénaire et discours alternatifs• La construction de systèmes de santé et la proposition de la couverture sanitaireuniverselles• Etudes de cas : construire ou détruire les systèmes de santé (focus sur le Brésil, leSalvador, la Paraguay, le Rwanda, l’Afrique du Sud, l’Iran, le Royaume-Uni et le Mexique)• Mises à jour de GHW3 (Chine et Inde)• Le secteur prive (commercial, a but lucratif, dont les assurances) et sa réglementation• Le secteur de la santé à but non lucratif (confessionnel)• La crise du personnel de santé• La re-conceptualisation des travailleurs communautaires de santé• Les dispositifs médicaux• La crise dans la santé maternelle et reproductive (focus sur l’Afrique)• Urgences et soins spécialisés : le rôle des systèmes de santé publics• Nutrition et souveraineté alimentaire• L’industrie d’extraction et la santé• L’assainissement (étude de cas de l’initiative d’UNICEF)• Approche actuelle des politiques de santé liées aux maladies non communicables (MNC)/ l’agenda des MNC dans le contexte de la gouvernance mondiale de la santé• Genre et santé (focus sur la violence)• Les socles de protection sociale• Pollution et épuisement des eaux souterraines• Les réformes de l’OMS et débats en relation• La mitigation climatique et santé• La corporisation des ONG• Les traites de commerce international, d’investissements et de propriété intellectuelle• Les groupes de consultance• Les grandes entreprises (Novartis, Coca Cola, et autres grandes compagnies alimentaires)• Philanthro-capitalisme et la Fondation Gates• L’influence des journaux spécialisés sur la santé mondiale• Le Conseil des droits de l’homme• Les crises de réfugiés et les interventions en matière de santé(focus sur UNRWA, le Liban, la Syrie et Haïti)• Impactes de la guerre contre la drogue menée par les Etats-Unis• Le ‘printemps arabe’ et le rôle du FMI dans le Moyen Orient : impactes sur la santé• Essais cliniques dans les pays en développement• Coopération sud-sud – BRICS/IBSA• La crise et les réponses en Grèce• La Campagne pour le Droit à l’alimentation en Inde• ‘Vivre bien’ (focus sur la Bolivie)• Occupation et santé (étude de cas de la Palestine)• Luttes pour la santé dans le Moyen Orient• Accès à la santé pour le changement social (focus sur le Venezuela, la Bolivie, leSalvador, et l’Equateur)• Résistances contre les reformes néo-libérales• L’érosion de la sécurité sociale et luttes dans le ‘Nord’ (focus sur l’Espagne, l’Allemagne,et d’autres pays d’Europe)• Systèmes traditionnels / inter culturalité contre hégémonique
<strong>SE</strong> <strong>Region</strong> - <strong>TCAP</strong> <strong>Blitz</strong> - <strong>Grade</strong> 7 - <strong>Math</strong><strong>Week</strong> 6 - <strong>April</strong> 9 – <strong>April</strong> <strong>13</strong>Question 4 of 15The 7th grade class took a survey of the students in grades 9-12 that have cats, dogs, or birds.The results were recorded in the circle graph.Which one of the following statements are true?A. the number of cats if twice the number of dogsB. the number of cats and dogs is three times the number of birdsC. the number of birds if more than the number of dogsD. the number of birds and dogs is less than the number of catsQuestion 5 of 15Mrs. Smith's last set of test grades were as follows:84, 36, 68, 73, 91, 93, 104, 53, 87, 91What is the mean of this set of data?A. 76.5 C. 79B. 78 D. 81.54
<strong>SE</strong> <strong>Region</strong> - <strong>TCAP</strong> <strong>Blitz</strong> - <strong>Grade</strong> 7 - <strong>Math</strong><strong>Week</strong> 6 - <strong>April</strong> 9 – <strong>April</strong> <strong>13</strong>Question 6 of 15Which Box-and-Whisker plot below correctly represents the following data?17, 26, 29, 30, 32, 37, 42, 36, and 35A.B.C.D.Question 7 of 15Mrs. Peterson listed her students' grades from the final exam in order from least to greatest:65, 70, 76, 76, 76, 77, 80, 80, 80, 81, 81, 82, 84, 85, 88, 89, 89, 89, 89, 92According to the grades recorded by Mrs. Peterson above, what is the interquartile range?A. 12B. <strong>13</strong>C. 27D. 815
<strong>SE</strong> <strong>Region</strong> - <strong>TCAP</strong> <strong>Blitz</strong> - <strong>Grade</strong> 7 - <strong>Math</strong><strong>Week</strong> 6 - <strong>April</strong> 9 – <strong>April</strong> <strong>13</strong>Question 8 of 15The graph shows results of a survey of 150 Central Middle School students concerning howmuch they make doing odd jobs during the summer. Does this show a good representation ofhow much most middle school students make?A. No, because they did not include the fifth graders coming up from elementaryschool.B. Yes, because those are things that other students do during the summer.C. Yes, because Central Middle School is probably like every other middle school.D. No, because it is only includes one school.6
<strong>SE</strong> <strong>Region</strong> - <strong>TCAP</strong> <strong>Blitz</strong> - <strong>Grade</strong> 7 - <strong>Math</strong><strong>Week</strong> 6 - <strong>April</strong> 9 – <strong>April</strong> <strong>13</strong>Question 9 of 15Use the pie chart to determine how many of the 720 Lakeview High students choose pizza orspaghetti for lunch.A. 274 studentsB. 123 studentsC. 360 studentsD. 396 students7
<strong>SE</strong> <strong>Region</strong> - <strong>TCAP</strong> <strong>Blitz</strong> - <strong>Grade</strong> 7 - <strong>Math</strong><strong>Week</strong> 6 - <strong>April</strong> 9 – <strong>April</strong> <strong>13</strong>Question 10 of 15Jose graphed the table of information into a bar graph.What is misleading about the graph?A. Nothing is wrong with the graph.B. Andy's rent appears to be 4 times Marie's because the scale doesn't start at zero.C. There are too many bars to make a good graph.D. This comparison should be done in a circle graph rather than a bar graph.8
<strong>SE</strong> <strong>Region</strong> - <strong>TCAP</strong> <strong>Blitz</strong> - <strong>Grade</strong> 7 - <strong>Math</strong><strong>Week</strong> 6 - <strong>April</strong> 9 – <strong>April</strong> <strong>13</strong>Question 11 of 15Ms. Rubeling took a poll of her students to find out which season is the favorite of the majorityof her class. Which graph would best display this data?A. circle graphB. line graphC. bar graphD. line plotQuestion 12 of 15A coach wants to study the number of successful freethrows made in the last basketball gameby the team. Which of the following graphs would best demostrate to the team the concept ofabove average scoring by individual team members and their percentage of total pointscontribution?A. a bar graph, let x=team member, y=points scoredB. a histogram, let x=team member, y=points scoredC. a pictograph, let each symbol on the pictograph equal 10 points scoredD. a pie chart, let each slice represent each member of the team who scored9
<strong>SE</strong> <strong>Region</strong> - <strong>TCAP</strong> <strong>Blitz</strong> - <strong>Grade</strong> 7 - <strong>Math</strong><strong>Week</strong> 6 - <strong>April</strong> 9 – <strong>April</strong> <strong>13</strong>Question <strong>13</strong> of 15Xavier has the following grades in spelling class.Which of the following answers contains all of his spelling grades?A. 100, 92, 95, 97, 70, 78B. 100, 92, 95, 97, 80, 70, 78C. 100, 100, 100, 92, 95, 97, 70, 78D. 1,000, 9,257, 8, 708Question 14 of 15What is the median in the set of numbers below?{-8, -8, -4, 0, 2}A. -8B. -6C. -4D. -3.610
<strong>SE</strong> <strong>Region</strong> - <strong>TCAP</strong> <strong>Blitz</strong> - <strong>Grade</strong> 7 - <strong>Math</strong><strong>Week</strong> 6 - <strong>April</strong> 9 – <strong>April</strong> <strong>13</strong>Question 15 of 15If your school of 300 were surveyed, using the chart, about how many would choose yellow astheir favorite color?A. 160B. 70C. 55D. 3011