votreguidechiffres clésEn application du règlement européen 1606/2002 du 19 juillet 2002 sur les normes internationales,les comptes consolidés du groupe Casino au titre de l’exercice clos le 31 décembre 2006 ont étéétablis conformément à l’ensemble des normes comptables internationales IAS/IFRS applicablesà cette date et telles qu’approuvées par l’Union européenne à la date d’arrêté des comptes.ACTIVITÉS POURSUIVIES*Variation 2006/2005à taux de changeen millions d’euros 2005 2006 en euros constantsVolume d’affaires commercial HT (1) 33 612 35 064 4,3 % 4,1%Chiffre d’affaires 20 390 22 505 10,4 % 10,3 %EBITDA (2) 1 424 1 560 9,6 % 9,2 %Résultat opérationnel courant 967 1 043 7,9 % 7,5 %Résultat net des activités poursuivies, part du Groupe 324 436 34,6 %Résultat net des activités abandonnées, part du Groupe 20 163Résultat net, part du Groupe 344 600 74,4 %(1) Le volume d’affaires commercial HT totalise le chiffre d’affaires, pris à 100%, des sociétés qui entrent dans le périmètre de consolidation du Groupe dont, notamment,l’activité des sociétés mises en équivalence. Il intègre également le chiffre d’affaires réalisé sous enseigne par l’activité franchise.(2) EBITDA = résultat opérationnel courant + dotations aux amortissements opérationnels courants.* En accord avec IFRS 5, les activités polonaises et américaines ont été comptabilisées en activités abandonnées et les comptes 2005 ajustés en conséquence.Nombre moyen pondéré d’actions sur l’exercice(après dilution) 109 301 637 111 639 249actions ordinaires (AO) 94 177 792 96 515 404actions à dividende prioritaire sans droit de vote (ADP) 15 123 845 15 123 8452005 2006 Variation 2006/2005Résultat net par action des activités poursuivies,part du groupe – dilué (euros)actions ordinaires (AO) 2,69 3,64 35,3 %actions à dividende prioritaire sans droit de vote (ADP) 2,73 3,68 34,8 %Résultat net, part du groupe par action – dilué (euros)actions ordinaires (AO) 2,87 5,10 77,7 %actions à dividende prioritaire sans droit de vote (ADP) 2,91 5,14 76,6 %Dividende net par action (euros)actions ordinaires (AO) 2,08 2,15 3,4 %actions à dividende prioritaire sans droit de vote (ADP) 2,12 2,19 3,3 %
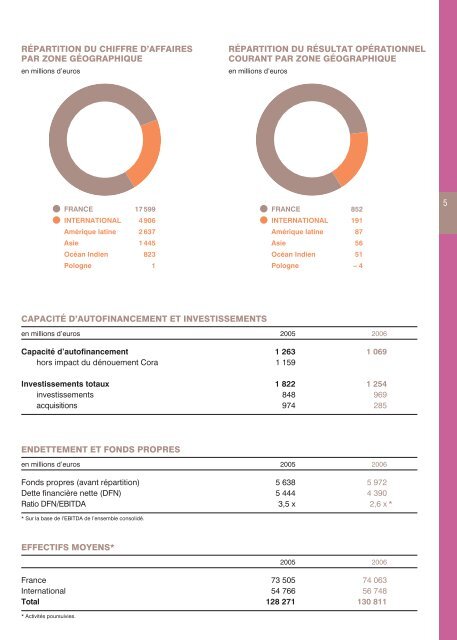
RÉPARTITION <strong>DU</strong> CHIFFRE D’AFFAIRESPAR ZONE GÉOGRAPHIQUEen millions d’eurosRÉPARTITION <strong>DU</strong> RÉSULTAT OPÉRATIONNELCOURANT PAR ZONE GÉOGRAPHIQUEen millions d’euros•FRANCE 17599INTERNATIONAL 4906Amérique latine 2637Asie 1445Océan Indien 823Pologne 1•FRANCE 852INTERNATIONAL 191Amérique latine 87Asie 56Océan Indien 51Pologne – 45CAPACITÉ D’AUTOFINANCEMENT ET INVESTISSEMENTSen millions d’euros 2005 2006Capacité d’autofinancement 1 263 1 069hors impact du dénouement Cora 1 159Investissements totaux 1 822 1 254investissements 848 969acquisitions 974 285EN<strong>DE</strong>TTEMENT ET FONDS PROPRESen millions d’euros 2005 2006Fonds propres (avant répartition) 5 638 5 972Dette financière nette (DFN) 5 444 4 390Ratio DFN/EBITDA 3,5 x 2,6 x ** Sur la base de l’EBITDA de l’ensemble consolidé.EFFECTIFS MOYENS*2005 2006France 73 505 74 063International 54 766 56 748Total 128 271 130 811* Activités poursuivies.