moda, media e quantili per tabelle di frequenza
moda, media e quantili per tabelle di frequenza
moda, media e quantili per tabelle di frequenza

Create successful ePaper yourself
Turn your PDF publications into a flip-book with our unique Google optimized e-Paper software.
CORSO DI STATISTICA (parte 1) - ESERCITAZIONE 3<br />
Dott.ssa Antonella Costanzo<br />
a.costanzo@unicas.it<br />
In<strong>di</strong>ci <strong>di</strong> posizione <strong>per</strong> caratteri quantitativi <strong>di</strong>screti e continui<br />
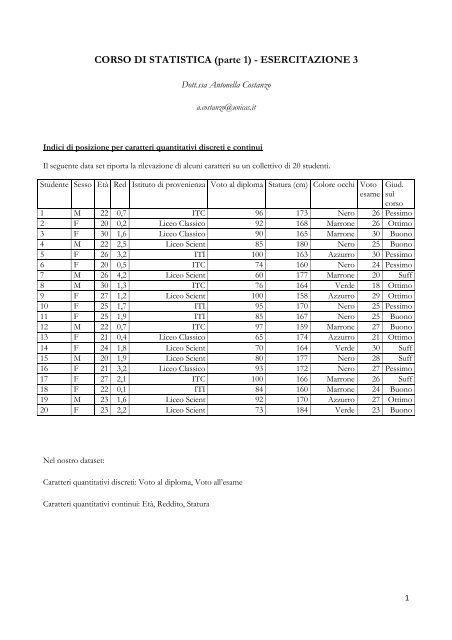
Il seguente data set riporta la rilevazione <strong>di</strong> alcuni caratteri su un collettivo <strong>di</strong> 20 studenti.<br />
Studente Sesso Età Red Istituto <strong>di</strong> provenienza Voto al <strong>di</strong>ploma Statura (cm) Colore occhi Voto<br />
esame<br />
Giud.<br />
sul<br />
corso<br />
1 M 22 0,7 ITC 96 173 Nero 26 Pessimo<br />
2 F 20 0,2 Liceo Classico 92 168 Marrone 26 Ottimo<br />
3 F 30 1,6 Liceo Classico 90 165 Marrone 30 Buono<br />
4 M 22 2,5 Liceo Scient 85 180 Nero 25 Buono<br />
5 F 26 3,2 ITI 100 163 Azzurro 30 Pessimo<br />
6 F 20 0,5 ITC 74 160 Nero 24 Pessimo<br />
7 M 26 4,2 Liceo Scient 60 177 Marrone 20 Suff<br />
8 M 30 1,3 ITC 76 164 Verde 18 Ottimo<br />
9 F 27 1,2 Liceo Scient 100 158 Azzurro 29 Ottimo<br />
10 F 25 1,7 ITI 95 170 Nero 25 Pessimo<br />
11 F 25 1,9 ITI 85 167 Nero 25 Buono<br />
12 M 22 0,7 ITC 97 159 Marrone 27 Buono<br />
13 F 21 0,4 Liceo Classico 65 174 Azzurro 21 Ottimo<br />
14 F 24 1,8 Liceo Scient 70 164 Verde 30 Suff<br />
15 M 20 1,9 Liceo Scient 80 177 Nero 28 Suff<br />
16 F 21 3,2 Liceo Classico 93 172 Nero 27 Pessimo<br />
17 F 27 2,1 ITC 100 166 Marrone 26 Suff<br />
18 F 22 0,1 ITI 84 160 Marrone 24 Buono<br />
19 M 23 1,6 Liceo Scient 92 170 Azzurro 27 Ottimo<br />
20 F 23 2,2 Liceo Scient 73 184 Verde 23 Buono<br />
Nel nostro dataset:<br />
Caratteri quantitativi <strong>di</strong>screti: Voto al <strong>di</strong>ploma, Voto all’esame<br />
Caratteri quantitativi continui: Età, Red<strong>di</strong>to, Statura<br />
1
Quesiti:<br />
1. Determinare la <strong>moda</strong>, la <strong>me<strong>di</strong>a</strong> aritmetica, la <strong>me<strong>di</strong>a</strong>na, Q1, Q3, 12-esimo <strong>per</strong>centile, 83-esimo <strong>per</strong>centile,<br />
<strong>per</strong> il carattere Voto all’esame organizzato in tabella <strong>di</strong> frequenze.<br />
2. Determinare la <strong>moda</strong>, la <strong>me<strong>di</strong>a</strong> aritmetica, la <strong>me<strong>di</strong>a</strong>na <strong>per</strong> il carattere Statura organizzato in classi<br />
equiampie (ampiezza 10).<br />
3. Costruire la <strong>di</strong>stribuzione <strong>di</strong> <strong>frequenza</strong> <strong>per</strong> la variabile Età organizzata in 4 classi. Calcolare <strong>moda</strong>, <strong>me<strong>di</strong>a</strong>,<br />
<strong>me<strong>di</strong>a</strong>na e quartili. Valutare qual è la frazione (<strong>per</strong>centuale) <strong>di</strong> studenti intervistati che hanno un età al<br />
più pari a 21. Valutare inoltre:<br />
- quanti studenti hanno un età minore <strong>di</strong> 25 oppure maggiore <strong>di</strong> 27.<br />
- la <strong>per</strong>centuale <strong>di</strong> studenti con un età compresa tra 24 e 28.<br />
Ulteriori quesiti (la cui soluzione non è stata trattata a lezione ma utili <strong>per</strong> “esercitarsi”).<br />
4. Costruire la <strong>di</strong>stribuzione <strong>di</strong> <strong>frequenza</strong> <strong>per</strong> la variabile Red<strong>di</strong>to sud<strong>di</strong>visa in classi. Calcolare <strong>moda</strong>,<br />
<strong>me<strong>di</strong>a</strong>na, Q1 e Q3. Si decide <strong>di</strong> attribuire un buono pasto agli studenti con red<strong>di</strong>to minore <strong>di</strong> 1,5.<br />
Valutare quanti studenti (qual è la frazione / qual è la <strong>per</strong>centuale <strong>di</strong> studenti) che beneficeranno del<br />
buono pasto.<br />
5. Consideriamo la situazione descritta al punto 4 e supponiamo che si decida <strong>di</strong> cambiare la soglia minima<br />
Soluzione Q.1<br />
<strong>di</strong> red<strong>di</strong>to che attribuisce il <strong>di</strong>ritto al buono pasto: la nuova soglia <strong>di</strong> red<strong>di</strong>to viene fissata a 1 (migliaia <strong>di</strong><br />
euro). Calcolare quanti studenti avranno <strong>di</strong>ritto ad ottenere il buono pasto.<br />
Voto all’esame <br />
18 1 0.05 1 0.05<br />
20 1 0.05 2 0.1<br />
21 1 0.05 3 0.15<br />
23 1 0.05 4 0.20<br />
24 2 0.1 6 0.30<br />
25 4 0.2 10 0.50<br />
26 2 0.1 12 0.60<br />
27 3 0.15 15 0.75<br />
28 1 0.05 16 0.80<br />
29 1 0.05 17 0.85<br />
30 3 0.15 20 1<br />
Totale (n) 20 1<br />
Moda: 25<br />
Primo Quartile: 24<br />
Secondo Quartile (<strong>me<strong>di</strong>a</strong>na):25<br />
Terzo Quartile: 27<br />
2
12-esimo <strong>per</strong>centile = ( ∗<br />
)= . = 21<br />
83-esimo <strong>per</strong>centile = ( ∗<br />
)= . = 29<br />
Me<strong>di</strong>a aritmetica: = ∑ <br />
∗ <br />
Soluzione Q.2<br />
= ∗∗∗⋯<br />
<br />
Distribuzione in classi <strong>per</strong> la variabile Statura<br />
= 25.5<br />
Statura (classi) = + <br />
(150, 160] 4 0.2 4 0.2<br />
() 155 10 0.4<br />
() 0.02<br />
(160, 170] 9 0.45 13 0.65 165 10 0.9 0.045<br />
(170, 180] 6 0.30 19 0.95 175 10 0.6 0.03<br />
(180, 190] 1 0.05 20 1 185 10 0.1 0.005<br />
Totale (n) 20 1<br />
Classe <strong>moda</strong>le: (160,170] essendo un carattere quantitativo continuo organizzato in classi bisogna in<strong>di</strong>viduare la<br />
<strong>moda</strong>lità a cui è associata la più alta densità <strong>di</strong> <strong>frequenza</strong> (assoluta o relativa). Nota <strong>per</strong>ò che in questo caso le<br />
classi sono equiampie e quin<strong>di</strong> è possibile far riferimento alle sole frequenze.<br />
La <strong>me<strong>di</strong>a</strong> aritmetica <strong>per</strong> la variabile Statura organizzata in classi è pari a:<br />
<br />
<br />
= ∑ ∗ <br />
<br />
= ()()⋯<br />
167 cm<br />
<br />
Me<strong>di</strong>ana: <strong>per</strong> dati quantitativi continui organizzati in classi, la determinazione della <strong>me<strong>di</strong>a</strong>na avviene nel modo<br />
seguente:<br />
1. In<strong>di</strong>viduazione della classe <strong>me<strong>di</strong>a</strong>na ( , ): in tale classe cadrà la <strong>moda</strong>lità assunta dall'unità statistica che<br />
occupa la posizione centrale della <strong>di</strong>stribuzione or<strong>di</strong>nata delle <strong>moda</strong>lità. In tal caso corrisponde a (160,170]<br />
2. Il valore che assume la <strong>me<strong>di</strong>a</strong>na nella classe in<strong>di</strong>viduata deve essere calcolato tramite l’o<strong>per</strong>azione <strong>di</strong><br />
interpolazione sulla funzione <strong>di</strong> ripartizione empirica (se si utilizzano le frequenze relative cumulate). Tale<br />
proce<strong>di</strong>mento sarà utile anche <strong>per</strong> la ricerca dei quartili. Utilizzando le frequenze cumulate relative, in generale<br />
sappiamo che il particolare quantile può essere determinato con la seguente:<br />
dove = nel nostro caso <strong>per</strong> cui = 0.5<br />
Avremo quin<strong>di</strong>:<br />
= + − ( − <br />
<br />
)<br />
<br />
3
Nota: = − <br />
= 160 +<br />
170 − 160<br />
(0.5 − 0.2) = 166.66<br />
0.45<br />
L’ espressione utilizzata <strong>per</strong> calcolare la <strong>me<strong>di</strong>a</strong>na (e in generale l’i-esimo quantile) <strong>per</strong> un carattere organizzato in<br />
classi è il risultato della seguente proporzione:<br />
<br />
<br />
?<br />
( − ): − = ( − ): − <br />
= + ( − ) − <br />
( − )<br />
Nel nostro caso avremo quin<strong>di</strong>:<br />
Soluzione Q.3<br />
F( )=0.5<br />
0<br />
− = ( − ) − <br />
( − )<br />
≡ = + − ( − <br />
<br />
)<br />
<br />
. − 0.20<br />
= = 160 + (170 − 160) = 166.66<br />
0.65 − 0.20<br />
Età (classi) () = () = <br />
(20,23] 9 0.45 9 20 0.45 21.5 3 3 0.15<br />
(23,25] 3 0.15 12 11 0.6 24 2 1.5 0.075<br />
(25,27] 6 0.30 18 8 0.90 26 2 3 0.15<br />
(27, 30] 2 0.10 20 2 1 28.5 3 0.66 0.03<br />
20 1<br />
Classe <strong>moda</strong>le: (20,23] e (25,27] <strong>di</strong>stribuzione bi<strong>moda</strong>le<br />
Me<strong>di</strong>a aritmetica: = (.∗)(∗)(∗)(.∗)<br />
=24<br />
<br />
Primo quartile ricade nella classe (20,23]<br />
<br />
<br />
4
Secondo quartile = ricade nella classe (23,25]<br />
Terzo quartile ricade nella classe (25,27]<br />
Per calcolare l’esatto valore <strong>di</strong> , Me, e si procede con l’interpolazione es. sfruttando le frequenze relative<br />
cumulate:<br />
Svolgimento:<br />
. − 0<br />
= 20 + 23 − 20 = 22<br />
0.45 − 0<br />
. − 0.45<br />
= 23 + 25 − 23 = 24<br />
0.60 − 0.45<br />
. − 0.60<br />
= 25 + 27 − 25 = 26<br />
0.90 − 0.60<br />
Nota generale. Si possono usare entrambi gli approcci descritti: applicazione della formula <strong>di</strong>retta e inversa a<br />
seconda del problema (cfr. soluzione 2) o tramite il ragionamento in proporzione sempre a seconda del<br />
problema, il risultato non cambia.<br />
Percentuale <strong>di</strong> studenti intervistati con un età al più pari a 21.<br />
In questo caso siamo interessati alla soluzione del problema inverso: conosciamo = 21 e vogliamo<br />
determinare il rango <strong>per</strong>centile associato a = 21.<br />
La formula generale è come abbiamo visto:<br />
da questa si ricava la formula inversa:<br />
= + − − <br />
<br />
<br />
<br />
= + <br />
<br />
− 5
Che corrisponde al seguente ragionamento in proporzione:<br />
<br />
<br />
<br />
− : − = − : − <br />
:<br />
− = − − <br />
− <br />
= + − − <br />
− <br />
à ù 21 è:<br />
=<br />
<br />
≡ + − <br />
− <br />
<br />
<br />
= 0 + + 0.45<br />
21 − 20 = 0.15 = 15%<br />
23 − 20<br />
Ulteriore approccio (derivato): e’ possibile ragionare in termini proporzionali <strong>di</strong>rettamente in tabella sul numero <strong>di</strong><br />
studenti che hanno un età al più pari a 21 (sfruttando le <strong>frequenza</strong> cumulate assolute associate alla classe che<br />
contiene il valore 21). E’ poi possibile risalire al valore <strong>per</strong>centuale con una semplice trasformazione del risultato.<br />
In particolare:<br />
valore noto=21 N(21)=?<br />
= 20 = 23<br />
= 0 = 9<br />
− : − = 21: 21 − <br />
9 − 0: 23 − 20 = 21: 21 − 20<br />
21 =<br />
9 ∗ 1<br />
3<br />
= 3<br />
F =?<br />
<br />
<br />
6
Solamente 3 studenti hanno un età al più pari a 21. Il corrispondente rango <strong>per</strong>centile sarà:<br />
21 ∗ 100<br />
<br />
= 3 ∗ 100<br />
20<br />
= 0.15 = 15%<br />
Numero <strong>di</strong> studenti con un età minore <strong>di</strong> 25 oppure maggiore <strong>di</strong> 27:<br />
Un modo agevole <strong>di</strong> procedere è “spezzare” il problema:<br />
1. il numero <strong>di</strong> studenti con età minore <strong>di</strong> è pari a N(25)=12 (soluzione banale)<br />
2. il numero <strong>di</strong> studenti con età maggiore <strong>di</strong> 27 è data dal complemento rispetto numero <strong>di</strong> studenti con età<br />
minore <strong>di</strong> 27. In particolare, il numero <strong>di</strong> studenti con età minore <strong>di</strong> 27 è pari a N(27)=18 (anche qui soluzione<br />
banale) <strong>per</strong> cui quelli con età maggiore <strong>di</strong> 27 sono n-N(27)=20-18=2. In realtà si può ragionare più facilmente a<br />
partire dalle frequenze assolute retro cumulate che in<strong>di</strong>cano il numero <strong>di</strong> unità che presentano un valore del<br />
carattere maggiore o uguale ad una certa <strong>moda</strong>lità RN(27)=2.<br />
Il risultato finale è dato da: N(25) +(n-N(27))= 12+2=14<br />
oppure, in maniera del tutto equivalente, utilizzando <strong>di</strong>rettamente le frequenze retro cumulate:<br />
N(25)+RN(27)=12+2=14<br />
Percentuale <strong>di</strong> studenti con età compresa tra 24 e 28<br />
Vuol <strong>di</strong>re, in termini pratici, in<strong>di</strong>viduare la <strong>per</strong>centuale <strong>di</strong> studenti con età almeno pari a 24 e non più grande <strong>di</strong><br />
28. Una possibile (e veloce) strategia in questo caso è:<br />
1. in<strong>di</strong>viduare la <strong>per</strong>centuale <strong>di</strong> studenti con età al più pari a 28.<br />
=27<br />
=0.90<br />
= 28<br />
F =?<br />
Impostando la seguente proporzione<br />
=1<br />
= 30<br />
− : − = − : − <br />
30 − 27: 28 − 27 = 1 − 0.90: 28 − 0.90<br />
7
=23<br />
e risolvendo <strong>per</strong> l’incognita 28 avremo:<br />
28 = 0.90 + ∗.<br />
<br />
= 0.933 ossia 93.3 % degli studenti con età al più pari a 28<br />
2. calcolare quin<strong>di</strong> la <strong>per</strong>centuale <strong>di</strong> soggetti con età al più pari a 24 e “sottrarre” questo valore alla <strong>per</strong>centuale<br />
complessiva <strong>di</strong> studenti con un età al più pari a 28 (in<strong>di</strong>viduata al punto 1).<br />
1. in<strong>di</strong>viduare la <strong>per</strong>centuale <strong>di</strong> studenti con età al più pari a 28.<br />
=0.45<br />
= 24<br />
F =?<br />
Impostando la seguente proporzione<br />
− : − = − : − <br />
25 − 23: 24 − 23 = 0.6 − 0.45: 24 − 0.45<br />
e risolvendo <strong>per</strong> l’incognita 24 avremo:<br />
24 = 0.45 + ∗.<br />
<br />
= 0.525 ossia 52.5 % degli studenti con età al più pari a 24<br />
A questo punto “escludo” (e quin<strong>di</strong> sottraggo) dalla <strong>per</strong>centuale complessiva <strong>di</strong> studenti con al più 28 anni la<br />
<strong>per</strong>centuale <strong>di</strong> tutti quelli che sono più piccoli <strong>di</strong> 24 anni <strong>per</strong> cui 0.933-0.525=0.408.<br />
La <strong>per</strong>centuale <strong>di</strong> studenti con un età compresa tra 24 e 28 è del 40.8%.<br />
Alternativamente (ragionamento speculare):<br />
= 25<br />
=0.6<br />
Percentuale <strong>di</strong> studenti con età maggiore <strong>di</strong> 24= 1-%studenti con età al più pari a 24=1-0.525=0.475<br />
Percentuale <strong>di</strong> studenti con età maggiore <strong>di</strong> 28=1- % studenti con età minore <strong>di</strong> 28=1-0.933=0.067<br />
Dalla proporzione totale degli studenti che hanno più <strong>di</strong> 24 anni, siccome devo includere al massimo studenti che<br />
hanno 28 anni, devo “togliere” la proporzione <strong>di</strong> studenti che hanno un età maggiore <strong>di</strong> 28 che è data dal<br />
complemento a 1 della <strong>per</strong>centuale <strong>di</strong> studenti con al massimo 28 anni. Avremo quin<strong>di</strong>: 0.475-0.067=0.408<br />
8
Soluzione Q.4<br />
Red<strong>di</strong>to (classi) <br />
[0.1, 1) 6 0.3 6 0.3 30 0.55 0.9 6.6<br />
[1,1.9) 6 0.3 12 0.6 60 1.45 0.9 6.6<br />
[1.9, 4.2] 8 0.4 20 1 100 3.05 2.3 3.48<br />
Totale (n) 20 1<br />
Classe <strong>moda</strong>le=[0.1, 1) e [1, 1.9) <strong>di</strong>stribuzione bi<strong>moda</strong>le<br />
Q1=0.85<br />
Me=Q2=1.60<br />
Q3=2.76<br />
Per verificare quanti in<strong>di</strong>vidui si trovano sotto la soglia <strong>di</strong> 1,5 (migliaia <strong>di</strong> euro) che attribuisce loro il <strong>di</strong>ritto ad<br />
ottenere un buono pasto occorre definire:<br />
1. la classe in cui rientrano tali soggetti [1, 1.9) quin<strong>di</strong> l’estremo inferiore della classe è = 1 e l’estremo<br />
su<strong>per</strong>iore è = 1.9<br />
2. il numero (totale) <strong>di</strong> soggetti con un red<strong>di</strong>to minore (o al più pari a 1.5) è pari a:<br />
in termini <strong>per</strong>centili:<br />
1.5 = + <br />
<br />
− = 6 +<br />
<br />
1.5 − 1 = 9.33 ≈ 9<br />
.<br />
1.5<br />
<br />
il 47% degli studenti avrà <strong>di</strong>ritto al buono pasto.<br />
Soluzione Q.5<br />
∗ 100 = 9.33<br />
∗ 100 = 46.65 ≈ 47° <br />
20<br />
Se la nuova soglia <strong>di</strong> red<strong>di</strong>to viene fissata a 1 (migliaia <strong>di</strong> euro) gli studenti che beneficeranno del sussi<strong>di</strong>o sono<br />
esattamente pari a 6 ovvero il 30% del totale degli studenti (soluzione banale).<br />
9