moda, media e quantili per tabelle di frequenza
moda, media e quantili per tabelle di frequenza
moda, media e quantili per tabelle di frequenza

You also want an ePaper? Increase the reach of your titles
YUMPU automatically turns print PDFs into web optimized ePapers that Google loves.
Quesiti:<br />
1. Determinare la <strong>moda</strong>, la <strong>me<strong>di</strong>a</strong> aritmetica, la <strong>me<strong>di</strong>a</strong>na, Q1, Q3, 12-esimo <strong>per</strong>centile, 83-esimo <strong>per</strong>centile,<br />
<strong>per</strong> il carattere Voto all’esame organizzato in tabella <strong>di</strong> frequenze.<br />
2. Determinare la <strong>moda</strong>, la <strong>me<strong>di</strong>a</strong> aritmetica, la <strong>me<strong>di</strong>a</strong>na <strong>per</strong> il carattere Statura organizzato in classi<br />
equiampie (ampiezza 10).<br />
3. Costruire la <strong>di</strong>stribuzione <strong>di</strong> <strong>frequenza</strong> <strong>per</strong> la variabile Età organizzata in 4 classi. Calcolare <strong>moda</strong>, <strong>me<strong>di</strong>a</strong>,<br />
<strong>me<strong>di</strong>a</strong>na e quartili. Valutare qual è la frazione (<strong>per</strong>centuale) <strong>di</strong> studenti intervistati che hanno un età al<br />
più pari a 21. Valutare inoltre:<br />
- quanti studenti hanno un età minore <strong>di</strong> 25 oppure maggiore <strong>di</strong> 27.<br />
- la <strong>per</strong>centuale <strong>di</strong> studenti con un età compresa tra 24 e 28.<br />
Ulteriori quesiti (la cui soluzione non è stata trattata a lezione ma utili <strong>per</strong> “esercitarsi”).<br />
4. Costruire la <strong>di</strong>stribuzione <strong>di</strong> <strong>frequenza</strong> <strong>per</strong> la variabile Red<strong>di</strong>to sud<strong>di</strong>visa in classi. Calcolare <strong>moda</strong>,<br />
<strong>me<strong>di</strong>a</strong>na, Q1 e Q3. Si decide <strong>di</strong> attribuire un buono pasto agli studenti con red<strong>di</strong>to minore <strong>di</strong> 1,5.<br />
Valutare quanti studenti (qual è la frazione / qual è la <strong>per</strong>centuale <strong>di</strong> studenti) che beneficeranno del<br />
buono pasto.<br />
5. Consideriamo la situazione descritta al punto 4 e supponiamo che si decida <strong>di</strong> cambiare la soglia minima<br />
Soluzione Q.1<br />
<strong>di</strong> red<strong>di</strong>to che attribuisce il <strong>di</strong>ritto al buono pasto: la nuova soglia <strong>di</strong> red<strong>di</strong>to viene fissata a 1 (migliaia <strong>di</strong><br />
euro). Calcolare quanti studenti avranno <strong>di</strong>ritto ad ottenere il buono pasto.<br />
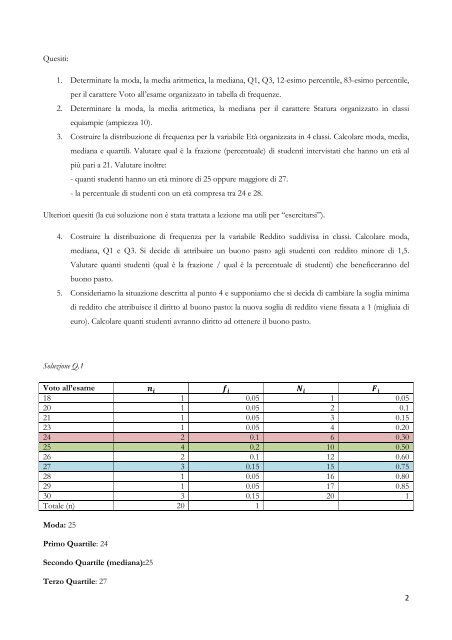
Voto all’esame <br />
18 1 0.05 1 0.05<br />
20 1 0.05 2 0.1<br />
21 1 0.05 3 0.15<br />
23 1 0.05 4 0.20<br />
24 2 0.1 6 0.30<br />
25 4 0.2 10 0.50<br />
26 2 0.1 12 0.60<br />
27 3 0.15 15 0.75<br />
28 1 0.05 16 0.80<br />
29 1 0.05 17 0.85<br />
30 3 0.15 20 1<br />
Totale (n) 20 1<br />
Moda: 25<br />
Primo Quartile: 24<br />
Secondo Quartile (<strong>me<strong>di</strong>a</strong>na):25<br />
Terzo Quartile: 27<br />
2