moda, media e quantili per tabelle di frequenza
moda, media e quantili per tabelle di frequenza
moda, media e quantili per tabelle di frequenza
You also want an ePaper? Increase the reach of your titles
YUMPU automatically turns print PDFs into web optimized ePapers that Google loves.
CORSO DI STATISTICA (parte 1) - ESERCITAZIONE 3<br />
Dott.ssa Antonella Costanzo<br />
a.costanzo@unicas.it<br />
In<strong>di</strong>ci <strong>di</strong> posizione <strong>per</strong> caratteri quantitativi <strong>di</strong>screti e continui<br />
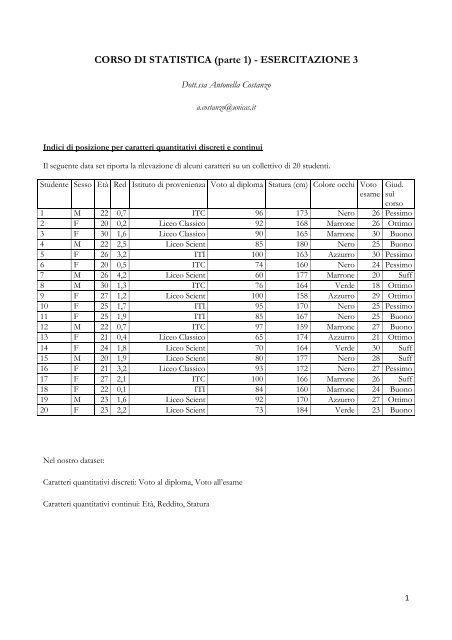
Il seguente data set riporta la rilevazione <strong>di</strong> alcuni caratteri su un collettivo <strong>di</strong> 20 studenti.<br />
Studente Sesso Età Red Istituto <strong>di</strong> provenienza Voto al <strong>di</strong>ploma Statura (cm) Colore occhi Voto<br />
esame<br />
Giud.<br />
sul<br />
corso<br />
1 M 22 0,7 ITC 96 173 Nero 26 Pessimo<br />
2 F 20 0,2 Liceo Classico 92 168 Marrone 26 Ottimo<br />
3 F 30 1,6 Liceo Classico 90 165 Marrone 30 Buono<br />
4 M 22 2,5 Liceo Scient 85 180 Nero 25 Buono<br />
5 F 26 3,2 ITI 100 163 Azzurro 30 Pessimo<br />
6 F 20 0,5 ITC 74 160 Nero 24 Pessimo<br />
7 M 26 4,2 Liceo Scient 60 177 Marrone 20 Suff<br />
8 M 30 1,3 ITC 76 164 Verde 18 Ottimo<br />
9 F 27 1,2 Liceo Scient 100 158 Azzurro 29 Ottimo<br />
10 F 25 1,7 ITI 95 170 Nero 25 Pessimo<br />
11 F 25 1,9 ITI 85 167 Nero 25 Buono<br />
12 M 22 0,7 ITC 97 159 Marrone 27 Buono<br />
13 F 21 0,4 Liceo Classico 65 174 Azzurro 21 Ottimo<br />
14 F 24 1,8 Liceo Scient 70 164 Verde 30 Suff<br />
15 M 20 1,9 Liceo Scient 80 177 Nero 28 Suff<br />
16 F 21 3,2 Liceo Classico 93 172 Nero 27 Pessimo<br />
17 F 27 2,1 ITC 100 166 Marrone 26 Suff<br />
18 F 22 0,1 ITI 84 160 Marrone 24 Buono<br />
19 M 23 1,6 Liceo Scient 92 170 Azzurro 27 Ottimo<br />
20 F 23 2,2 Liceo Scient 73 184 Verde 23 Buono<br />
Nel nostro dataset:<br />
Caratteri quantitativi <strong>di</strong>screti: Voto al <strong>di</strong>ploma, Voto all’esame<br />
Caratteri quantitativi continui: Età, Red<strong>di</strong>to, Statura<br />
1
Quesiti:<br />
1. Determinare la <strong>moda</strong>, la <strong>me<strong>di</strong>a</strong> aritmetica, la <strong>me<strong>di</strong>a</strong>na, Q1, Q3, 12-esimo <strong>per</strong>centile, 83-esimo <strong>per</strong>centile,<br />
<strong>per</strong> il carattere Voto all’esame organizzato in tabella <strong>di</strong> frequenze.<br />
2. Determinare la <strong>moda</strong>, la <strong>me<strong>di</strong>a</strong> aritmetica, la <strong>me<strong>di</strong>a</strong>na <strong>per</strong> il carattere Statura organizzato in classi<br />
equiampie (ampiezza 10).<br />
3. Costruire la <strong>di</strong>stribuzione <strong>di</strong> <strong>frequenza</strong> <strong>per</strong> la variabile Età organizzata in 4 classi. Calcolare <strong>moda</strong>, <strong>me<strong>di</strong>a</strong>,<br />
<strong>me<strong>di</strong>a</strong>na e quartili. Valutare qual è la frazione (<strong>per</strong>centuale) <strong>di</strong> studenti intervistati che hanno un età al<br />
più pari a 21. Valutare inoltre:<br />
- quanti studenti hanno un età minore <strong>di</strong> 25 oppure maggiore <strong>di</strong> 27.<br />
- la <strong>per</strong>centuale <strong>di</strong> studenti con un età compresa tra 24 e 28.<br />
Ulteriori quesiti (la cui soluzione non è stata trattata a lezione ma utili <strong>per</strong> “esercitarsi”).<br />
4. Costruire la <strong>di</strong>stribuzione <strong>di</strong> <strong>frequenza</strong> <strong>per</strong> la variabile Red<strong>di</strong>to sud<strong>di</strong>visa in classi. Calcolare <strong>moda</strong>,<br />
<strong>me<strong>di</strong>a</strong>na, Q1 e Q3. Si decide <strong>di</strong> attribuire un buono pasto agli studenti con red<strong>di</strong>to minore <strong>di</strong> 1,5.<br />
Valutare quanti studenti (qual è la frazione / qual è la <strong>per</strong>centuale <strong>di</strong> studenti) che beneficeranno del<br />
buono pasto.<br />
5. Consideriamo la situazione descritta al punto 4 e supponiamo che si decida <strong>di</strong> cambiare la soglia minima<br />
Soluzione Q.1<br />
<strong>di</strong> red<strong>di</strong>to che attribuisce il <strong>di</strong>ritto al buono pasto: la nuova soglia <strong>di</strong> red<strong>di</strong>to viene fissata a 1 (migliaia <strong>di</strong><br />
euro). Calcolare quanti studenti avranno <strong>di</strong>ritto ad ottenere il buono pasto.<br />
Voto all’esame <br />
18 1 0.05 1 0.05<br />
20 1 0.05 2 0.1<br />
21 1 0.05 3 0.15<br />
23 1 0.05 4 0.20<br />
24 2 0.1 6 0.30<br />
25 4 0.2 10 0.50<br />
26 2 0.1 12 0.60<br />
27 3 0.15 15 0.75<br />
28 1 0.05 16 0.80<br />
29 1 0.05 17 0.85<br />
30 3 0.15 20 1<br />
Totale (n) 20 1<br />
Moda: 25<br />
Primo Quartile: 24<br />
Secondo Quartile (<strong>me<strong>di</strong>a</strong>na):25<br />
Terzo Quartile: 27<br />
2
12-esimo <strong>per</strong>centile = ( ∗<br />
)= . = 21<br />
83-esimo <strong>per</strong>centile = ( ∗<br />
)= . = 29<br />
Me<strong>di</strong>a aritmetica: = ∑ <br />
∗ <br />
Soluzione Q.2<br />
= ∗∗∗⋯<br />
<br />
Distribuzione in classi <strong>per</strong> la variabile Statura<br />
= 25.5<br />
Statura (classi) = + <br />
(150, 160] 4 0.2 4 0.2<br />
() 155 10 0.4<br />
() 0.02<br />
(160, 170] 9 0.45 13 0.65 165 10 0.9 0.045<br />
(170, 180] 6 0.30 19 0.95 175 10 0.6 0.03<br />
(180, 190] 1 0.05 20 1 185 10 0.1 0.005<br />
Totale (n) 20 1<br />
Classe <strong>moda</strong>le: (160,170] essendo un carattere quantitativo continuo organizzato in classi bisogna in<strong>di</strong>viduare la<br />
<strong>moda</strong>lità a cui è associata la più alta densità <strong>di</strong> <strong>frequenza</strong> (assoluta o relativa). Nota <strong>per</strong>ò che in questo caso le<br />
classi sono equiampie e quin<strong>di</strong> è possibile far riferimento alle sole frequenze.<br />
La <strong>me<strong>di</strong>a</strong> aritmetica <strong>per</strong> la variabile Statura organizzata in classi è pari a:<br />
<br />
<br />
= ∑ ∗ <br />
<br />
= ()()⋯<br />
167 cm<br />
<br />
Me<strong>di</strong>ana: <strong>per</strong> dati quantitativi continui organizzati in classi, la determinazione della <strong>me<strong>di</strong>a</strong>na avviene nel modo<br />
seguente:<br />
1. In<strong>di</strong>viduazione della classe <strong>me<strong>di</strong>a</strong>na ( , ): in tale classe cadrà la <strong>moda</strong>lità assunta dall'unità statistica che<br />
occupa la posizione centrale della <strong>di</strong>stribuzione or<strong>di</strong>nata delle <strong>moda</strong>lità. In tal caso corrisponde a (160,170]<br />
2. Il valore che assume la <strong>me<strong>di</strong>a</strong>na nella classe in<strong>di</strong>viduata deve essere calcolato tramite l’o<strong>per</strong>azione <strong>di</strong><br />
interpolazione sulla funzione <strong>di</strong> ripartizione empirica (se si utilizzano le frequenze relative cumulate). Tale<br />
proce<strong>di</strong>mento sarà utile anche <strong>per</strong> la ricerca dei quartili. Utilizzando le frequenze cumulate relative, in generale<br />
sappiamo che il particolare quantile può essere determinato con la seguente:<br />
dove = nel nostro caso <strong>per</strong> cui = 0.5<br />
Avremo quin<strong>di</strong>:<br />
= + − ( − <br />
<br />
)<br />
<br />
3
Nota: = − <br />
= 160 +<br />
170 − 160<br />
(0.5 − 0.2) = 166.66<br />
0.45<br />
L’ espressione utilizzata <strong>per</strong> calcolare la <strong>me<strong>di</strong>a</strong>na (e in generale l’i-esimo quantile) <strong>per</strong> un carattere organizzato in<br />
classi è il risultato della seguente proporzione:<br />
<br />
<br />
?<br />
( − ): − = ( − ): − <br />
= + ( − ) − <br />
( − )<br />
Nel nostro caso avremo quin<strong>di</strong>:<br />
Soluzione Q.3<br />
F( )=0.5<br />
0<br />
− = ( − ) − <br />
( − )<br />
≡ = + − ( − <br />
<br />
)<br />
<br />
. − 0.20<br />
= = 160 + (170 − 160) = 166.66<br />
0.65 − 0.20<br />
Età (classi) () = () = <br />
(20,23] 9 0.45 9 20 0.45 21.5 3 3 0.15<br />
(23,25] 3 0.15 12 11 0.6 24 2 1.5 0.075<br />
(25,27] 6 0.30 18 8 0.90 26 2 3 0.15<br />
(27, 30] 2 0.10 20 2 1 28.5 3 0.66 0.03<br />
20 1<br />
Classe <strong>moda</strong>le: (20,23] e (25,27] <strong>di</strong>stribuzione bi<strong>moda</strong>le<br />
Me<strong>di</strong>a aritmetica: = (.∗)(∗)(∗)(.∗)<br />
=24<br />
<br />
Primo quartile ricade nella classe (20,23]<br />
<br />
<br />
4
Secondo quartile = ricade nella classe (23,25]<br />
Terzo quartile ricade nella classe (25,27]<br />
Per calcolare l’esatto valore <strong>di</strong> , Me, e si procede con l’interpolazione es. sfruttando le frequenze relative<br />
cumulate:<br />
Svolgimento:<br />
. − 0<br />
= 20 + 23 − 20 = 22<br />
0.45 − 0<br />
. − 0.45<br />
= 23 + 25 − 23 = 24<br />
0.60 − 0.45<br />
. − 0.60<br />
= 25 + 27 − 25 = 26<br />
0.90 − 0.60<br />
Nota generale. Si possono usare entrambi gli approcci descritti: applicazione della formula <strong>di</strong>retta e inversa a<br />
seconda del problema (cfr. soluzione 2) o tramite il ragionamento in proporzione sempre a seconda del<br />
problema, il risultato non cambia.<br />
Percentuale <strong>di</strong> studenti intervistati con un età al più pari a 21.<br />
In questo caso siamo interessati alla soluzione del problema inverso: conosciamo = 21 e vogliamo<br />
determinare il rango <strong>per</strong>centile associato a = 21.<br />
La formula generale è come abbiamo visto:<br />
da questa si ricava la formula inversa:<br />
= + − − <br />
<br />
<br />
<br />
= + <br />
<br />
− 5
Che corrisponde al seguente ragionamento in proporzione:<br />
<br />
<br />
<br />
− : − = − : − <br />
:<br />
− = − − <br />
− <br />
= + − − <br />
− <br />
à ù 21 è:<br />
=<br />
<br />
≡ + − <br />
− <br />
<br />
<br />
= 0 + + 0.45<br />
21 − 20 = 0.15 = 15%<br />
23 − 20<br />
Ulteriore approccio (derivato): e’ possibile ragionare in termini proporzionali <strong>di</strong>rettamente in tabella sul numero <strong>di</strong><br />
studenti che hanno un età al più pari a 21 (sfruttando le <strong>frequenza</strong> cumulate assolute associate alla classe che<br />
contiene il valore 21). E’ poi possibile risalire al valore <strong>per</strong>centuale con una semplice trasformazione del risultato.<br />
In particolare:<br />
valore noto=21 N(21)=?<br />
= 20 = 23<br />
= 0 = 9<br />
− : − = 21: 21 − <br />
9 − 0: 23 − 20 = 21: 21 − 20<br />
21 =<br />
9 ∗ 1<br />
3<br />
= 3<br />
F =?<br />
<br />
<br />
6
Solamente 3 studenti hanno un età al più pari a 21. Il corrispondente rango <strong>per</strong>centile sarà:<br />
21 ∗ 100<br />
<br />
= 3 ∗ 100<br />
20<br />
= 0.15 = 15%<br />
Numero <strong>di</strong> studenti con un età minore <strong>di</strong> 25 oppure maggiore <strong>di</strong> 27:<br />
Un modo agevole <strong>di</strong> procedere è “spezzare” il problema:<br />
1. il numero <strong>di</strong> studenti con età minore <strong>di</strong> è pari a N(25)=12 (soluzione banale)<br />
2. il numero <strong>di</strong> studenti con età maggiore <strong>di</strong> 27 è data dal complemento rispetto numero <strong>di</strong> studenti con età<br />
minore <strong>di</strong> 27. In particolare, il numero <strong>di</strong> studenti con età minore <strong>di</strong> 27 è pari a N(27)=18 (anche qui soluzione<br />
banale) <strong>per</strong> cui quelli con età maggiore <strong>di</strong> 27 sono n-N(27)=20-18=2. In realtà si può ragionare più facilmente a<br />
partire dalle frequenze assolute retro cumulate che in<strong>di</strong>cano il numero <strong>di</strong> unità che presentano un valore del<br />
carattere maggiore o uguale ad una certa <strong>moda</strong>lità RN(27)=2.<br />
Il risultato finale è dato da: N(25) +(n-N(27))= 12+2=14<br />
oppure, in maniera del tutto equivalente, utilizzando <strong>di</strong>rettamente le frequenze retro cumulate:<br />
N(25)+RN(27)=12+2=14<br />
Percentuale <strong>di</strong> studenti con età compresa tra 24 e 28<br />
Vuol <strong>di</strong>re, in termini pratici, in<strong>di</strong>viduare la <strong>per</strong>centuale <strong>di</strong> studenti con età almeno pari a 24 e non più grande <strong>di</strong><br />
28. Una possibile (e veloce) strategia in questo caso è:<br />
1. in<strong>di</strong>viduare la <strong>per</strong>centuale <strong>di</strong> studenti con età al più pari a 28.<br />
=27<br />
=0.90<br />
= 28<br />
F =?<br />
Impostando la seguente proporzione<br />
=1<br />
= 30<br />
− : − = − : − <br />
30 − 27: 28 − 27 = 1 − 0.90: 28 − 0.90<br />
7
=23<br />
e risolvendo <strong>per</strong> l’incognita 28 avremo:<br />
28 = 0.90 + ∗.<br />
<br />
= 0.933 ossia 93.3 % degli studenti con età al più pari a 28<br />
2. calcolare quin<strong>di</strong> la <strong>per</strong>centuale <strong>di</strong> soggetti con età al più pari a 24 e “sottrarre” questo valore alla <strong>per</strong>centuale<br />
complessiva <strong>di</strong> studenti con un età al più pari a 28 (in<strong>di</strong>viduata al punto 1).<br />
1. in<strong>di</strong>viduare la <strong>per</strong>centuale <strong>di</strong> studenti con età al più pari a 28.<br />
=0.45<br />
= 24<br />
F =?<br />
Impostando la seguente proporzione<br />
− : − = − : − <br />
25 − 23: 24 − 23 = 0.6 − 0.45: 24 − 0.45<br />
e risolvendo <strong>per</strong> l’incognita 24 avremo:<br />
24 = 0.45 + ∗.<br />
<br />
= 0.525 ossia 52.5 % degli studenti con età al più pari a 24<br />
A questo punto “escludo” (e quin<strong>di</strong> sottraggo) dalla <strong>per</strong>centuale complessiva <strong>di</strong> studenti con al più 28 anni la<br />
<strong>per</strong>centuale <strong>di</strong> tutti quelli che sono più piccoli <strong>di</strong> 24 anni <strong>per</strong> cui 0.933-0.525=0.408.<br />
La <strong>per</strong>centuale <strong>di</strong> studenti con un età compresa tra 24 e 28 è del 40.8%.<br />
Alternativamente (ragionamento speculare):<br />
= 25<br />
=0.6<br />
Percentuale <strong>di</strong> studenti con età maggiore <strong>di</strong> 24= 1-%studenti con età al più pari a 24=1-0.525=0.475<br />
Percentuale <strong>di</strong> studenti con età maggiore <strong>di</strong> 28=1- % studenti con età minore <strong>di</strong> 28=1-0.933=0.067<br />
Dalla proporzione totale degli studenti che hanno più <strong>di</strong> 24 anni, siccome devo includere al massimo studenti che<br />
hanno 28 anni, devo “togliere” la proporzione <strong>di</strong> studenti che hanno un età maggiore <strong>di</strong> 28 che è data dal<br />
complemento a 1 della <strong>per</strong>centuale <strong>di</strong> studenti con al massimo 28 anni. Avremo quin<strong>di</strong>: 0.475-0.067=0.408<br />
8
Soluzione Q.4<br />
Red<strong>di</strong>to (classi) <br />
[0.1, 1) 6 0.3 6 0.3 30 0.55 0.9 6.6<br />
[1,1.9) 6 0.3 12 0.6 60 1.45 0.9 6.6<br />
[1.9, 4.2] 8 0.4 20 1 100 3.05 2.3 3.48<br />
Totale (n) 20 1<br />
Classe <strong>moda</strong>le=[0.1, 1) e [1, 1.9) <strong>di</strong>stribuzione bi<strong>moda</strong>le<br />
Q1=0.85<br />
Me=Q2=1.60<br />
Q3=2.76<br />
Per verificare quanti in<strong>di</strong>vidui si trovano sotto la soglia <strong>di</strong> 1,5 (migliaia <strong>di</strong> euro) che attribuisce loro il <strong>di</strong>ritto ad<br />
ottenere un buono pasto occorre definire:<br />
1. la classe in cui rientrano tali soggetti [1, 1.9) quin<strong>di</strong> l’estremo inferiore della classe è = 1 e l’estremo<br />
su<strong>per</strong>iore è = 1.9<br />
2. il numero (totale) <strong>di</strong> soggetti con un red<strong>di</strong>to minore (o al più pari a 1.5) è pari a:<br />
in termini <strong>per</strong>centili:<br />
1.5 = + <br />
<br />
− = 6 +<br />
<br />
1.5 − 1 = 9.33 ≈ 9<br />
.<br />
1.5<br />
<br />
il 47% degli studenti avrà <strong>di</strong>ritto al buono pasto.<br />
Soluzione Q.5<br />
∗ 100 = 9.33<br />
∗ 100 = 46.65 ≈ 47° <br />
20<br />
Se la nuova soglia <strong>di</strong> red<strong>di</strong>to viene fissata a 1 (migliaia <strong>di</strong> euro) gli studenti che beneficeranno del sussi<strong>di</strong>o sono<br />
esattamente pari a 6 ovvero il 30% del totale degli studenti (soluzione banale).<br />
9


